3678
Proprioceptive engagement in the human cerebellum using 7T-fMRI1Spinoza Centre for Neuroimaging, Amsterdam, Netherlands, 2Computational Cognitive Neuroscience and Neuroimaging, Netherlands Institute for Neuroscience, Amsterdam, Netherlands, 3Vrije Universiteit Amsterdam, Amsterdam, Netherlands
Synopsis
Keywords: fMRI (task based), Brain, cerebellum
The human cerebellum forms an important part of the sensory and motor networks. Specifically, cerebellar damage has been shown to result in difficulty to perform proprioceptive tasks. Hence, studying the functional cerebellar organisation can be of great neuroscientific and clinical interest. This requires high-resolution images due to the thin, highly-foliated cortex of the cerebellum. We investigated the difference between a simultaneous-unilateral-finger-flex (SUFF) and midline-contralateral-finger-touch (MCFT) using B1-shimmed fMRI at 7T. Movements with higher proprioceptive engagement (MCFT) resulted in stronger, more medially located activations on the cerebellar surface compared to movements which are less reliant on proprioception (SUFF).
Introduction
The human cerebellum forms an important part of the sensory and motor networks1,2. An important part of motor control is proprioception: the perception of limb position6. Naturally, the human cerebellum is conjectured to be involved in proprioception. The cerebellum receives proprioceptive information through the spinocerebellar pathways which project on to the anterior lobe and lobule VIII8. Earlier rodent studies postulate that proprioceptive mechanisms are located deeper into the cerebellar fissures compared to exteroceptive mechanisms, which are found more superficially7. Additionally, human cerebellar damage has been shown to result in difficulty to do proprioceptive tasks6,9, such as the localisation of other limbs10. Multiple neurological diseases can affect the cerebellum, often leading to motor impairment3,4,5. Therefore, studying the functional cerebellar organisation using a proprioceptive paradigm can be of great neuroscientific and, potentially, clinical interest. Here, we compare two motor tasks: one more dependent on proprioception (Midline-Contralateral-Finger-Touch) compared to a less proprioception-reliant task (Simultaneous-Unilateral-Finger-Flex). Functional mapping of BOLD responses in the cerebellum requires high-resolution images due to the thin and highly-foliated cerebellar cortex. High-resolution images are more easily achieved at ultra-high field (7T). Though, at higher field strengths, cerebellar images suffer from severely destructive B1-interference, which necessitates multi-channel transmission. In this study, we investigated the cerebellar BOLD response with a proprioceptive paradigm using B1-shimmed, high-resolution fMRI at 7T.Methods
Nine volunteers, ages 24-44, were scanned using a 7T-Phillips MRI-scanner with an 8Tx/32Rx(Nova Medical, USA) whole-head coil. One participant was excluded from the study after self-reported noncompliance to the task. A 3D-EPI slab covering the cerebellum (1mm-isotropic, TR/TE=3288ms/21ms, SENSE=2.6/3.27-AP/RL FOV=192x60x192mm3, α=20°) was recorded while performing a proprioceptive paradigm. A DREAM B1+ map11 was acquired and phase modulations were calculated to optimize the B1+ over the cerebellum using MRCodeTool (Tesla Dynamic Coils, Zaltbommel, NL). A whole-head 0.64mm-isotropic MP2RAGE sequence12 (TR/TE=2.3ms/6.2ms, TI1/TI2=800/2700,TRvolume=5500ms, α=7°/5°, FOV=230x230x185) was acquired to generate cerebellar surfaces (Fig1-A). Each session consisted of four functional runs (5min each) alternating a Simultaneous-Unilateral-Finger-Flex (SUFF) and a Midline-Contralateral-Finger-Touch (MCFT) task block (20s-ON, 10s-OFF) (Fig-1B). Pseudo-randomised finger combinations were fixed across participants and presented for 2s each. The FMRI data were motion/distortion-corrected and a first level GLM (MCFT>rest, SUFF>rest z>3.1 p<0.05) was fitted, followed by a repeated-measures GLM over the first-level runs using FSL13. A cerebellar lobule mask was projected into the anatomical space of each participant14 to divide the cerebellum in four quadrants: the right/left upper quadrant (Lobule I-VI+CrusI) and the right/left lower quadrant (Lobule VIIb+VIII). For each quadrant, maximum z-stats were reported and a paired t-test(p<0.05) was performed between tasks. The 4000 voxels with the highest z-stats were extracted and a weighted centre of gravity (wCOG) was calculated15 for each task. The difference between task wCOGs was reported for each axis: PA(posterior/anterior), RL(right/left) and IS(inferior/superior) to assess the task cluster location with respect to each other. White-matter segmentations were extracted using CAT1216. The segmentations were masked with the cerebellar mask, the brain stem and dura were manually excluded using FSLeyes17. White-matter segmentations were upsampled18, tessellated into a mesh, and unfolded using Nighres19. FMRI activation was projected onto the mesh surface. Paraview20 was used for 3D visualisation.Results
Cerebellar responsesBoth tasks resulted in significant activation for all participants in all four quadrants. MCFT resulted in significantly higher maximum Z-stats than SUFF across participants (P<0.05, paired t-test, Fig-2).
COG differences
Figure 3 presents the differences between the wCOGs of MCFT and SUFF on each axis. MCFT-clusters were found more medial compared to SUFF-clusters in all quadrants (Fig-3A) (i.e., on the RL axis, the distances between task wCOGs were positive-signed in the right quadrants and negative-signed in the left quadrants). Along the IS axis, the difference between wCOGs was positive-signed for most participants, indicating that the SUFF cluster wCOGs were found inferior to MCFT (Fig-3B). Along the PA axis no consistent pattern was found (Fig-3C).
Surface projection
We projected the fMRI results for both tasks on a subject specific cerebellar surface. FMRI projected clusters confirmed the difference between the MCFT and SUFF clusters on the RL axis in all quadrants on an example subject surface (Fig-4).
Discussion
Both tasks reliably engaged the cerebellar hand areas2 across all participants, implying that our particular acquisition and analysis setup, consisting of individual B1-shimmed, 7T, high-resolution fMRI, adequately sampled signal across the cerebellum. Significantly higher z-stats in the MCFT task may indicate that the cerebellum activates more strongly to tasks requiring more proprioceptive information. The distance between MCFT clusters and SUFF clusters, shows that a more medial (and, in the posterior lobe, deeper) area of the cerebellar cortex is engaged with processing of proprioceptive information than a simple motor task. For the posterior lobe, this in line with earlier rodent studies where proprioceptive movements are found deep in the cerebellar fissures7.Conclusion
We successfully compared BOLD responses in the human cerebellum using a motor task with and without a proprioceptive component at 7T. Movements with higher proprioceptive engagement have stronger activations in the cerebellum and their activation pattern is found more medially on the cerebellar surface compared to movements which are less reliant on proprioception.Acknowledgements
We would like to thank our volunteers for participating in this study.References
1. Mottolese, C. et al. Mapping motor representations in the human cerebellum. BRAIN A J. Neurol. 330, 330–342 (2013).
2. Boillat, Y., Bazin, P. L. & van der Zwaag, W. Whole-body somatotopic maps in the cerebellum revealed with 7T fMRI. Neuroimage 211, (2020).
3. D’Mello, A. M. & Stoodley, C. J. Cerebro-cerebellar circuits in autism spectrum disorder. Front. Neurosci. 9, (2015).
4. Weissert, R., Ayache, S. S., Bauer, J. & Wilkins, A. Cerebellar Dysfunction in Multiple Sclerosis. Cerebellar Dysfunct. Mult. Sclerosis. Front. Neurol 8, 312 (2017).
5. Schmahmann, J. D. Disorders of the cerebellum: Ataxia, dysmetria of thought, and the cerebellar cognitive affective syndrome. J. Neuropsychiatry Clin. Neurosci. 16, 367–378 (2004).
6. Bhanpuri, N. H., Okamura, A. M. & Bastian, A. J. Predictive Modeling by the Cerebellum Improves Proprioception. J. Neurosci. 33, 14301–14306 (2013).
7. Voogd, J. What we do not know about cerebellar systems neuroscience. Front. Syst. Neurosci. 8, 227 (2014).
8. Oscarsson, O. Functional Organization of the Spino- and Cuneocerebellar Tracts. Physiol. Rev. 45 (3), 495–522 (1965).
9. Manto, M. et al. Consensus Paper: Roles of the Cerebellum in Motor Control—The Diversity of Ideas on Cerebellar Involvement in Movement. Cerebellum 11, 457 (2012).
10. Weeks, H. M., Therrien, A. S. & Bastian, A. J. Proprioceptive localization deficits in people with cerebellar damage HHS Public Access. Cerebellum 16, 427–437 (2017).
11. Nehrke, K. & Börnert, P. DREAM-a novel approach for robust, ultrafast, multislice B1 mapping. Magn. Reson. Med. 68, 1517–1526 (2012).
12. Marques, J. P. et al. MP2RAGE, a self bias-field corrected sequence for improved segmentation and T 1-mapping at high field. Neuroimage 49, 1271–1281 (2010).
13. M, J., CF, B., TE, B., MW, W. & SM, S. FSL. Neuroimage 62, 782–790 (2012).
14. Diedrichsen, J. A spatially unbiased atlas template of the human cerebellum. Neuroimage 33, 127–138 (2006).
15. Lehmann, G. & Legland, D. Efficient N-Dimensional surface estimation using Crofton formula and run-length encoding. Insight J. (2022) doi:10.54294/WDU86D.
16. Schlerf, J., Ivry, R. B. & Diedrichsen, J. Behavioral/Systems/Cognitive Encoding of Sensory Prediction Errors in the Human Cerebellum. (2012) doi:10.1523/JNEUROSCI.4504-11.2012.
17. M. Jenkinson, C.F. Beckmann, T.E. Behrens, M.W. Woolrich, S. M. S. FSL. Neuroimage 62:, (2012).
18. Avants, B. B., Tustison, N. & Johnson, H. Advanced Normalization Tools (ANTS) Release 2.x. (2014).
19. Huntenburg, J. M., Steele, C. J. & Bazin, P.-L. Nighres: processing tools for high-resolution neuroimaging. 7, 1–9 (2018).
20. Ahrens, James, Geveci, Berk, Law, C. ParaView: An End-User Tool for Large Data Visualization,. Visualization Handbook (2005).
Figures
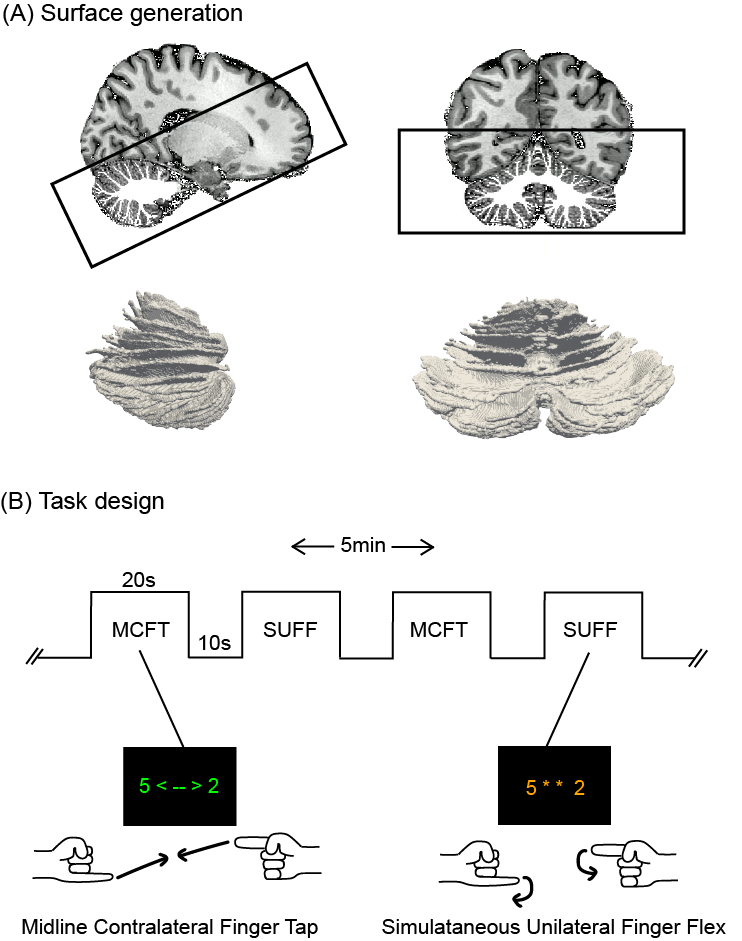
Figure 1: Methods: surface generation and task design (A) Sagittal and coronal view of the 0.64mm isotropic MP2RAGE anatomical acquisition, overlayed with the white matter segmentation as well as the EPI FOV presented by the black box. The 3D rendering of the white matter surface can be seen in both orientations. (B) The timeline for the MCFT and SUFF tasks. The MCFT cues were presented in green font, the SUFF cues in orange font. There were four five minute runs with each a different finger combination series.
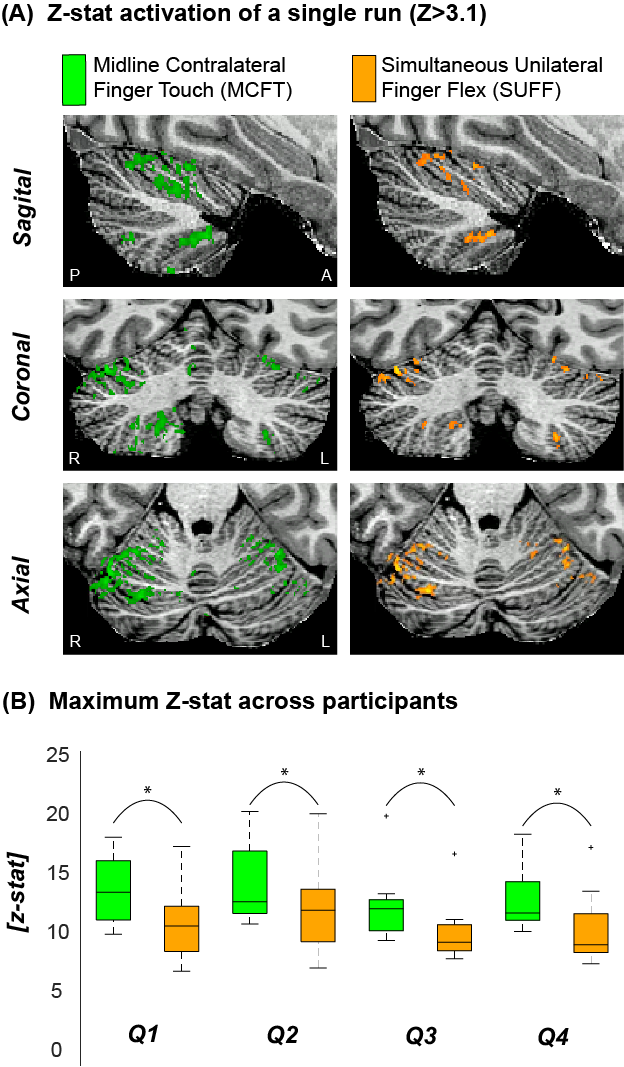
Figure 2: Example activation maps and maximum Z scores (A) The z-stat activation (Z>3.1) of a single run for MCFT and SUFF presented in three orientations (Sagittal, Coronal and Axial) (B) The maximum z-score for each task across participants. Note that the MCFT task resulted in significantly (paired t-test P<0.05) higher max z-stats compared to the SUFF task in all quadrants. Q1=upper right quadrant Q2=Upper left quadrant Q3=Bottom right quadrant Q4=Bottom left quadrant
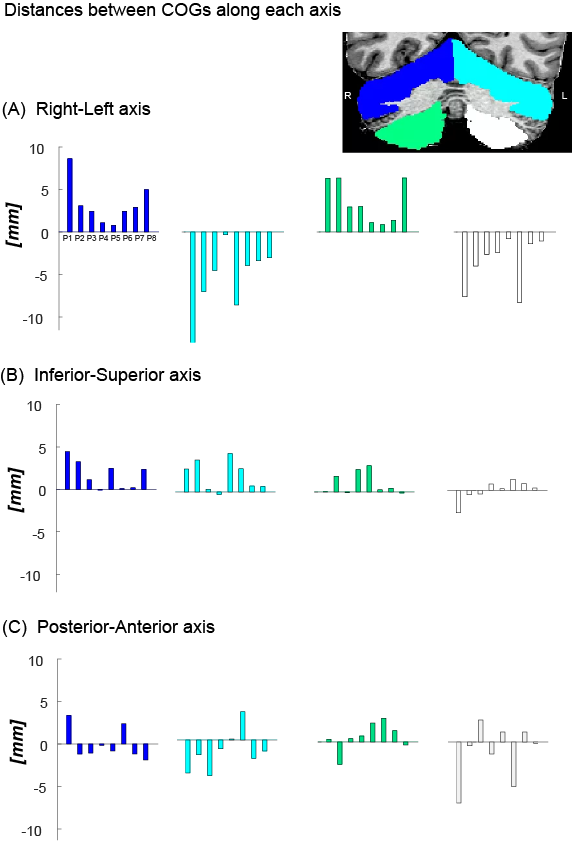
Figure 3: The difference between the wCOG coordinate of the MCFT and SUFF is presented for each participant in each quadrant. (A) Difference along the RL axis. Notice the opposite sign between the left and right quadrant across participants, indicating a mediolateral shift. (B) Difference along the SI axis. Note that most participants have a positively signed difference, indicating MCFT is found more superior compared to SUFF. (C) Difference along the PA axis.
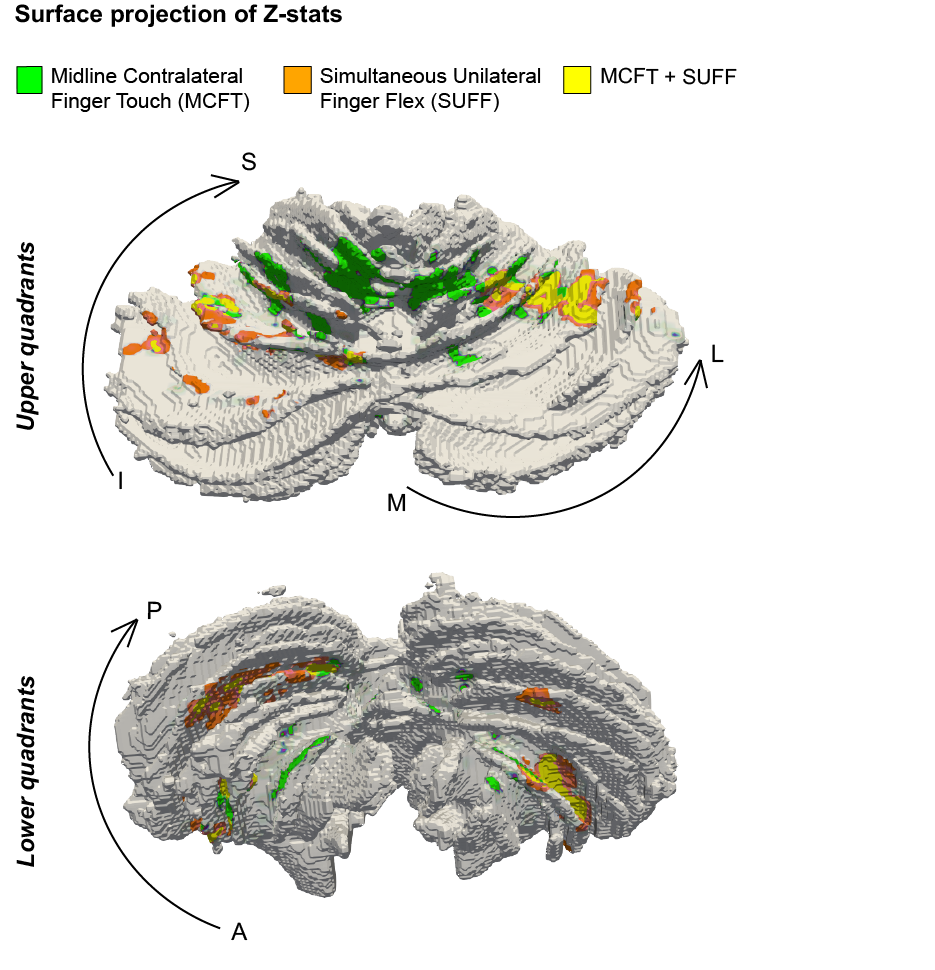
Figure 4: Surface rendering of a single participant. (A) the upper left/right quadrants (B) the lower left/right quadrant. Notice that the MCFT is found more medial compared to the SUFF in all quadrants.