3677
Potential of diffusion fMRI for detecting white matter activity in the human brain1Department of Radiology, CHUV, Lausanne, Switzerland, 2CIBM Center for Biomedical Imaging, Lausanne, Switzerland, 3Signal Processing Lab (LTS5), École Polytechnique Fédérale de Lausanne, Lausanne, Switzerland
Synopsis
Keywords: fMRI (task based), Diffusion/other diffusion imaging techniques, simulations, diffusion fMRI
Diffusion functional Magnetic Resonance Imaging (dFMRI) may be used to study the white matter activation in a more direct way than BOLD. The aim of this work is to extract the decrease in apparent diffusion coefficient (ADC) in the white matter observed in real data, and compare to that in a simulation of realistic axon swelling. Results suggest that the decrease is of low amplitude (<0.5%) but nonetheless detectable.Introduction
Diffusion functional Magnetic Resonance Imaging (dFMRI) has been proposed as an alterative to BOLD with a contrast more closely related to neuronal activity than the hemodynamic response[1]. It is a non-invasive technique which measures timecourses of the apparent diffusion coefficient (ADC) of watermolecules. The assumption is that the morphological fluctuations experienced by brain cells during transitions from rest to activity can be detected as fluctuations in the ADC, which is exquisitely sensitive to microstructure. Due toits independence to neurovascular coupling, dFMRI may then also be used to study the white matter (WM) activity, in which there are much fewer blood vessels than in the gray matter. A decrease in ADC upon sustained stimulation has for example been reported in ex vivo nerve samples or mouse optic nerve[2-4]. In this work, we focus for the first time on ADC timecourses in the human WM in response to a visual and motor task. We compare the amplitude of ADC decrease detected to that expected from a simple simulation of swelling axons.Methods
- Simulation: The Monte Carlo simulation framework developed in[5] was used. A substrate of WM was generated as a group of parallel cylinders representing axons. A voxel of (100 μm)3 was filled with 6000 randomly placed cylinders along the z-axis with radii that followed a Gamma distribution with a mean of 0.5 μm (Figure1). Upon activity, 30% of the cylinders were assumed to increase their volume by 1%, consistent with membrane displacements of a few nm[6]. 106 random walkers with a diffusivity of 2.5 ∗ 10−9 m2/s populated the voxel. Their motion in the intracellular and extracellular space was simulated separately with 7∗105 and 3∗105 walkers, respectively (ICVF = 70%). For active and rest states, the simulation was repeated 8 times with different initial walker positions, and an ADC value was measured using b=200 s/mm2 and b = 1000 s/mm2 in the x, y and z directions. Other simulation parameters were: number of steps=1000, duration of the simulation=0.067s, Δ=0.05, δ=0.0165s, TE=0.067s.
- Experimental data: The data which serves as reference is taken from a previous study[7]. Briefly, data were acquired with Siemens Prisma 3T and Magnetom 7T scanners on 16 subjects. Two modalities were used: (i )DW-TRSE-EPI with pairs of b-values of 200 and 1000 s/mm2 from which ADC timecourses were calculated (temporal resolution: 2s), and (ii) SE-EPI yielding T2-BOLD contrast (temporal resolution: 1s). Volunteers were asked to stare at a cross in the middle ofa screen for 18s and perform finger-tapping with both hands for 12s when viewing a flashing checkerboard (8 Hz). Data were processed as described in[7]. To find task-induced activation without making assumptions about the shape of the response functions, a Finite Impulse Response (FIR) set was used and voxels with a z-score>3.1 were considered significant. Here, WM significant voxels were selected based on brain tissue segmentation, and their responses averaged across trials and subjects. ADC vs BOLD responses in WM were compared at 3T and 7T.
Results and Discussion
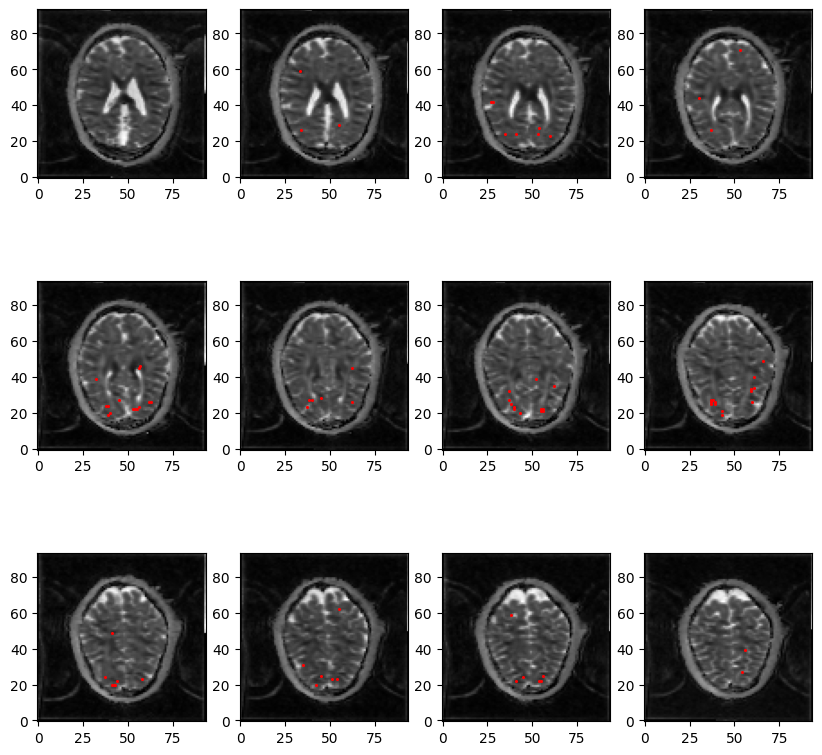
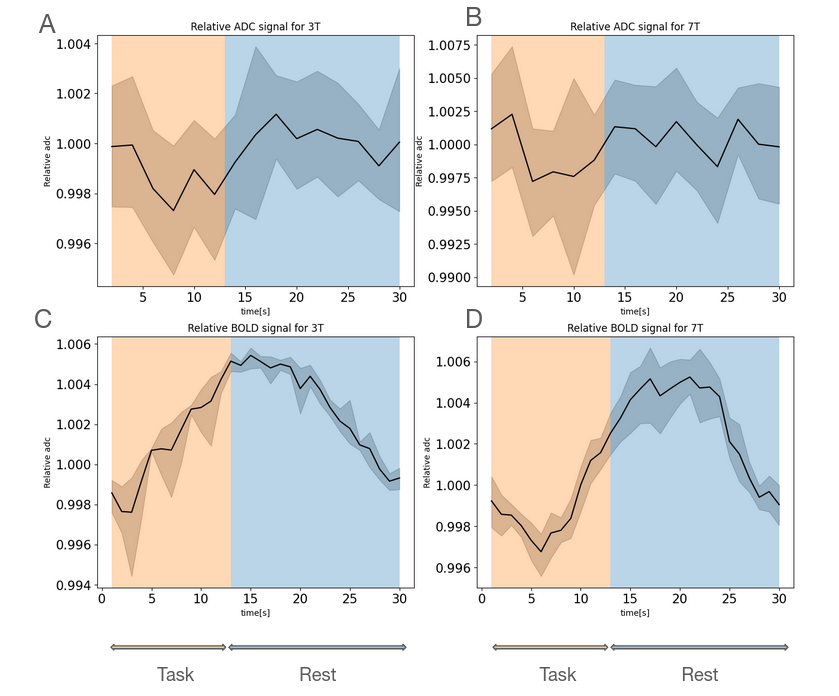
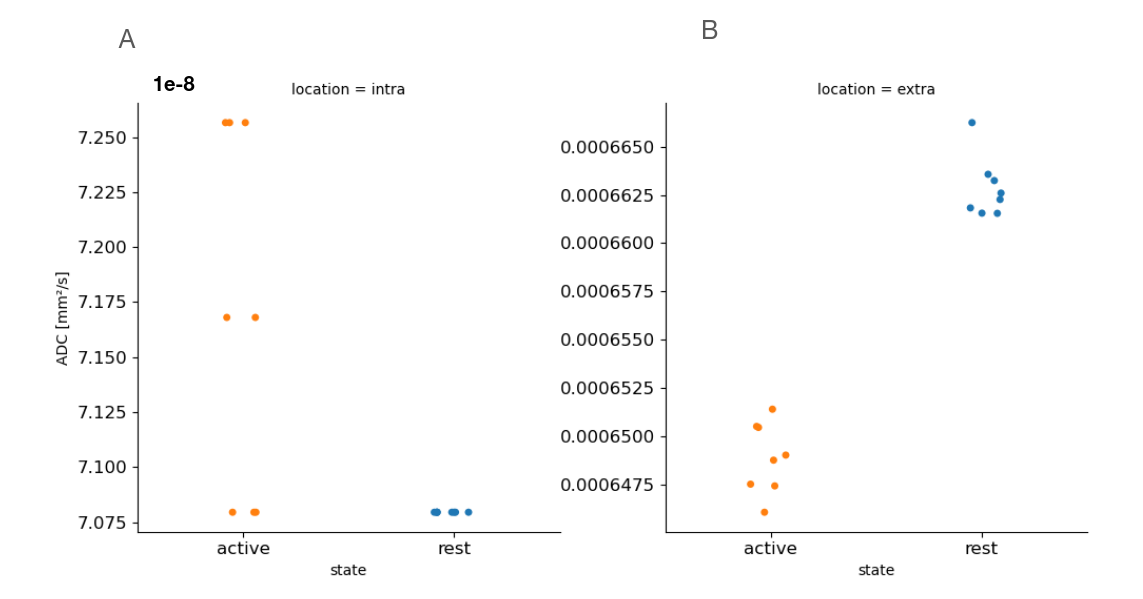
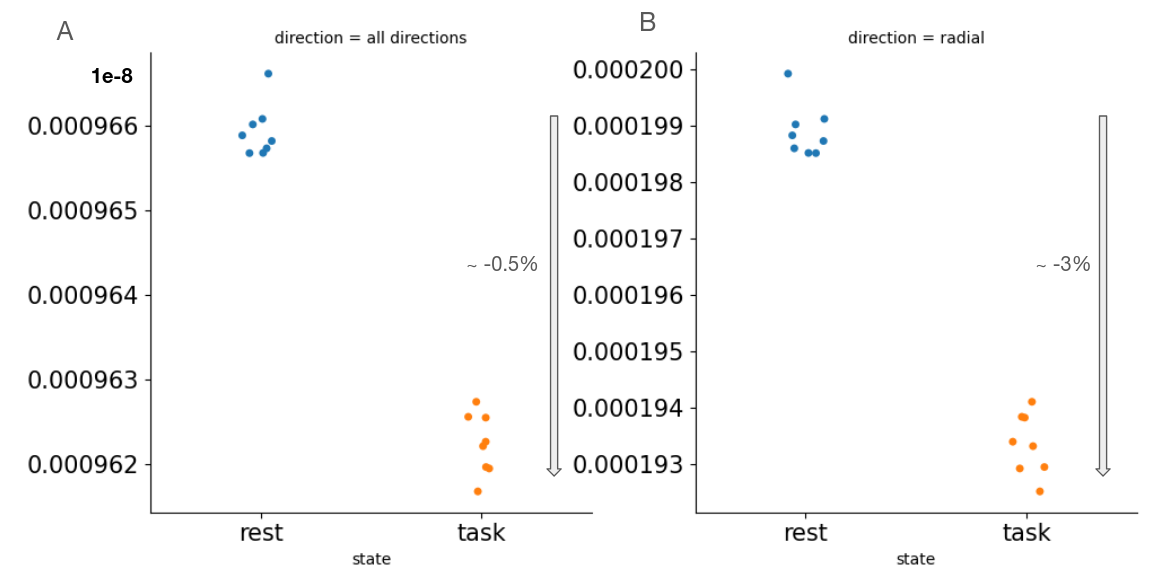
Figure2 shows an example of WM significant voxels overlaid on an ADC map at 3T where voxels can be identified along the visual pathway. The average response curves for the ADC from significant voxels in WM reveal a dip during task at both 3T and 7T, peaking around 8s and returning to baseline upon task termination (see Figure3). When studying the gray matter, larger susceptibility effects at higher fields may induce ADC contamination by BOLD, as previously also reported[7]. Because there are fewer blood vessels in WM, this effect is not detectable and the ADC signal for 7T and 3T show a similar pattern. The average BOLD responses displayed an expected pattern of delayed increase and decrease though much weaker and dispersed in time than typical BOLD cortical responses. The simple simulation of axons swelling resulted in an overall ADC decrease in the substrate of 0.48% (see Figures 4 and 5). At the compartment level, ADC⊥,intra is very slow but increases with swelling and ADC⊥,extra is faster but decreases with swelling. The overall voxel ADC decreases as a combination of decreased ADC⊥,extra and increased ADC⊥,intra. Remarkably, the amplitude in the ADC decrease in the simulation and in the experimental 3T data are close (0.48% and 0.27% respectively). However, several aspects hamper a direct comparison. Experimentally, the diffusion-weighting was applied in one arbitrary direction, which yields spatially variable sensitivity to axonal fluctuations depending on the fiber orientations. In the simulation, approximating the WM as a distribution of straight cylinders is a strong simplification. Axons are more tortuous in real tissue, and may deform during activation, which could generate more pronounced ADC changes.Conclusion and Future works
In summary, we examine the potential of dfMRI in human WM, where BOLD sensitivity is weak due to reduced blood pool. The ADC response to task in the WM is distinct from BOLD, as previously also reported in the cortex.The amplitude of ADC decrease is within the range expected from a simple simulation. Future work will focus on two fronts: (i)experimentally boost the ADC sensitivity to WM fiber fluctuations independently of their orientation in the brain, and (ii)perform simulations in much more realistic substrates of WM and activity-induced fluctuations.Acknowledgements
This work was supported by a SNSF Spark grant CRSK-2_190882 and a SERI Starting Grant MB22.00032. IJ is supported by a SNSF Fellowship PCEFP2_194260.References
[1] Denis Le Bihan, Shin ichi Urayama, Toshihiko Aso, Takashi Hanakawa, andHidenao Fukuyama. Direct and fast detection of neuronal activation in thehuman brain with diffusion mri. Proceedings of the National Academy ofSciences, 103(21):8263–8268, 2006.
[2] Tsen-Hsuan Lin, William M. Spees, Chia-Wen Chiang, Kathryn Trinkaus,Anne H. Cross, and Sheng-Kwei Song. Diffusion fmri detects white-matterdysfunction in mice with acute optic neuritis. Neurobiology of Disease, 67:1–8, 2014.
[3] William M. Spees, Tsen-Hsuan Lin, and Sheng-Kwei Song. White-matterdiffusion fmri of mouse optic nerve. NeuroImage, 65:209–215, 2013.
[4] William M. Spees, Tsen-Hsuan Lin, Peng Sun, Chunyu Song, Ajit George,Sam E. Gary, Hsin-Chieh Yang, and Sheng-Kwei Song. Mri-based assessmentof function and dysfunction in myelinated axons. Proceedings of the NationalAcademy of Sciences, 115(43):E10225–E10234, 2018.
[5] Jonathan Rafael-Patino, David Romascano, Alonso Ramirez-Manzanares,Erick Jorge Canales-Rodr ́ıguez, Gabriel Girard, and Jean-Philippe Thiran.Robust monte-carlo simulations in diffusion-mri: Effect of the substrate com-plexity and parameter choice on the reproducibility of results. Frontiers inNeuroinformatics, 14, 2020.
[6] Tong Ling, Kevin C. Boyle, Valentina Zuckerman, Thomas Flores, CharuRamakrishnan, Karl Deisseroth, and Daniel Palanker. High-speed interfero-metric imaging reveals dynamics of neuronal deformation during the actionpotential. Proceedings of the National Academy of Sciences, 117(19):10278–10285, 2020.
[7] Wiktor Olszowy, Yujian Diao, and Ileana O. Jelescu. Beyond bold: Evidencefor diffusion fmri contrast in the human brain distinct from neurovascularresponse. bioRxiv, 2021.
Figures
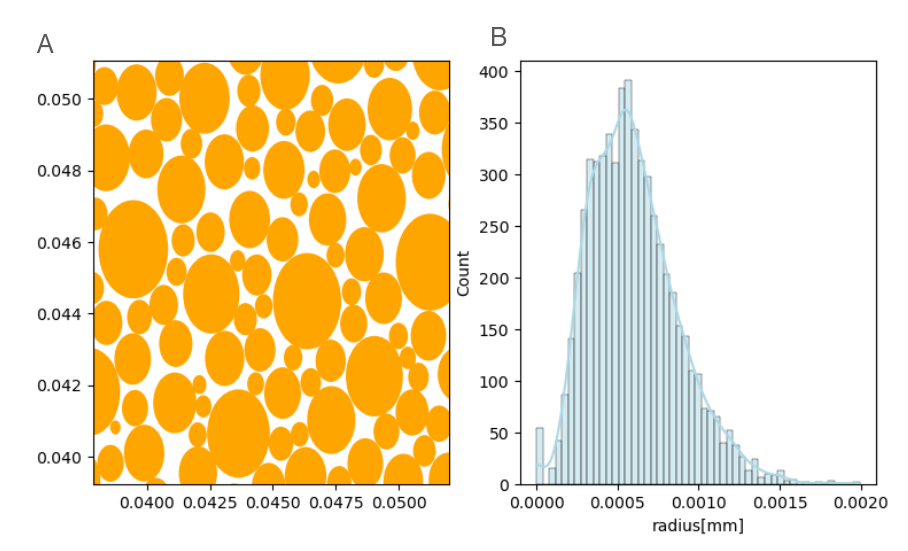
Fig1: (A) Portion of a slice of the 6000 cylinders which represent axons of the white matter in the simulation and (B) the gamma distribution (α = 5, β = 0.12) of their radii.