3675
Separation of sensory and attention input to the human primary somatosensory cortex by spin- and gradient-echo BOLD fMRI1Center for Neuroscience Imaging Research, Suwon, Korea, Republic of, 2Sungkyunkwan University, Suwon, Korea, Republic of
Synopsis
Keywords: fMRI, Brain
High spatial resolution laminar specific fMRI has a potential to separate between top-down and bottom-up signals. In this study, we investigated the effect of attention across cortical layers in the human S1 using SAGE-EPI sequence. fMRI experiments during vibrotactile stimulation with passive and attention tasks with 0.8mm isotropic resolution at 7T were performed. We demonstrated that the SE-BOLD can identify laminar profiles of bottom-up and top-down processes: the laminar profile of passive task showed the peak at layer 4, but that of attention task showed the peak at the superficial layers.Introduction
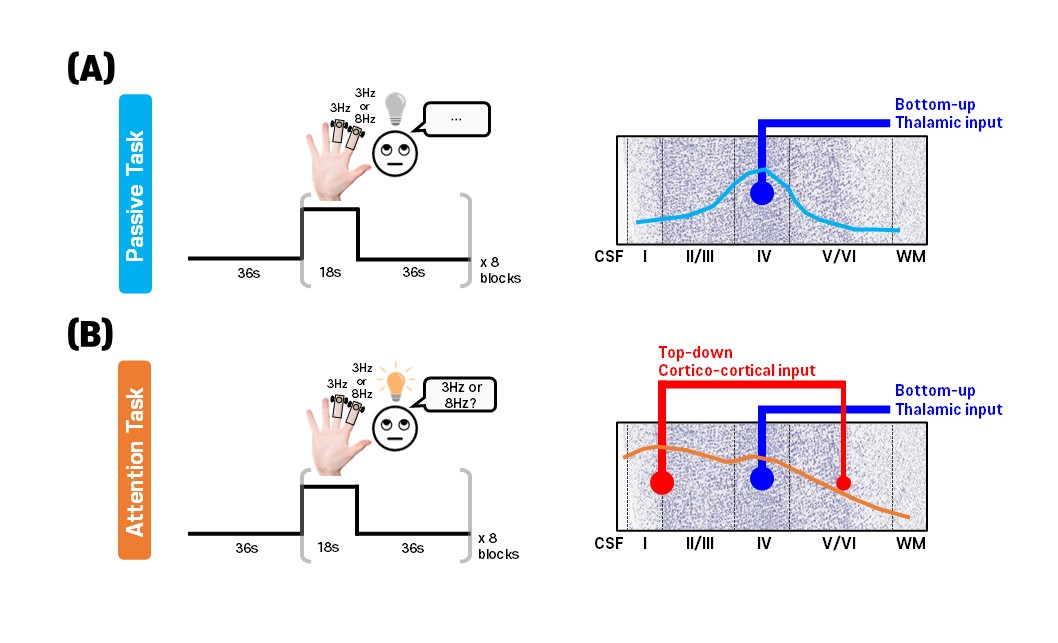
Separation between top-down and bottom-up signals is important for determining neural circuits in humans, which may be achieved by laminar-specific high spatial resolution fMRI1-3. Attention is critical for human behavior, and its top-bottom process is expected to induce neural activation in the superficial and deep layers within human sensory cortices4-5. In the primary somatosensory cortex (S1), the laminar input of attention has not been precisely investigated to date. In this work, we investigated the effect of attention across cortical layers in the human S1 by performing two different experiments: 1) passive-task in which the thalamic input preferentially projects on layer 4, and 2) attention-task, where the signal consists of the integration of the bottom-up processes at layer 4 and the top-down processes at layer 2/3 and layer 5/6 (schematically depicted in Fig.1). To distinguish bottom-up and top-down processes, the highly laminar-specific spin-echo (SE)-BOLD-contrast might be a good candidate6. However, the gradient-echo (GE)-BOLD-signal is highest in the cortical surface due to the high density of draining veins7-8, which is distal to neuronal activation. To compare laminar-resolution SE- and GE-BOLD-fMRI, 0.8mm-isotropic fMRI was acquired with the multi-shot spin- and gradient-echo (SAGE)-EPI sequence9 at 7T, while participants paid attention to vibrotactile stimuli or no attention at all. We demonstrated the SE-BOLD-contrast can identify laminar inputs of feedback attention in the sensory cortex.Methods
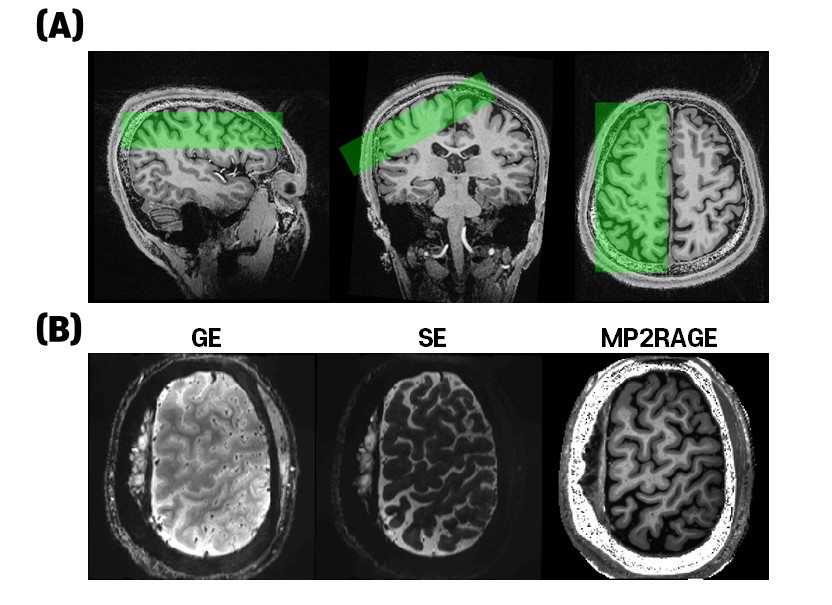
Four subjects participated in this study. All procedures followed the guidelines of the IRB of Sungkyunkwan University, South Korea. All measurements were performed on a 7T-scanner (MAGNETOM-Terra, Siemens-Healthineers), equipped with a 32-channel head-coil (NOVA-Medical). To investigate the attention effect in the human S1, we selected the S1 region, and the slices were aligned perpendicular to the central sulcus as shown in Fig.2A. Subjects received vibrotactile stimulation paradigm (initial 36s-resting and 8-blocks of alternating 18s-vibrotactile stimulation and 36s-resting), lasting 7.8-min. Vibrotactile stimulation was generated by a piezoelectric device (Dancer design, St. Helens, UK) equipped with 6-mm diameter electrodes and was given at a frequency of 3Hz to the middle finger and a frequency of 3Hz or 8Hz to the index finger randomly. Based on the vibrotactile stimuli, two different experiments were performed: 1) passive-task, and 2) attention-task, in which participants were asked to distinguish whether the frequency of the stimulation applied to the index finger was 3Hz or 8Hz. Four runs were repeated for each experiment. The imaging parameters for multi-shot SAGE-EPI10 were as follows: 0.8mm-isotropic resolution, Rin-plane=9 (for each-shot; effective Rin-plane=3 by 3-shots), FOV=144×144mm2, 35slices, flip-angle-pair=90°-180°, partial-Fourier=6/8, shot-TR=3000ms, and TEGE/TESE=14/57ms. To perform distortion correction of the EPI images, FLASH images with the same imaging parameters as the SAGE-EPI were acquired, except for TEs=3.3, and 6.3, and flip-angle=50°. Anatomical images were acquired using the MP2RAGE sequence with imaging parameters: sagittal-orientation, 0.7mm-isotropic-resolution, FOV=224×210×168mm3, Rin-plane=3, TIs=1.0 and 3.2s, TR=4500ms, flip-angle=4°.Results
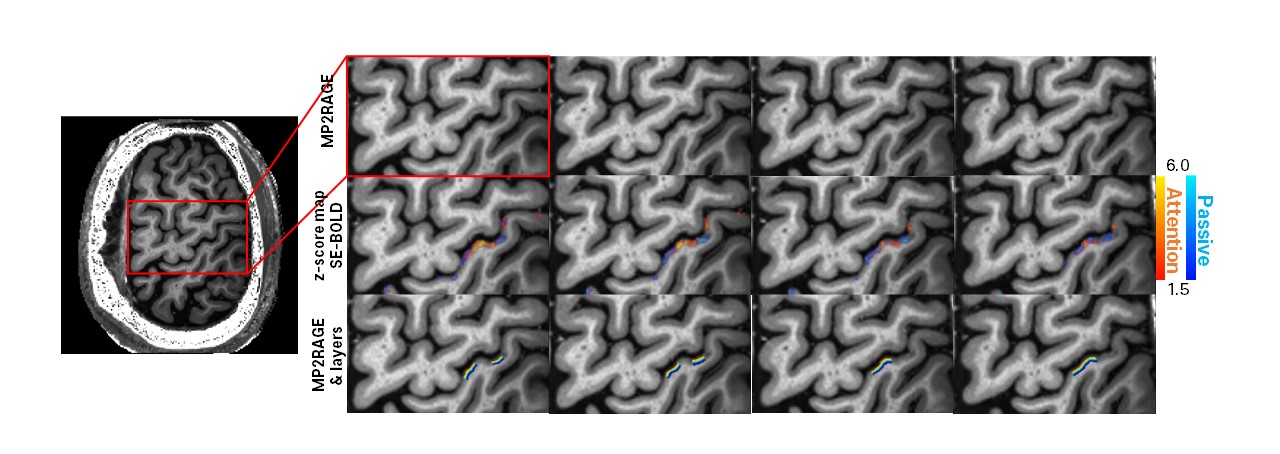
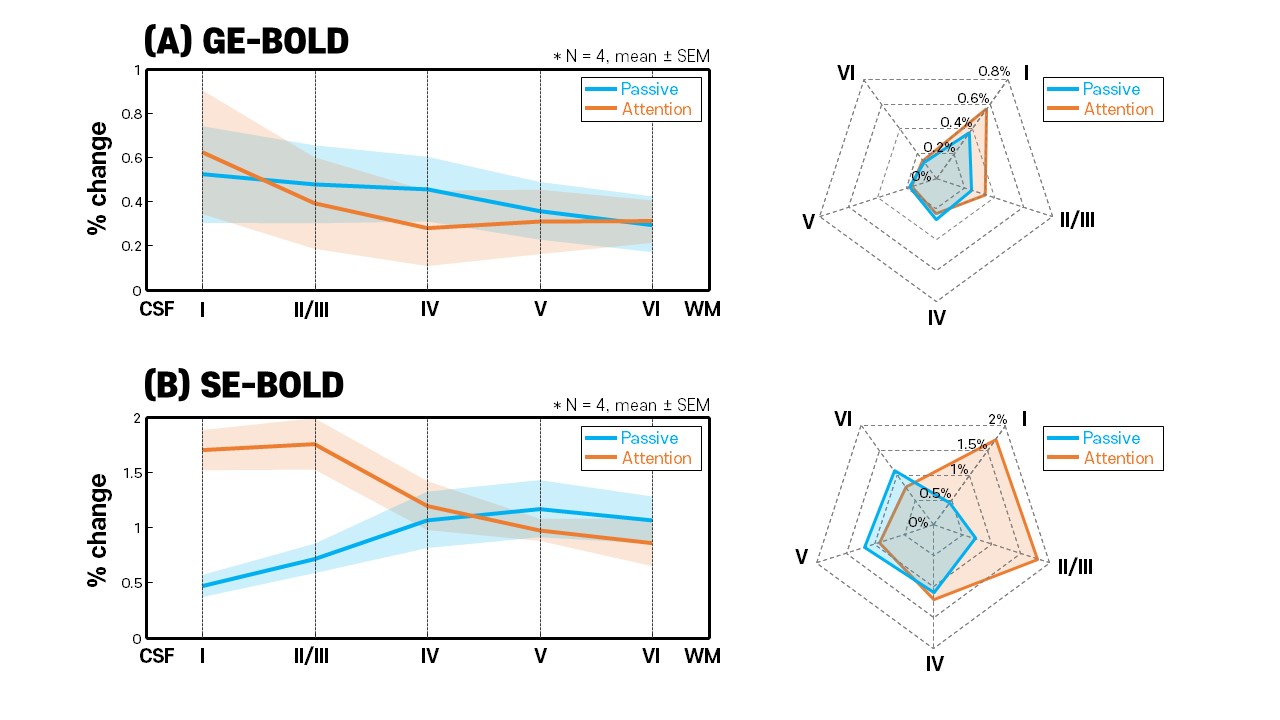
GE- and SE-EPI images from the SAGE-EPI sequences, and MP2RAGE images co-registered onto SE-EPI images were shown in Fig.2B. By identifying CSF, gray matter, and white matter in the MP2RAGE image, it was possible to create a layer mask registered in the functional image. Fig.3 showed four example-slices to illustrate how the layer mask was created. The first row showed the anatomical MP2RAGE images, and the second row showed the z-score map of SE-BOLD in the “passive” (blue) and “attention” (red) tasks. Overall, the z-score values from the attention-task were higher and more widely distributed compared to the passive-task. In order to reduce the bias according to the location of the activation-region, as shown in the third row of Fig.3, the layers were drawn by considering only the region where the z-score values of the passive-task and the attention-task overlapped. To generate a cortical depth mask, the image was upsampled 4-times with cubic interpolation (200μm in-plane resolution), the cortex was divided into 10-equidistant depths, and then the cortical depth was determined using the software suite LAYNII. After creating a layer for each slice, laminar profiles were calculated by averaging the slices to improve statistical power and minimize bias in single slice selection. Fig.4A and 4B showed laminar profiles and radar plots of GE- and SE-BOLD-contrasts, respectively. For the GE-BOLD-signal, the percent signal change peaked at the cortical surface near the high-intensity CSF region for both passive and attention tasks. However, for the SE-BOLD-signal for passive-task, the percent signal change was weak near the CSF region and high in layer 4, which is associated with bottom-up processes. For the SE-BOLD-signal for the attention-task, the percent signal change peaked in superficial layer 1 to 3 associated with the top-down process.Discussion and conclusion
We demonstrated the feasibility of SAGE-EPI sequence at 7T to characterize bottom-up and top-down processes in the sensory cortex at 0.8mm isotropic resolution for laminar fMRI by examining attention task. Experimental results showed that SE-BOLD successfully discriminated the difference between passive-task and attention-task at superficial layer associated with top-down process. An interesting observation is that top-down attention is observed in superficial layers, but not in deep cortical layers. As expected, GE-BOLD showed similar trend of cortical profiles between two tasks despite higher percent signal changes in the attention-task. SE-BOLD may play an important role for investigating mesoscopic cortical-circuits in the human brain with high specificity.Acknowledgements
This work was supported by the Institute of Basic Science under grant IBS-R015-D1 and grant from the National Research Foundation of Korea from the Korean government (2022R1l1A1A01065728).References
[1] Dumoulin SO, Fracasso A, van der Zwaag W, et al. Ultra-high field MRI: advancing systems neuroscience towards mesoscopic human brain function. NeuroImage. 2017;http://dx.doi.org/10.1016/j.neuroimage.2017.01.028.
[2] Koopmans PJ, Barth M, Norris DG. Layer-specific BOLD activation in human V1. Hum. Brain Mapp. 2010;31(9):1297–1304.
[3] Yu Y, Huber L, Yang J, et al. Layer-specific activation of sensory input and predictive feedback in the human primary somatosensory cortex. Sci. Adv. 2019;5:eaav9053.
[4] Anderson JC, Martin KAC. The synaptic connections between cortical areas V1 and V2 in macaque monkey. J. Neurosci. 2009;29(36):11283–11293.
[5] Rockland KS, Virga A. Terminal arbors of individual “Feedbak” axons projecting from area V2 to V1 in the macaque monkey: a study using immunohistochemistry of anterogradely transported Phaseolus vulgaris-leucoagglutinin. J. Comp. Neurol. 1989;285(1):54–72.
[6] Yacoub E, Duong TQ, Van De Moortele PF, et al. Spin-echo fMRI in humans using high spatial resolutions and high magnetic fields. Magn. Reson. Med. 2003;49:655–664 doi: 10.1002/mrm.10433.
[7] Kim SG, Ugurbil K. High-resolution functional magnetic resonance imaging of the animal brain. Methods 2003;30:28–41 doi: 10.1016/S1046-2023(03)00005-7.
[8] Zhao F, Wang P, Kim SG. Cortical Depth-Dependent Gradient-Echo and Spin-Echo BOLD fMRI at 9.4T. Magn. Reson. Med. 2004;51:518–524 doi: 10.1002/mrm.10720.
[9] Han SH, Eun SG, Cho H et al. Improved laminar specificity and sensitivity by combining SE and GE BOLD singnals. Neuroimage. 2022;264(1):119675
Figures