3674
Increasing MT contrast in laminar fMRI using PUSH pTx pulses
Viktor Pfaffenrot1, David Leitao2,3, Annika Verheyen1, Markus May1,4, Raphael Tomi-Tricot5, Shaihan Malik2,6, and David Norris1,7
1Erwin L. Hahn Institute for Magnetic Resonance Imaging, University of Duisburg-Essen, Essen, Germany, 2Biomedical Engineering Department, School of Biomedical Engineering and Imaging Sciences, King's College London, London, United Kingdom, 3London Collaborative Ultra high field System (LoCUS), London, United Kingdom, 4High Field and Hybrid MR Imaging, University Duisburg-Essen, University Hospital Essen, Essen, Germany, 5MR Research Collaborations, Siemens Healthcare Limited, Frimley, United Kingdom, 6Centre for the Developing Brain, School of Biomedical Engineering and Imaging Sciences, King's College London, London, United Kingdom, 7Donders Institute for Brain, Cognition and Behaviour, Radboud University Nijmegen, Nijmegen, Netherlands
1Erwin L. Hahn Institute for Magnetic Resonance Imaging, University of Duisburg-Essen, Essen, Germany, 2Biomedical Engineering Department, School of Biomedical Engineering and Imaging Sciences, King's College London, London, United Kingdom, 3London Collaborative Ultra high field System (LoCUS), London, United Kingdom, 4High Field and Hybrid MR Imaging, University Duisburg-Essen, University Hospital Essen, Essen, Germany, 5MR Research Collaborations, Siemens Healthcare Limited, Frimley, United Kingdom, 6Centre for the Developing Brain, School of Biomedical Engineering and Imaging Sciences, King's College London, London, United Kingdom, 7Donders Institute for Brain, Cognition and Behaviour, Radboud University Nijmegen, Nijmegen, Netherlands
Synopsis
Keywords: fMRI, Magnetization transfer, laminar fMRI
The GRE-BOLD contrast used in laminar fMRI suffers from suboptimal specificity due to unwanted extravascular effects. Recently, efforts were made to increase specificity of GRE-BOLD by means of CBV-weighting using the magnetization transfer contrast. The specificity improvement depends on the amount of selective GM signal reduction. We investigate whether PUSH pTx pulses, designed to maximize MT contrast in a given area, can achieve a higher functional contrast. Our results suggest that when opting for high-power, off-resonant MT pulses, both PUSH and a CP2+ mode perform equally well in increasing the functional contrast at short TE compared to GRE-BOLD in V1.Introduction
Recently, laminar fMRI experiments using GRE-BOLD in combination with MT-preparation1 indicate an increase in sensitivity toward the microvascular blood compartment by effectively performing a CBV-weighting and reducing unwanted extravascular effects from large unspecific venous vessels2. The specificity improvement depends on the amount of GM signal reduction without blood signal loss achieved with MT, which is limited by SAR and RF power. In this preliminary work, we capitalize on existing parallel transmission (pTx) technology and modify the recently proposed PUSH pulses3 to maximize the MT effect in a given ROI and investigate how this affect laminar fMRI profiles.Methods
The sequence consists of an off-resonant MT-module followed by a center-out, multi-echo 3D FLASH readout.Experiments were performed on 1 male subject (33 years old) at a 7T (MAGNETOM Terra, Siemens Healthcare, Erlangen, Germany) scanner used in pTx mode with an 8Tx/32Rx head coil (Nova Medical, Wilmington, USA). A 252x252x32 matrix were scanned with a monopolar readout at 4 different TEs ranging from 1.86 ms to 9.12 ms. The echo spacing was 2.42 ms, TR was 11.6 ms and FA was 6°. Both PE dimensions in the 3D readout were sampled center-out and the primary PE dimension was 3-fold undersampled and 7-fold segmented. The segment TR, i.e. time between two MT pulses, was 179 ms and volume TR was 40.1 s. We performed a flickering checkerboard fMRI experiment split into 6 pseudo-random runs, 2 without MT-preparation, 2 with MT-preparation using a 4 ms long Gaussian MT-pulse played out with CP2+ excitation mode to improve power efficiency in V1 (referred to as MT-prep in the following) and 2 runs using a 4 ms PUSH-1 pTx pulse (referred to as MT-PUSH). Both MT-pulses were played out at -1.5 kHz off-resonance and 98 dummy shots preceded each run to reach a steady state. The PUSH-1 pulse was designed to maximize B1,rms in an ROI covering V1 within a SAR constraint of 90 % 1st level mode (Fig. 1). The amplitude of the Gaussian MT-pulse was scaled to match the SAR achieved with the PUSH pulse.
Structural data were acquired with an MP2RAGE sequence and processes with FreeSurfer to estimate WM and pial surface boundaries. Functional data were processed using SPM12 for motion correction and linear detrending. Coregistration was performed with ITK-SNAP. The processed functional data were equidistantly sub-sampled between WM and pial boundary to create laminar profiles for each echo. For each volume, the multi-echo profiles were extrapolated toward TE = 0 ms using nonlinear fitting in MATLAB before GLM fitting.
Results
Fig. 1A,B shows the predicted B1,rms in V1 using the CP2+ (A) and the PUSH‑1 pulse (B) (mean ± std within black optimization volume below each panel) indicating a gain in maximum B1,rms in the occipital pole. This translates into a more favorable MTR (Fig. 1D compared to 1C, MTR of GM in V1 below each panel).In Fig. 2, smoothed maps of functional signal change (anatomical informed smoothing using Laynii4) for all measured echoes and conditions are shown. While at the 1st measured TE, signal change for BOLD is visually absent, both MT preparations show signal change in GM. At longer TE, the BOLD response comes primarily from areas in and around large veins while both MT-prep and MT-PUSH are less biased toward those veins.
Profiles at rest in V1 are shown in Fig. 3 for BOLD (A), MT-prep (B) and MT-PUSH (C). The activation profiles (D-F) indicate less extravascular (EV) effects with both MT preparation methods compared to BOLD and a higher signal change in the parenchyma at the 0 ms TE and at the 1st measured TE.
Discussion
Similar to previous work1,2, the presented results indicate that MT preparation increases specificity by reducing EV contributions in GRE-BOLD (profiles in Fig. 2 are closer together) and increasing signal change in the parenchyma at very short TE. In this work, we achieved 25 – 30 % GM signal reduction with pulses played out at a larger frequency offset than in our previous work2 and therefore reducing the amount of unwanted suppression of blood signals. This increased the functional contrast. The preliminary data in Fig. 3 suggests that a power matched CP2+ transmission mode performs on average equally well compared to a more dedicated PUSH pulse if V1 is the area of interest. However, PUSH adds the flexibility to increase the MT contrast in any given ROI resulting in a more favorable functional contrast. Future work on more subjects will be performed to investigate the generalizability of MT-PUSH for laminar fMRI.In summary, PUSH pulses can potentially be used to achieve a higher MT contrast in a given ROI within SAR limits increasing the more specific functional contrast in MT-weighted laminar fMRI.
Acknowledgements
This work was funded by Mercur grant Ko-2021-0010 and DFG grant 432657511.References
1. Schulz, J., Fazal, Z., Metere, R., Marques, J. P. & Norris, D. G. Arterial blood contrast (ABC) enabled by magnetization transfer (MT): A novel MRI technique for enhancing the measurement of brain activation changes. bioRxiv (2020) doi:10.1101/2020.05.20.106666.
2. Pfaffenrot, V. & Koopmans, P. J. Magnetization transfer weighted laminar fMRI with multi-echo FLASH. Neuroimage 264, 119725 (2022).
3. Leitão, D. et al. Parallel transmit pulse design for saturation homogeneity (PUSH) for magnetization transfer imaging at 7T. Magn. Reson. Med. 88, 180–194 (2022).
4. Huber, L. (Renzo) R. et al. LayNii: A software suite for layer-fMRI. Neuroimage 237, 118091 (2021).
Figures
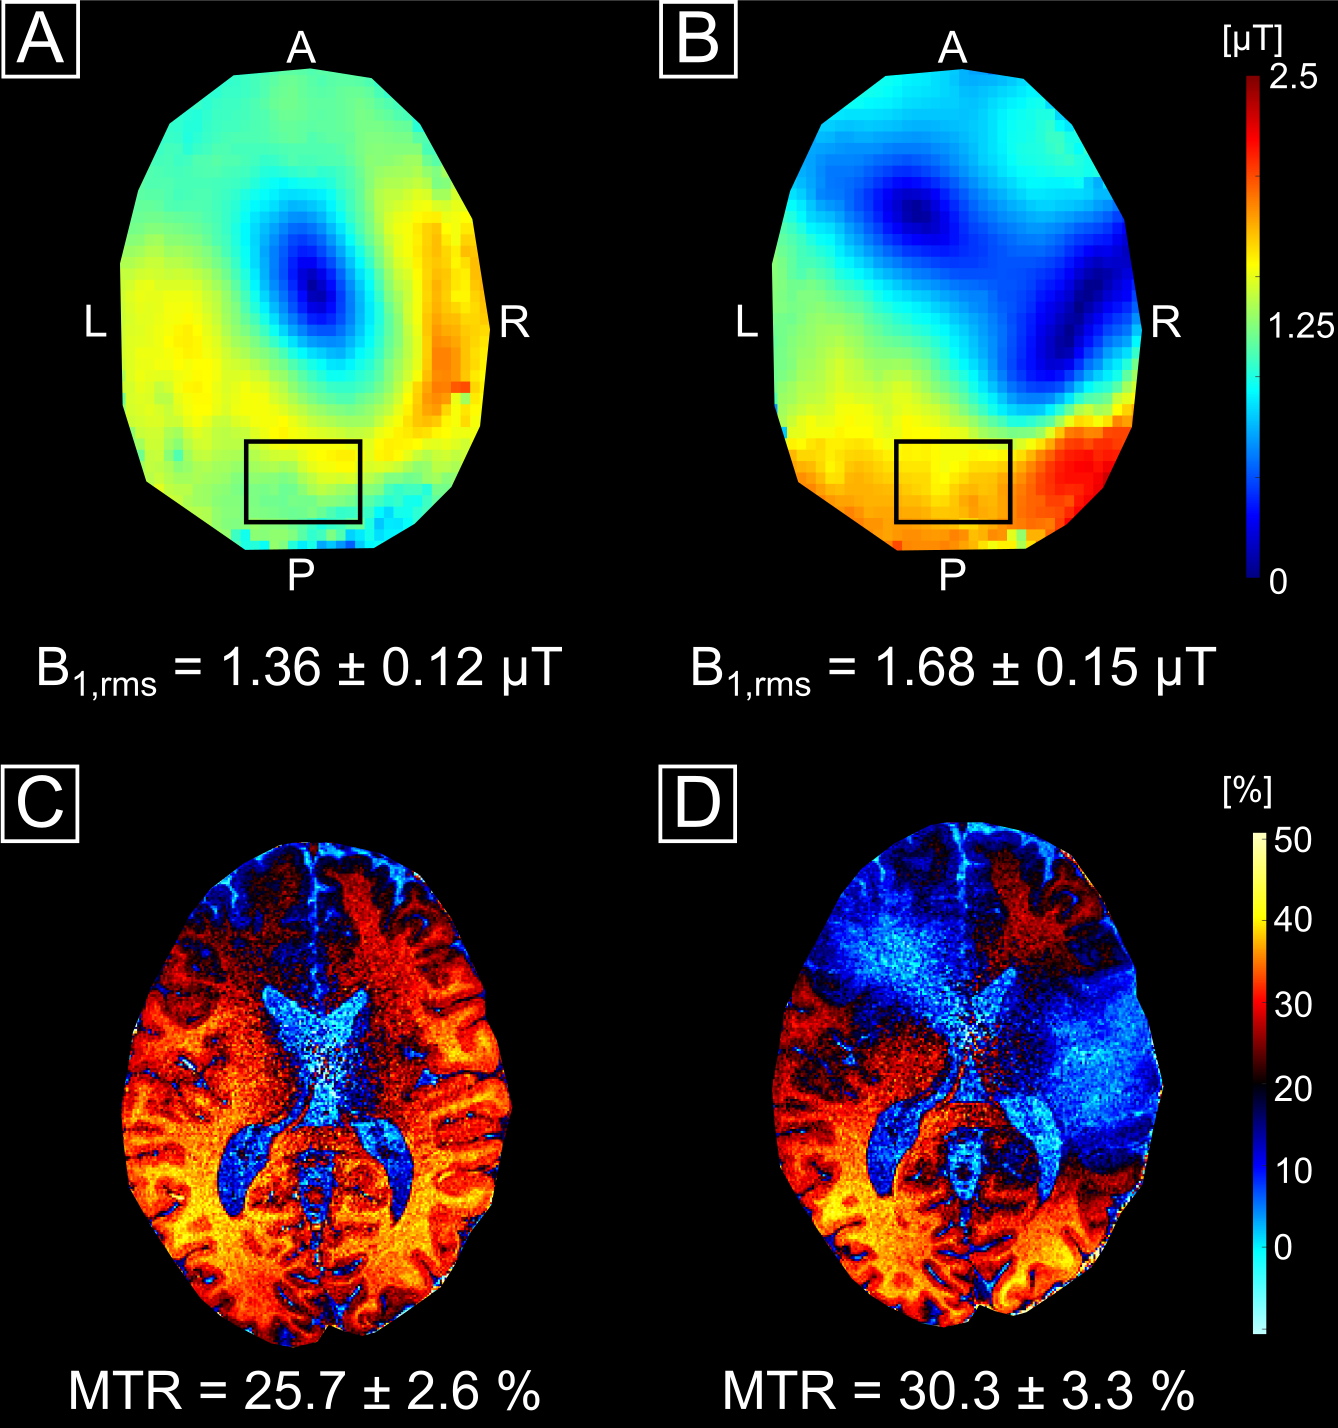
Predicted B1,rms when opting for maximum B1,rms in the black ROI for a Gaussian pulse played out with the CP2+ mode (A) and for the PUSH-1 pulse (B). The values below (A) and (B) are volume averages. Within a 90 % 1st level SAR mode limit, the PUSH-1 pulse achieves a higher MTR in visual GM (D) compared to a Gaussian played out with a CP2+ mode (C). The values below (C) and (D) are averages of GM in V1.
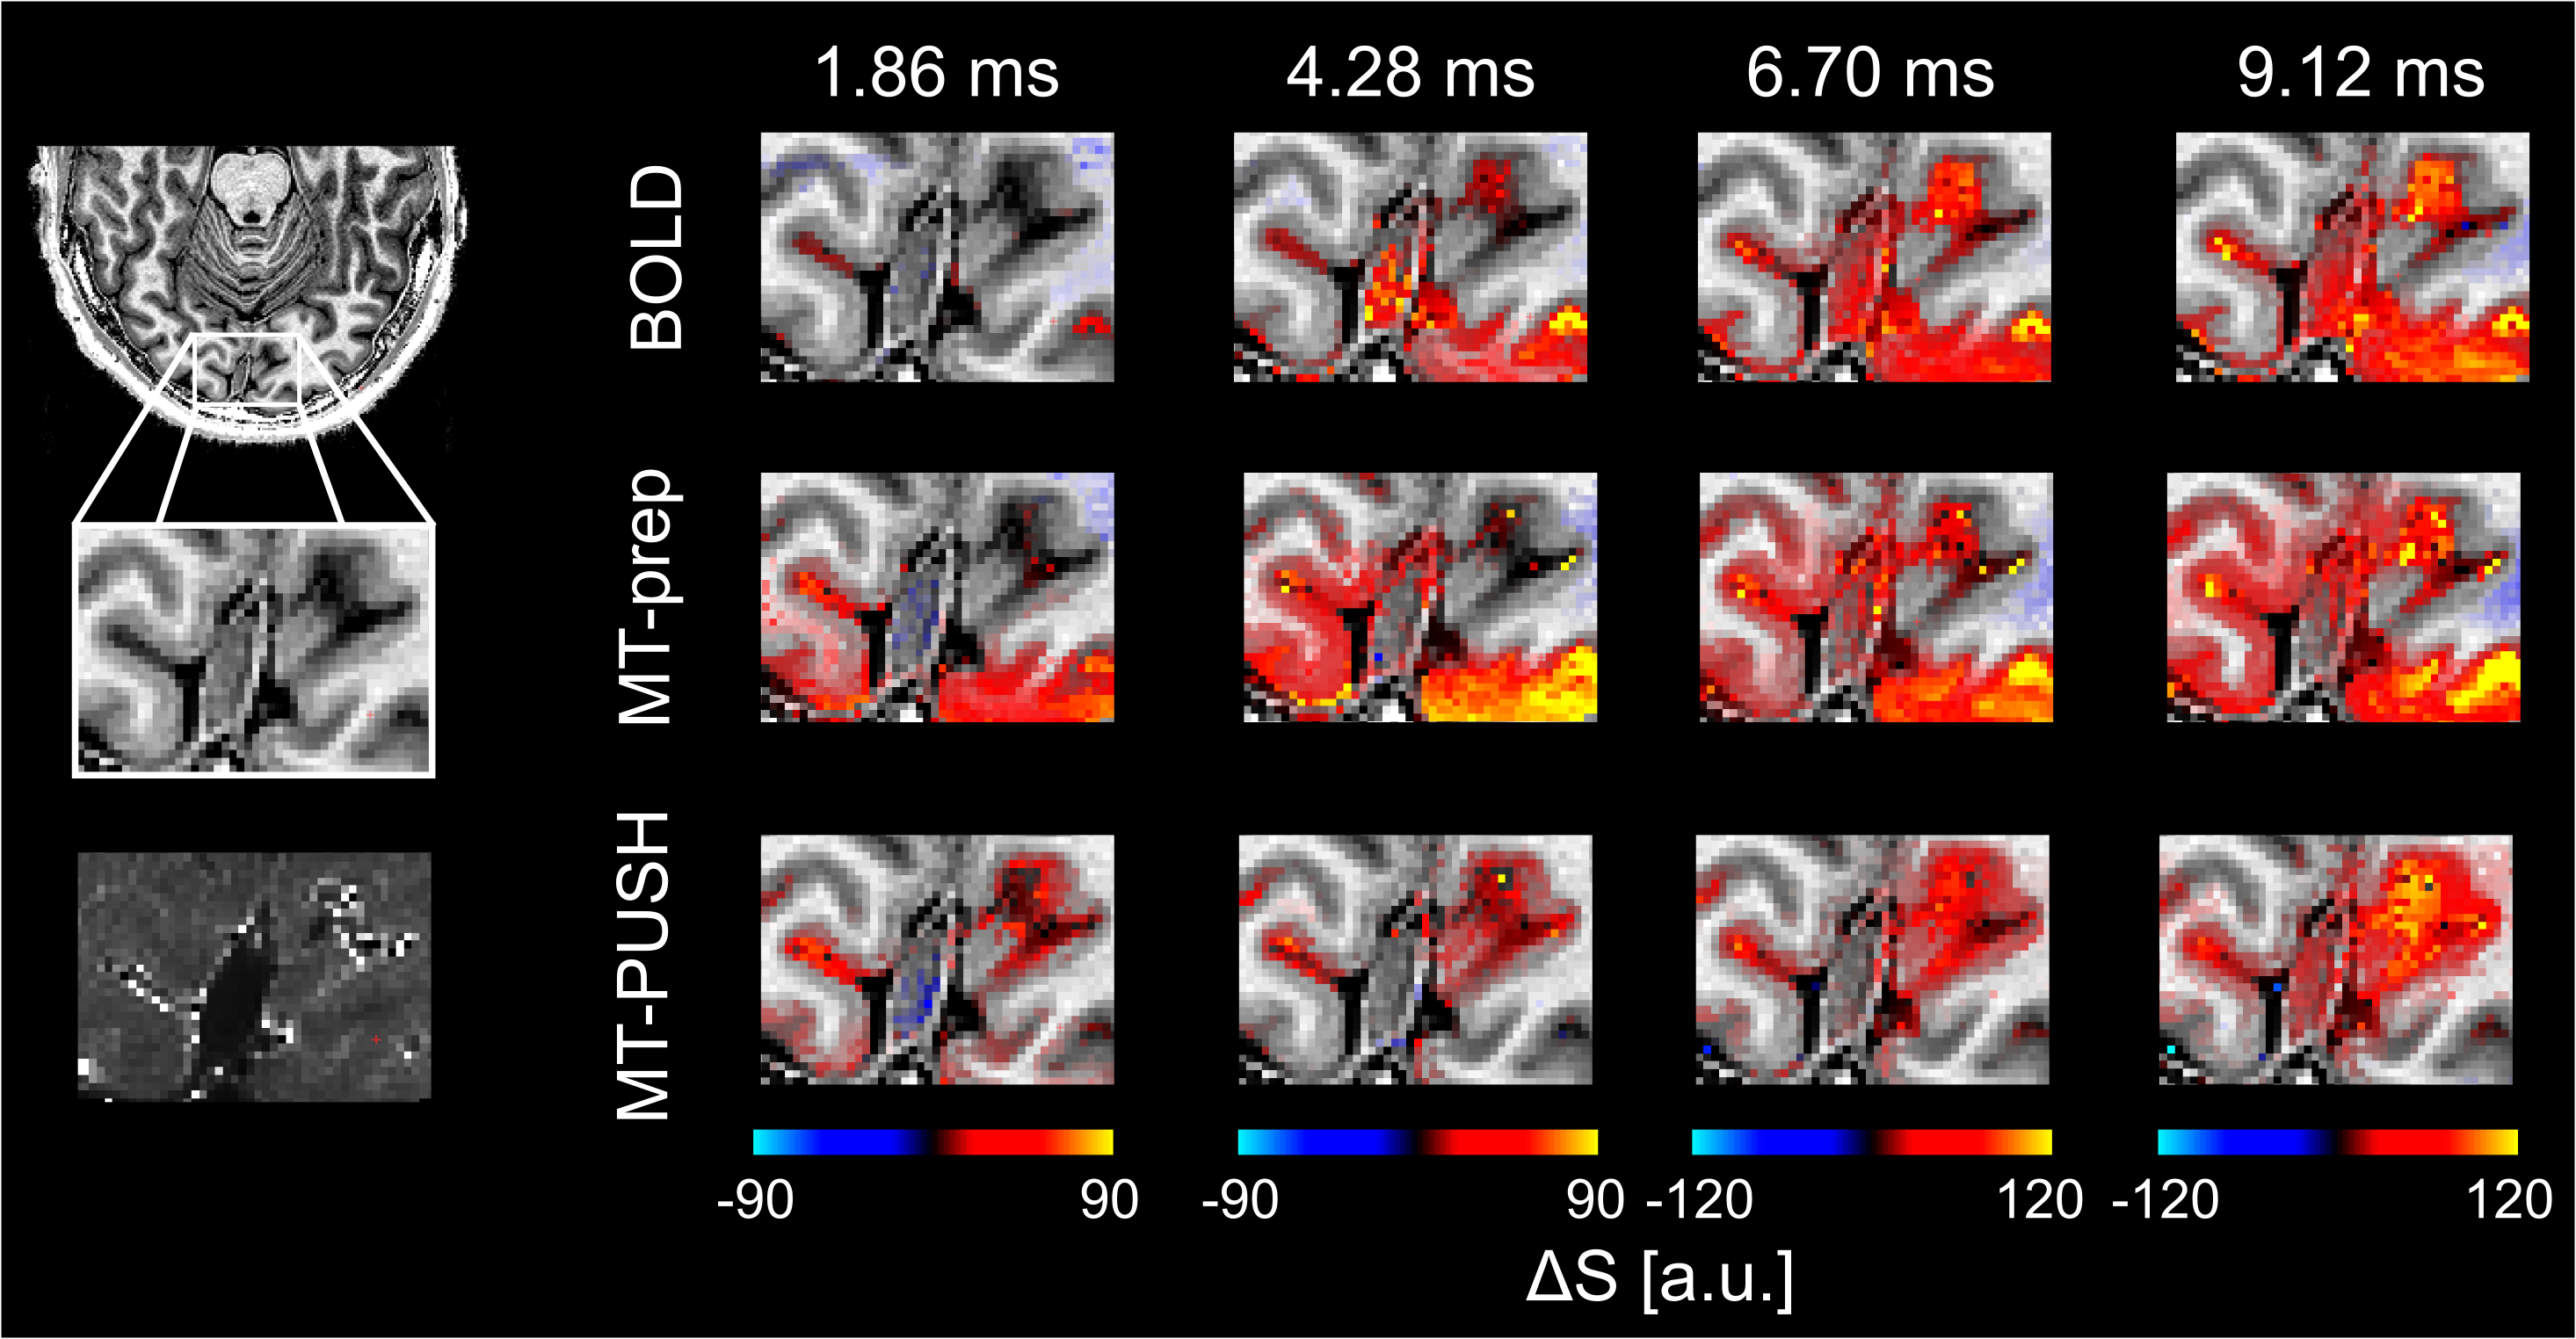
Maps of functional signal change with anatomical informed smoothing for all measured echoes. A T2* map is shown in the bottom left highlighting areas around large veins. Both MT-prep and MT-PUSH exhibit a higher ΔS for the 1st measured echo in GM. At longer TE, the BOLD response comes primarily from areas in and around large veins while both MT-prep and MT-PUSH are less biased toward those veins.
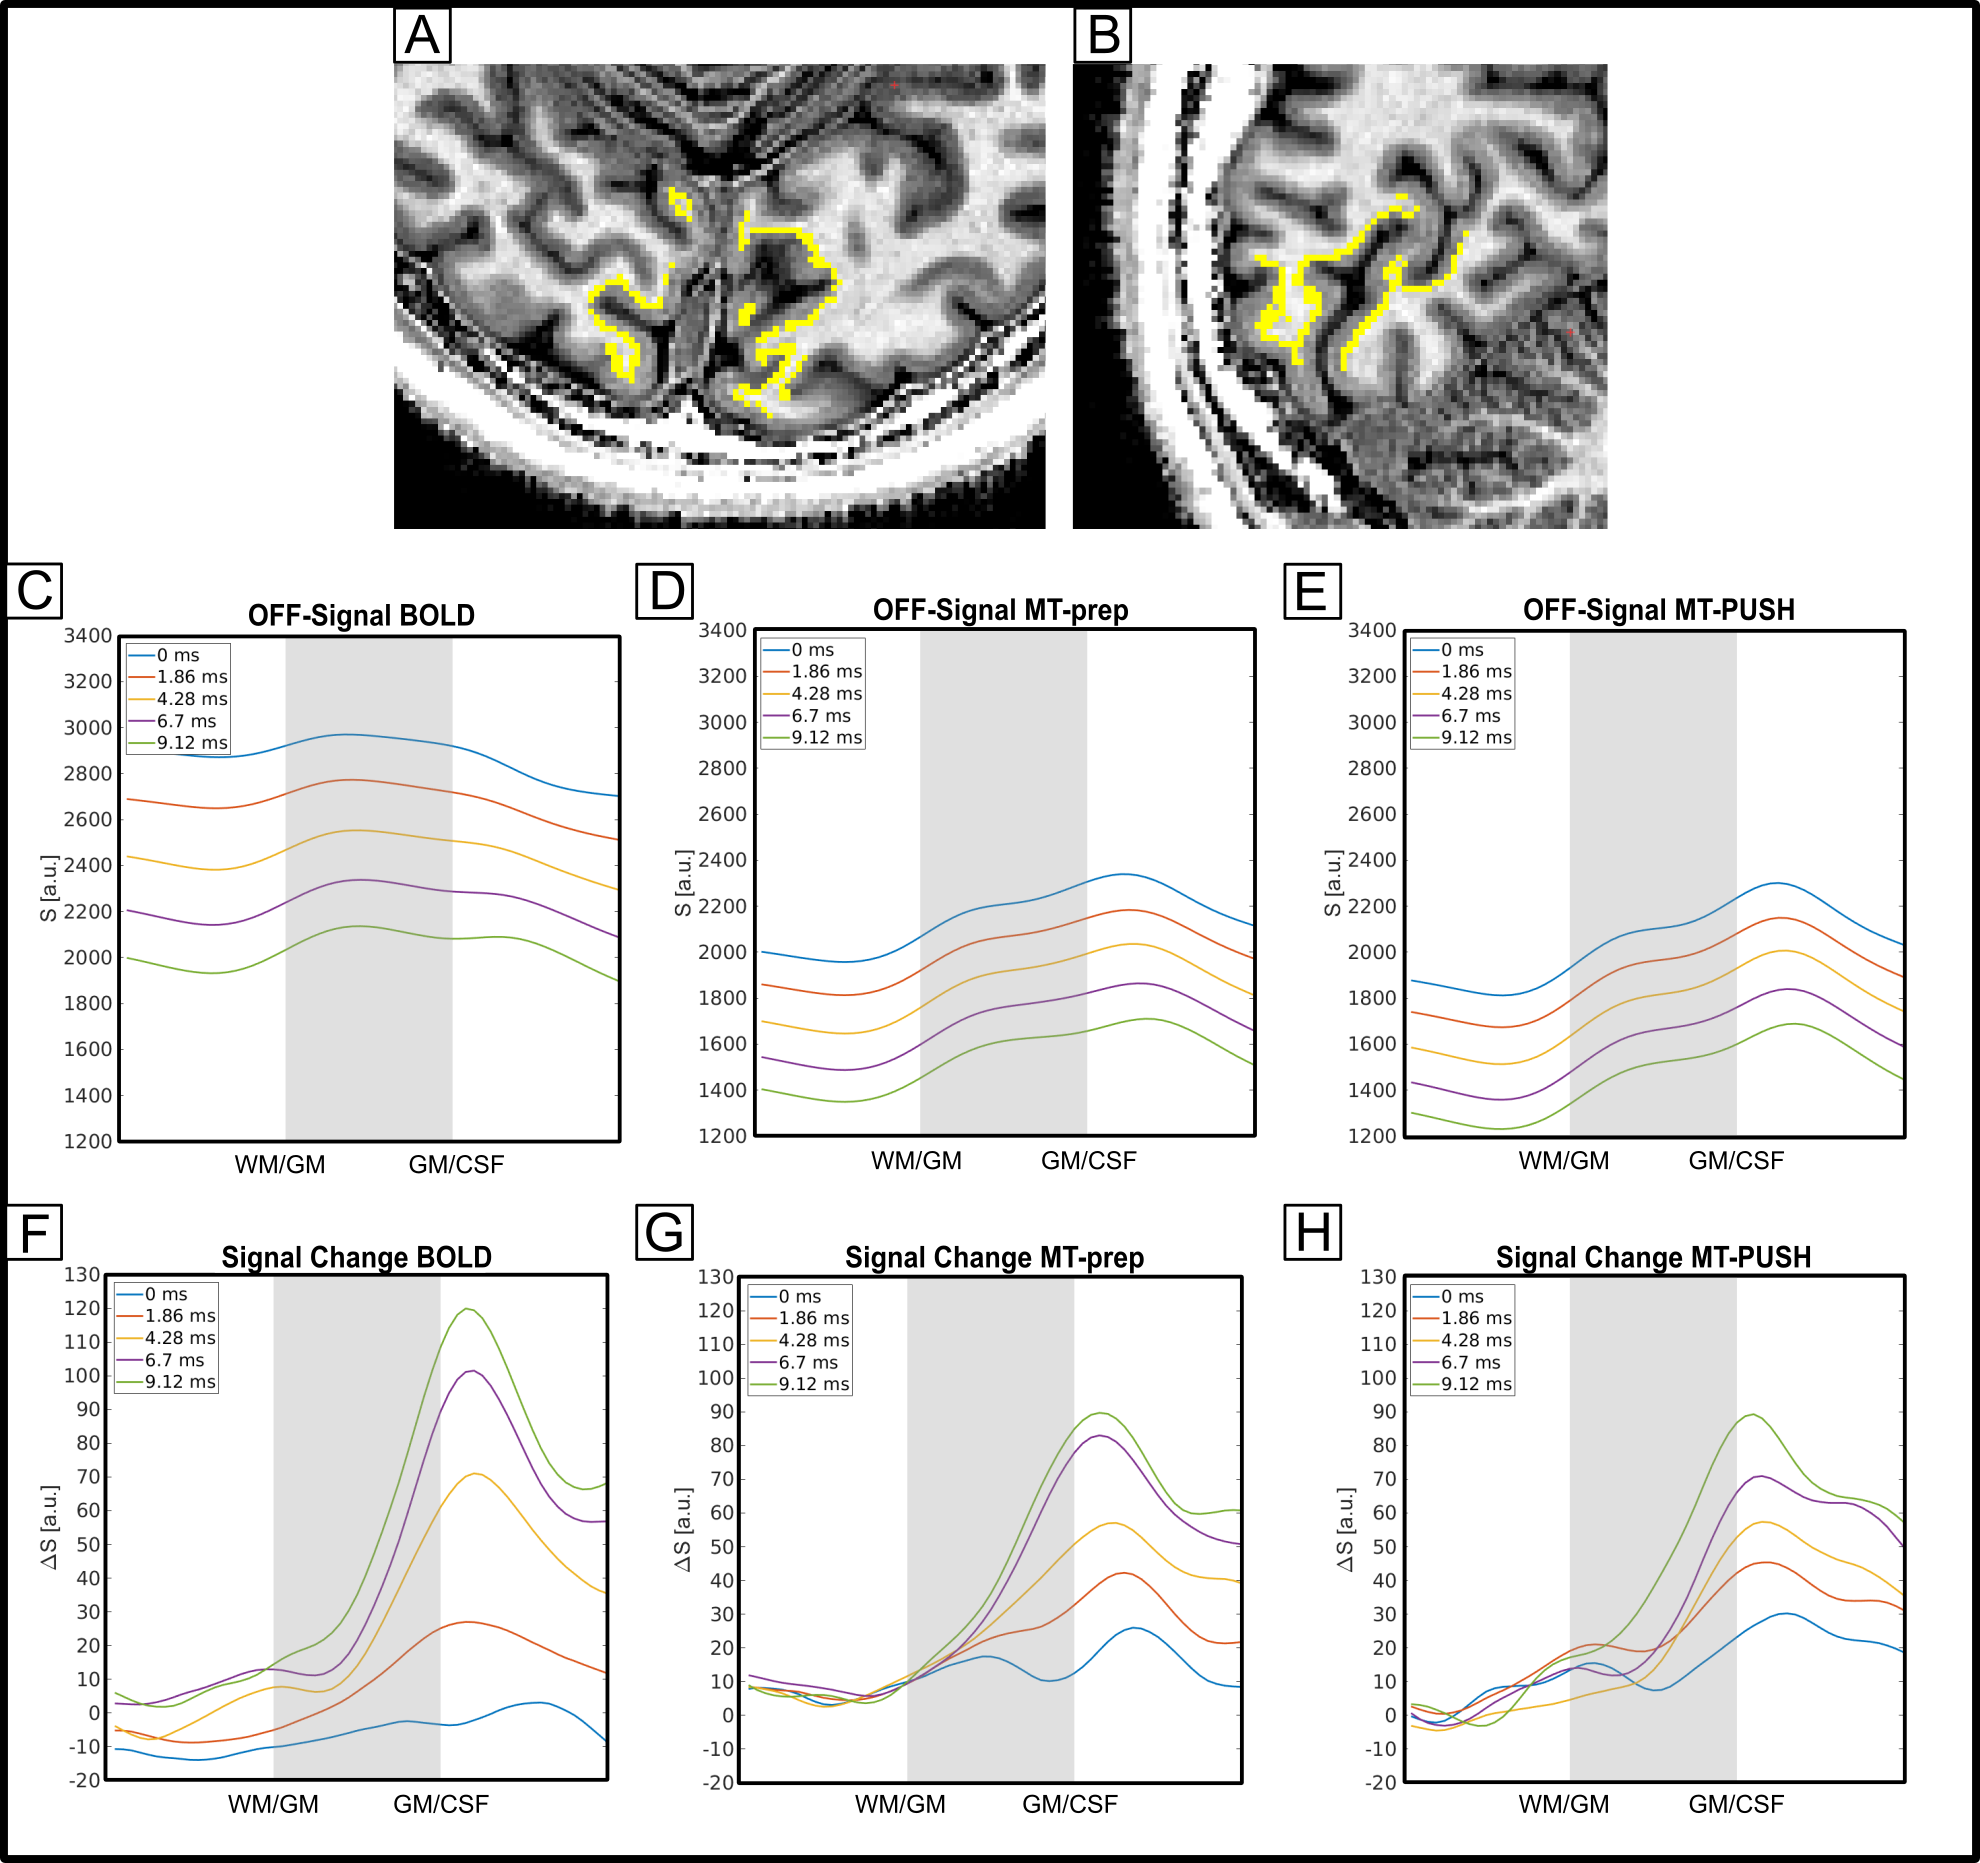
(A) Axial and (B) sagittal view of the ROI used for layer sampling. (C-E) Profiles during rest showing the amount of signal suppression brought by MT. The signal change profiles for MT-prep (G) and PUSH (H) show a less strong TE dependency compared to BOLD (F) indicating less EV effects with MT. Signal change at 0 ms TE and at the 1st measured TE are higher and more confined to GM for MT-prep and MT-PUSH compared to BOLD. The overall difference between MT-prep and MT-PUSH is comparably small.
DOI: https://doi.org/10.58530/2023/3674