3672
Direct imaging of Neuronal Activity (DIANA) in Humans
Shota Hodono1, Reuben Rideaux2, Timo van Kerkoerle3, and Martijn A. Cloos1
1Centre for Advanced Imaging, University of Queensland, St Lucia, Australia, 2Queensland Brain Institute, University of Queensland, St Lucia, Australia, 3NeuroSpin, The French Alternative Energies and Atomic Energy Commission (CEA), Gif-Sur-Yvette, France
1Centre for Advanced Imaging, University of Queensland, St Lucia, Australia, 2Queensland Brain Institute, University of Queensland, St Lucia, Australia, 3NeuroSpin, The French Alternative Energies and Atomic Energy Commission (CEA), Gif-Sur-Yvette, France
Synopsis
Keywords: fMRI, Contrast Mechanisms, DIANA
Here we describe our initial results attempting to observe neuronal activation in humans using the Direct Imaging of Neuronal Activity (DIANA) method. Both visual and auditory paradigms were explored. BOLD and anatomical ROI were tested and dedicated single slice control experiments were performed, but clear DIANA signals remained elusive. The translation of DIANA from animals to humans appears to be non-trivial. Nevertheless, considering the potential payoff continued effort towards this goal may be well worth it. To aid in this quest, parallel studies focused on DIANA’s ability to detect spiking and hyperpolarisation in controlled settings may be of great value.Introduction
DIANA is a method that aims to directly image neuronal activity using MRI1. It was first demonstrated in anesthetised mice. However, many neuroscientific questions are specific to the human brain. Here we describe our initial results attempting to observe neuronal activation in humans using DIANA.Methods
To create the DIANA sequence (Fig.1a), the measurement repetition loop was moved inside the phase loop of a spoiled GRE sequence (TR=5ms, TE=2.4ms, flip-angle=4°,2x2x5mm)2. Bloch simulations were performed to estimate the number of dummy pulses needed to reach the steady state (Fig.1b). Our objective was to observe clear and reproducible neuronal signals. Considering that Toi et al reported ~0.1% signal change1, we decided to avoid parallel imaging strategies that could introduce subtle artifacts and focus our attention on a single slice to maximize our sensitivity through averaging.The DIANA imaging slice was identified based on a Blood Oxygen Level Dependent (BOLD)3 based GRE-EPI functional localiser (9 slices, TR=1s, TE=20ms, FA=60°, 2x2x5mm, 360 volumes). A visual paradigm was used (3s on 9s off, Fig.2a) and quickly analysed using the Fourier-transform to identify voxels that match the expected spectral function based on the canonical hemodynamic response function4.
The target slice was then imaged again using a single slice GRE sequence (TR=25ms, TE=20ms, FA=10°, 2x2x5mm, 360 repetitions) to obtain a BOLD based map of functional activation without geometric distortion (Fig.2b). These maps were used to identify regions of interest (ROI) where a DIANA signal may be observed.
We also collected a T1 weighted image of the target slice using a 2D adaptation of the MP2RAGE sequence5. These images were used to draw ROI using ITK-SNAP6.
Each trial in the DIANA paradigm consisted of a 100ms visual stimulus with a 600ms interstimulus interval (ISI) (Fig.2c). Visual stimuli were pseudo-randomly configured noise patterns that changed configuration on each trial. During ISIs, a black screen was shown, to minimize visual stimulation, e.g., caused by blinking. In total, 33 measurements of 140 time-points were collected (3168 trials). Each voxel in every measurement was first converted to a percent signal change, then detrended (linear), and smoothed with gaussian kernel (width=3). Trials were then averaged across ROI. All DIANA data were reconstructed offline with 16bit dynamic range (Matlab, MathWorks, USA).
All experiments were performed at 7 Tesla (Siemens Magnetom, Germany) using a 32-channel head coil (Nova Medical, USA). The study was approved by the local human research ethics committee in accordance with national guidelines. After providing written informed consent, 3 volunteers were scanned
Results & Discussion
Using our functional localiser, each volunteer showed clear BOLD signal changes across the visual cortex (Fig.3 top-row). In all cases, the target slice also showed clear activation in our distortion free 2D GRE data (Fig.3 middle-row).Averaged across the BOLD ROI, trial averaged DIANA data showed no signs of activation (Fig. 4. Red). In some cases, the cortical signal was even more stable than the white matter control ROI (Fig. 4. Green).
Given the relatively low spatial resolution (2x2x5mm), one might expect reasonable voxel-wise coincidence between BOLD and DIANA signals, even though the GRE BOLD signal is weighted towards the drainage veins at the surface7,8. Nevertheless, comparing BOLD activation with T1 weighted anatomical images (Fig.3), BOLD’s bias towards areas in-between or on top of cortical surfaces is visible. Still, hand drawn ROI, following key grey matter areas, showed no functional activity (Fig. 4. Blue).
With our current understanding, translation of DIANA from mice to humans is challenging. In mice positive DIANA signals correlate with spiking density, and negative signal changes correlated with hyperpolarisation. Could it be that spiking in L4 combined with hyperpolarisation in L2/3 could cancel each other out in terms of DIANA signal? If so, higher resolution data would be needed at the cost of SNR. A study focused on the detectability of spiking and hyperpolarisation in a controlled setting could help make better informed study design choices in humans.
In addition, need for short stimuli and ISI also complicate human experiments. At these frequencies checkerboard and noise-like stimuli can be intense, bordering at uncomfortable, tempting volunteers to blink in anticipation. Blinking could be detected using an eye tracker, but data scrubbing is difficult because DIANA inherently averages trials during image reconstruction. Alternatively, it may be possible to design paradigms using tailored naturalistic stimuli that are more engaging and comfortable to observe.
We also tried auditory stimuli which where more comfortable for the subject and could benefit from the high temporal specificity of the auditory system. Nevertheless, also in this case DIANA failed to show reliable neural signal (data not shown). However, this time the BOLD response was also much weaker, presumably due to the noise produced by the scanner itself, which may be even more problematic when using short ISIs.
Conclusion
The translation of DIANA from animals to humans appears to be non-trivial. Nevertheless, considering the potential payoff continued effort towards this goal may be well worth it. To aid in this quest, parallel studies focused on DIANA’s ability to detect spiking and hyperpolarisation in controlled settings may be of great value.Acknowledgements
This work was supported by Australian Research Council (ARC) Future fellowship grant FT200100329 and ARC Discovery Early Career Researcher Award (DE210100790). In addition, the authors acknowledge the facilities of the National Imaging Facility at the Centre for Advanced Imaging.References
- Toi, P.T., et al., In vivo direct imaging of neuronal activity at high temporospatial resolution. Science, 2022. 378(6616): p. 160-168.
- Silva, Afonso C., and Alan P. Koretsky. "Laminar specificity of functional MRI onset times during somatosensory stimulation in rat." Proceedings of the National Academy of Sciences, 2002. 99(23) 15182-15187.
- Ogawa S, Lee TM, Kay AR, Tank DW. Brain magnetic resonance imaging with contrast dependent on blood oxygenation. proceedings of the National Academy of Sciences. 1990 Dec;87(24):9868-72.
- Friston KJ, Jezzard P, Turner R. Analysis of functional MRI time‐series. Human brain mapping. 1994;1(2):153-71.
- Marques JP, Kober T, Krueger G, van der Zwaag W, Van de Moortele PF, Gruetter R. MP2RAGE, a self bias-field corrected sequence for improved segmentation and T1-mapping at high field. Neuroimage. 2010 Jan 15;49(2):1271-81.
- Yushkevich, P.A., et al., User-guided 3D active contour segmentation of anatomical structures: significantly improved efficiency and reliability. Neuroimage, 2006. 31(3): p. 1116-28.
- Goense JB, Logothetis NK. Laminar specificity in monkey V1 using high-resolution SE-fMRI. Magnetic resonance imaging. 2006 May 1;24(4):381-92.
- Polimeni JR, Fischl B, Greve DN, Wald LL. Laminar analysis of 7 T BOLD using an imposed spatial activation pattern in human V1. Neuroimage. 2010 Oct 1;52(4):1334-46.
Figures
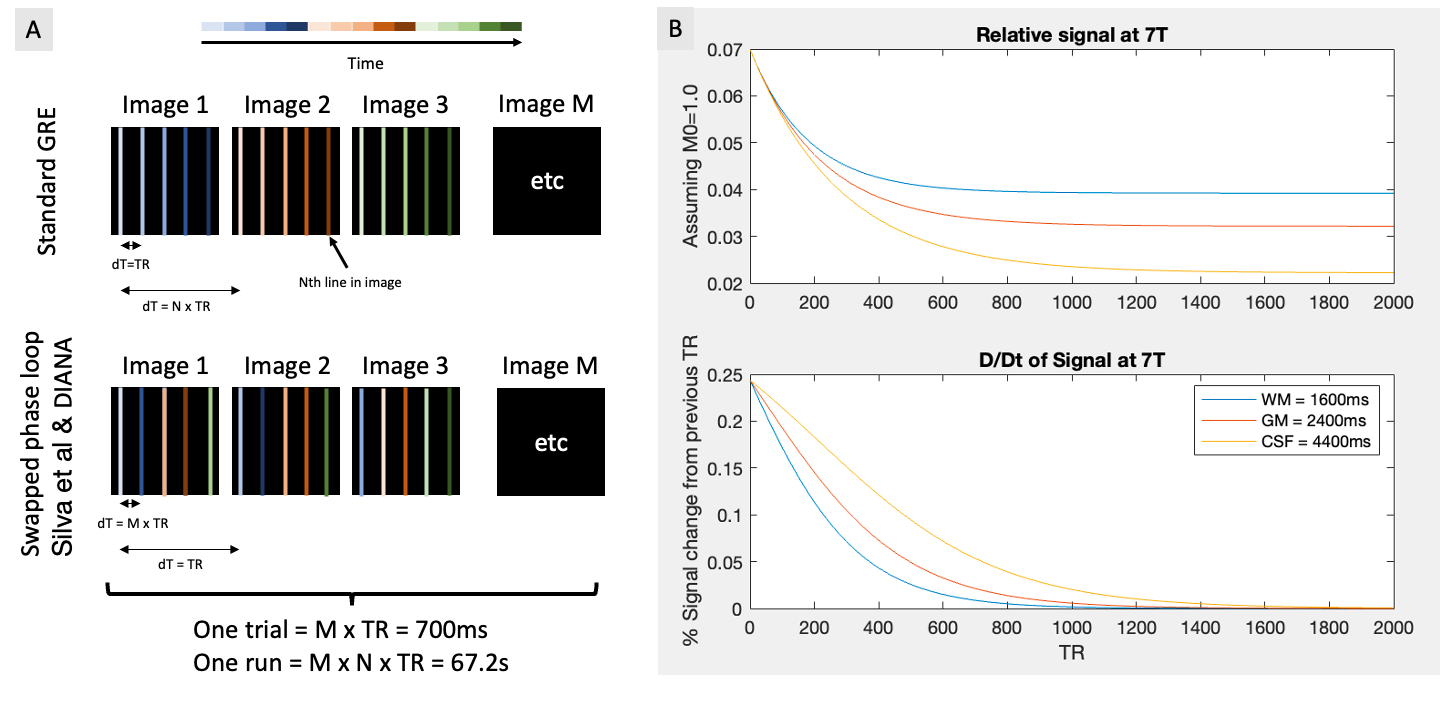
A) Illustration showing the acquisition order in a standard 2D-GRE and the phase loop swapped acquisition used by Toi et al. B) Bloch simulations showing the signal as it transitions towards to the steady-state. Because the flip-angle is very small and the TR is short, it can take well over a 1000 TR for the signal to stabilise.
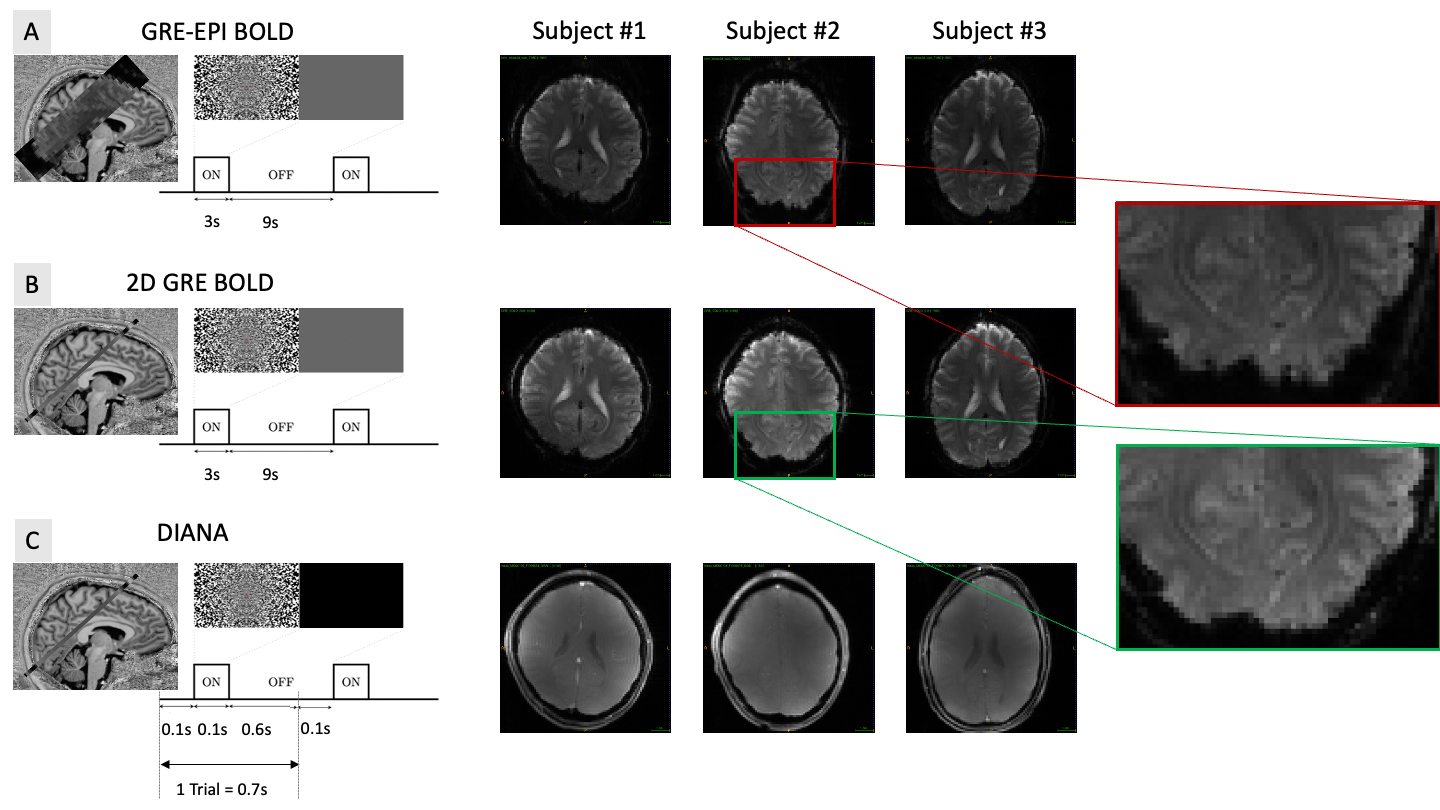
Paradigms and exemplary functional images. A) Multi-slice gradient echo EPI experiment (9 slices TR=1s TE=20ms). B) Slice gradient echo experiment (1 slice TR=25ms, TE=20ms). No EPI was used to minimise geometrical distortion. C) Single slice DIANA experiment (TR=5ms, TE=2.4ms). Each trial 140 time points were collect before moving to the next trial. Zoomed in section on the right show the geometric differences between due to the EPI readout.
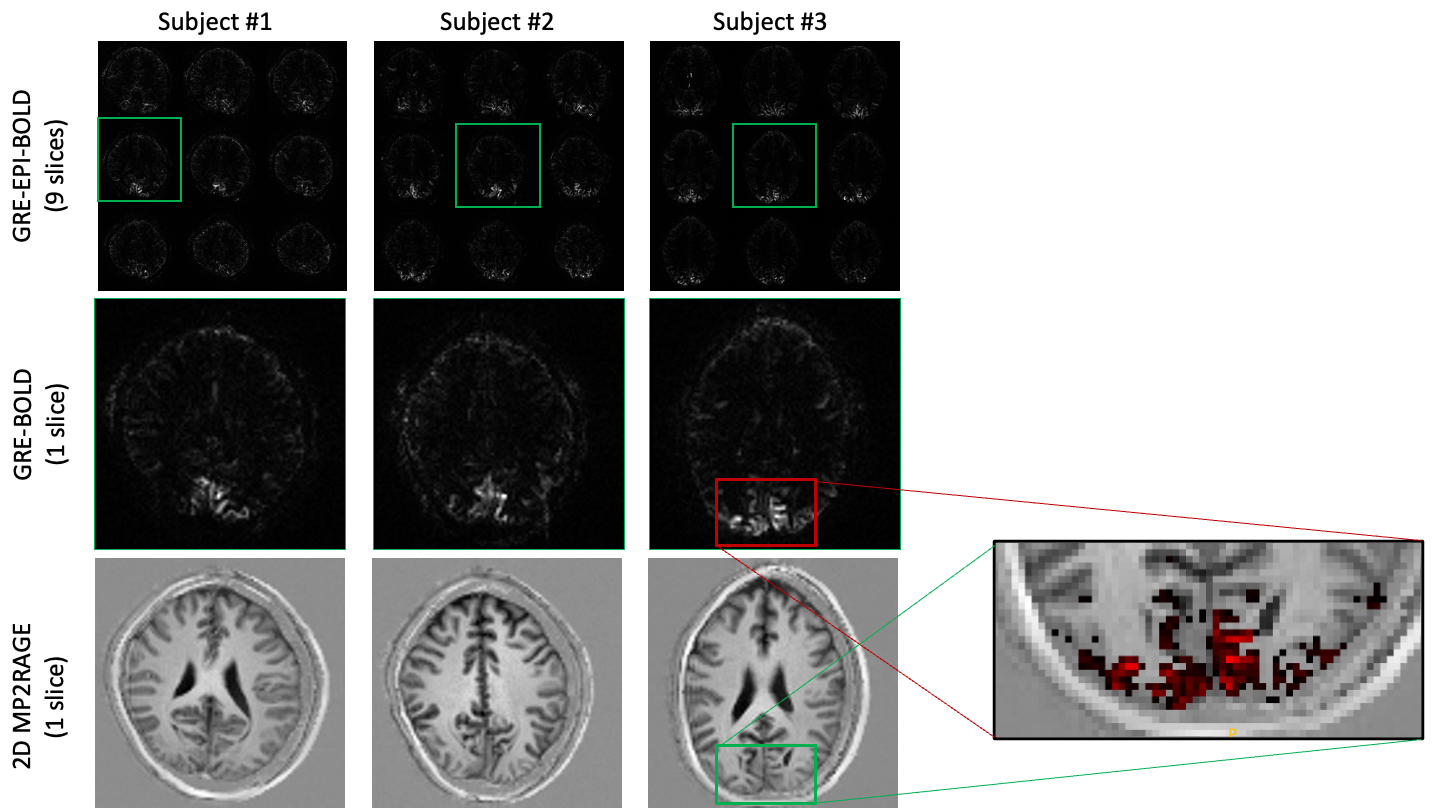
BOLD activation maps obtained with our EPI based functional localiser (Top row). BOLD activation maps obtained without EPI, using a single slice gradient echo sequence (middle row). Slice matched MP2RAGe based anatomical images obtained with a modified 2D implementation to match the exact slice without re-formatting or re-alignment. The zoomed in insert on the right shows the BOLD activation onto of the T1 anatomical.
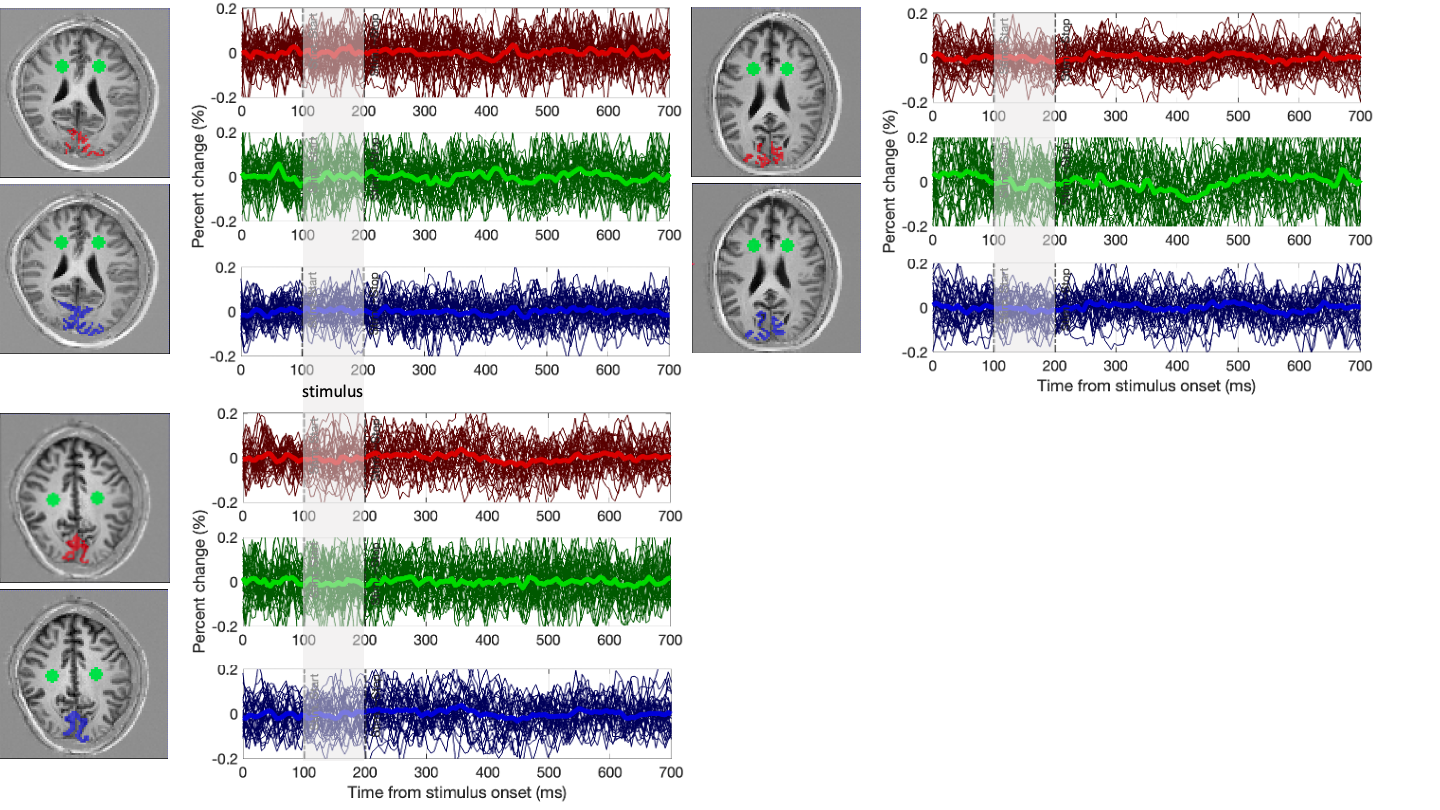
Trial averaged DIANA signals observed in different ROI. The stimulus window is highlighted in grey. Red are the BOLD based ROI. Green is a white mater control ROI. Blue is a hand drawn ROI outlining the expected area of activation (V1) based on anatomical data. Dark lines show individual runs, each run contains all voxels and 96 trials. The bright lines contain all data. Note that temporal variation of the signals observed after averaging all data are smaller than the expected 0.1% signal change.
DOI: https://doi.org/10.58530/2023/3672