3671
Entrainment between musical stimuli and cortical depth-dependent fMRI signals1Physical Sciences Platform, Sunnybrook Research institute, Toronto, ON, Canada, 2Department of Medical Biophysics, University of Toronto, Toronto, ON, Canada, 3Center for Neuroscience Imaging Research, Institute for Basic Science, Suwon, Korea, Republic of, 4Techna Institute & Koerner Scientist in MR Imaging, University Health Network, Toronto, ON, Canada
Synopsis
Keywords: fMRI (task based), fMRI (task based)
We use cortical-depth dependent fMRI to study the correlation between neural oscillations and fMRI signals across cortical depths in the auditory cortex during music listening. The correlation between fMRI signals and acoustic stimuli was the strongest at the primary auditory cortex in the intermediate cortical depths during the first listening, matching the hypothesis of feedforward signal supported by the connectivity. The correlation was suppressed in the repeated listening, superficial as well as deep depths, and at the secondary auditory cortex.Introduction
Brain oscillations are linked to auditory perception in different frequency ranges between theta (4-8 Hz) and beta (15- 30 Hz) bands 1–3. Under musical stimuli, both low (<8 Hz) and high (15–30 Hz) frequency oscillations are related to behavioral performance in musical listening 4. However, whether the oscillatory neuronal activities entrained by the musical stimuli are due to the bottom-up 5 or top-down 6 processes remains elusive.Here we use cortical-depth dependent fMRI 7–9 to study the correlation between neural oscillations and fMRI signals across cortical depths in the auditory cortex during music listening. With preferential anatomical feed-forward connections to the intermediate cortical depth in the primary sensory region 10,11, strong fMRI signal entrainment at the intermediate cortical depths can be attributed to the feed-forward mechanism. This entrainment is likely different between the primary and secondary auditory cortices and between the first and repeated listening.
Methods
All participants joined this study with written informed consent after the approval of the Institute Review Board. Functional MRI data were acquired on a 7T (Terra, Siemens) with a 32-channel whole-head coil array. Structural and functional images from six healthy participants were acquired with MP2RAGE and a 0.8-mm isotropic resolution EPI. Nine cortical surfaces with equally spaced cortical thickness were reconstructed from the structural images using FreeSurfer 12,13. The auditory stimulus included three songs (Song 1: “Doraemon” theme song, Song 2: “Brahms Piano Concerto No. 1”, and Song 3: “Lost Stars” by Adam Levine). Each participant listened to each song twice in a randomized order.Envelopes of the acoustic stimuli were extracted by Hilbert transformation (envelope function in Matlab 2021, Mathworks, Natick MA, USA). Cortical-depth dependent fMRI signals were first processed by suppressing the geometrical distortion (topup function in FSL). Then fMRI signals were registered to the reconstructed brain surfaces (bbregister function in FreeSurfer). Finally, fMRI signals were interpolated into ten equal-distance cortical depths. A General Linear Model (GLM) was used to correlate the music envelope and cortical depth-dependent fMRI data. Convolution between the music envelope and canonical hemodynamic response function was performed before GLM. We analyzed the correlation at the auditory cortex, which was further separated into primary (core) and secondary (non-core) regions of the auditory cortex 14.
Results
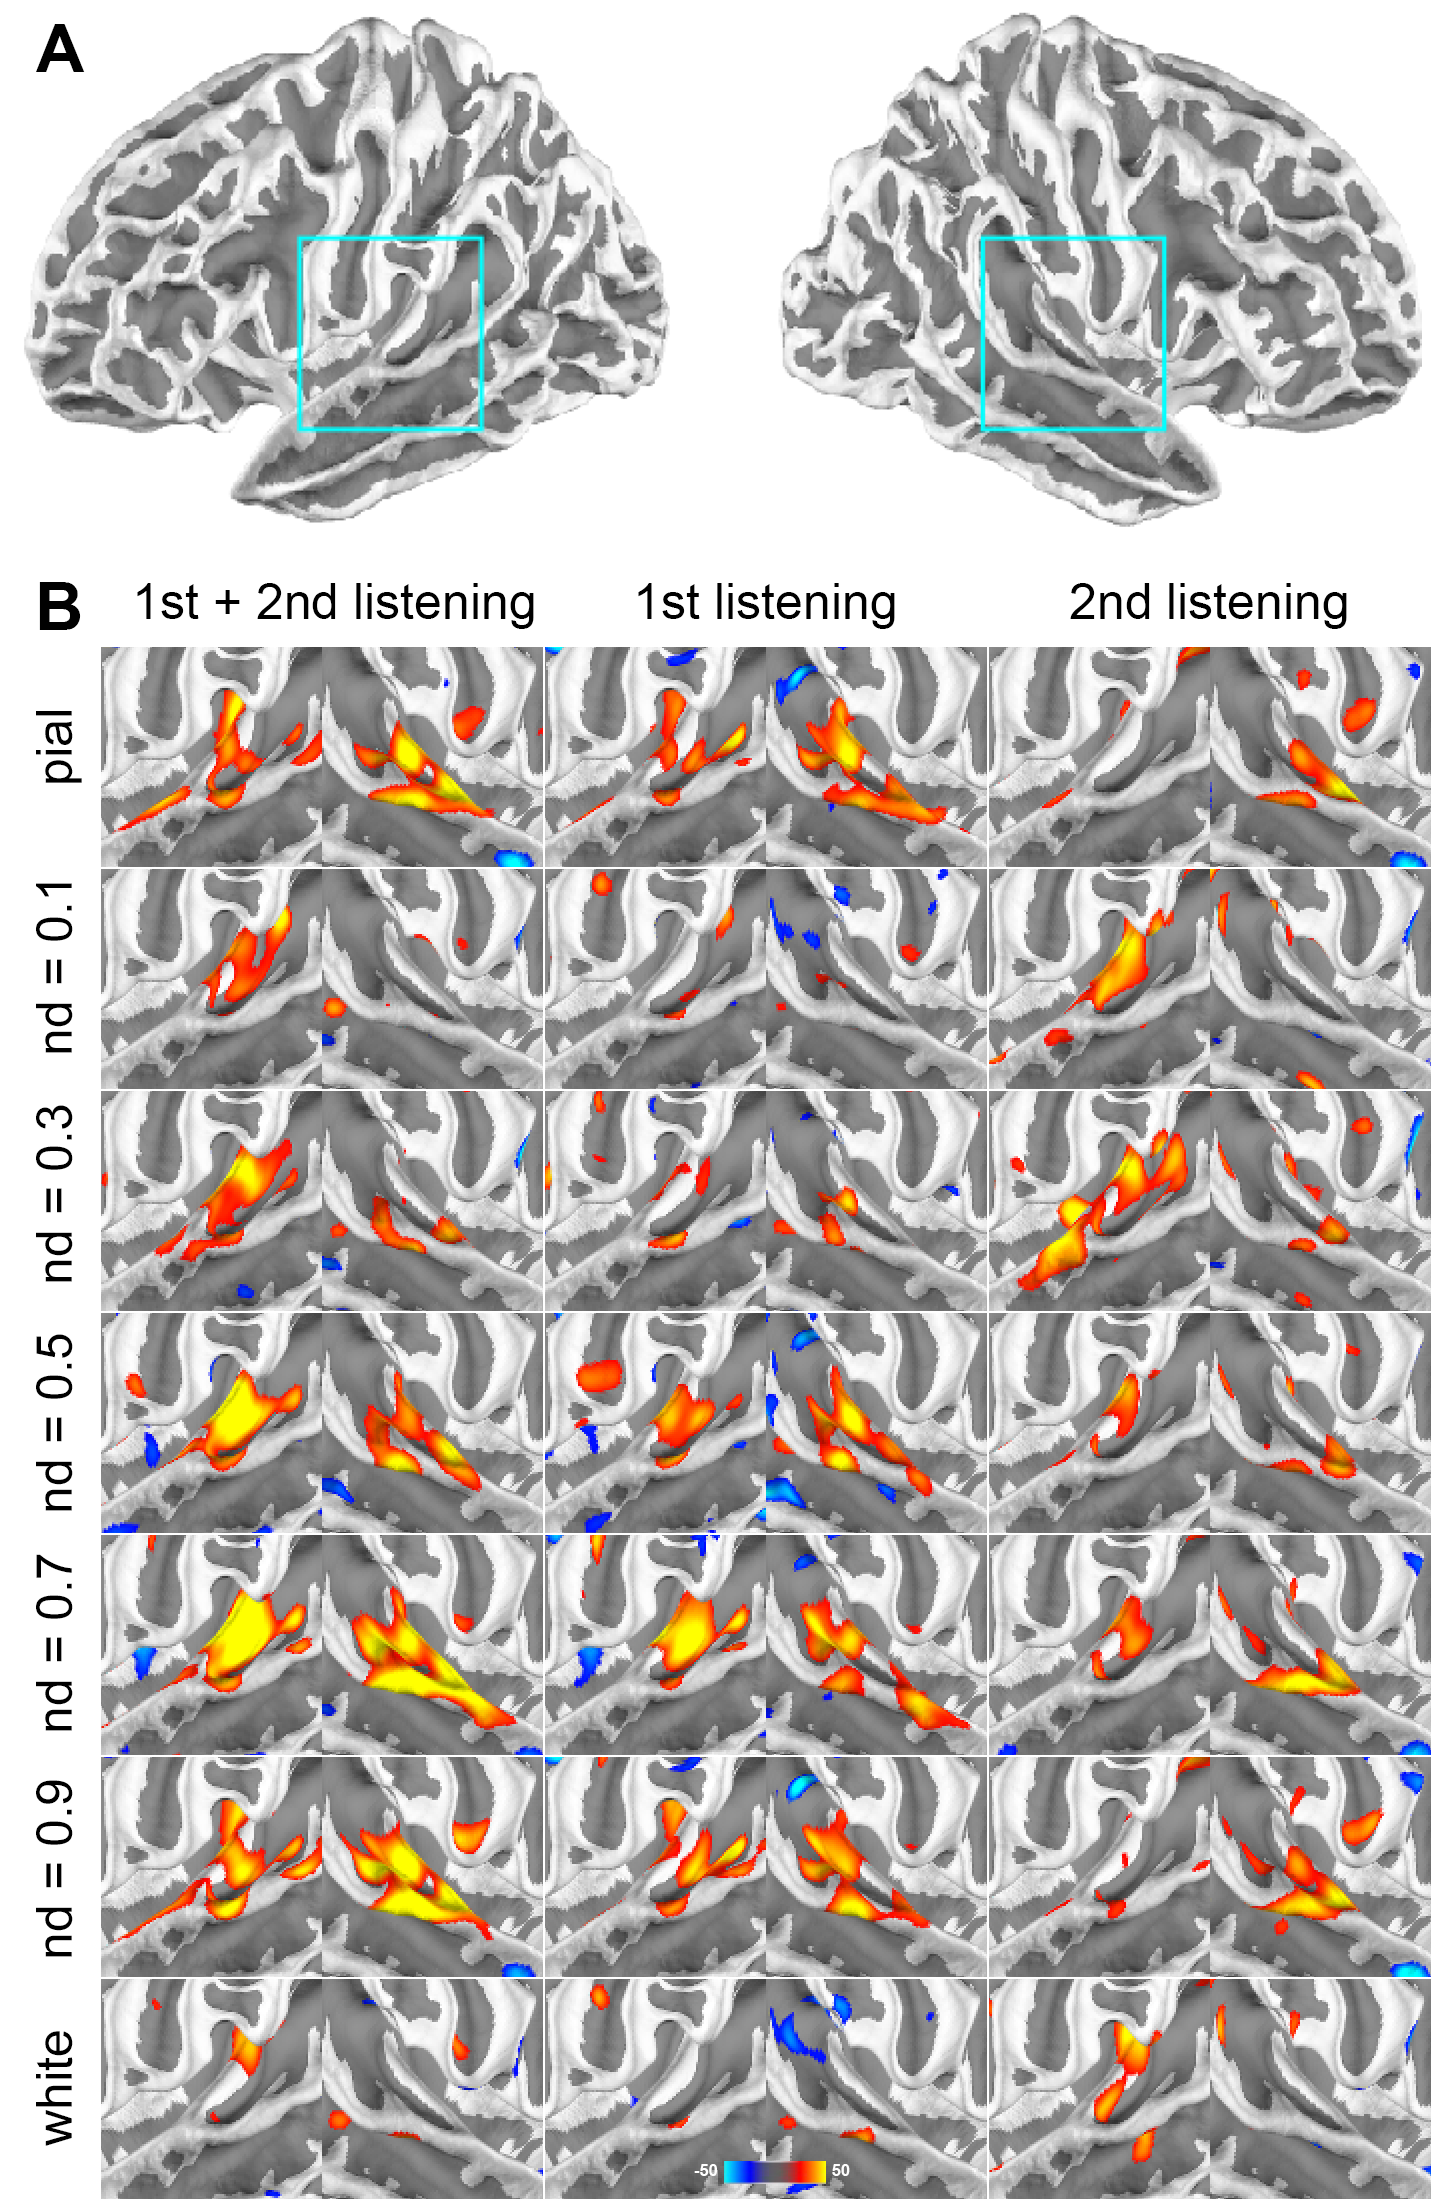
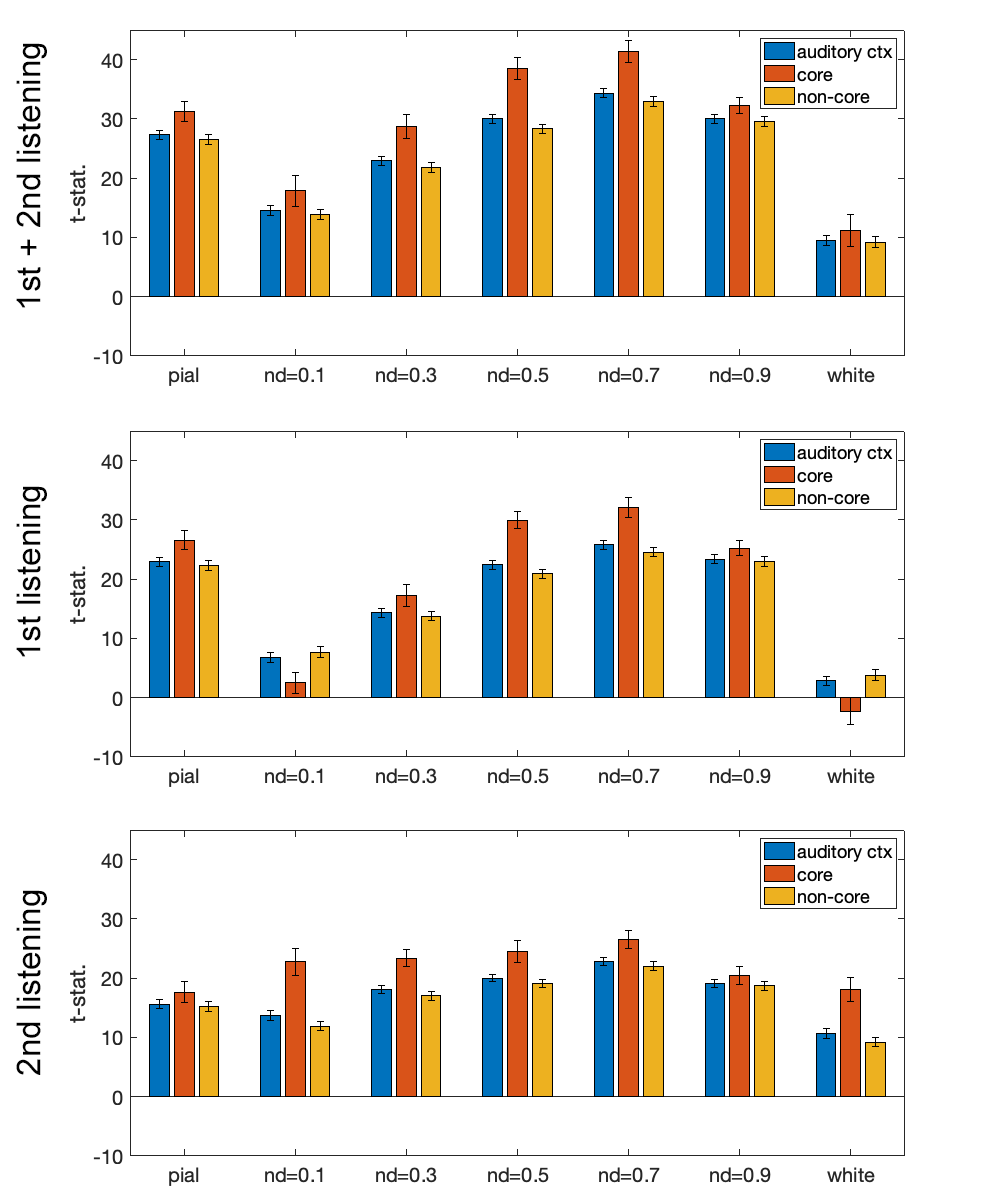
Figure 1 shows the distributions of statistical significance of correlated fMRI signals across cortical depths in the left and right auditory cortices. Most significant fMRI signals were found at the pial surface and at 0.5 and 0.9 normalized depths (nd). From the 1st to the 2nd listening, the significant fMRI signals shifted toward superficial depths (nd=0.1 and 0.3) and deep (white) surfaces.Averages and standard errors of means of the fMRI signal correlated with musical stimuli across cortical depths are shown in Figure 2, where values at the auditory cortex, primary auditory cortex (core), and secondary auditory cortex (non-core) are shown separately. Values across cortical depths were statistically significant (p<0.001; Bonferroni correction for multiple comparisons), except between nd=0.5 and nd = 0.9. The strongest significance was found at the primary auditory cortex in the first listening between nd=0.5 and nd=0.9.
Discussion
We explored the cortical-depth dependent fMRI signals entrained by the presented musical stimuli. This correlation was most substantial at the primary auditory cortex in the intermediate cortical depths during the first listening, matching the hypothesis of feedforward signal supported by the connectivity. The correlation was suppressed in the repeated listening, superficial as well as deep depths, and at the secondary auditory cortex, likely due to the feedback modulations from other cortical areas, reflecting the top-down feedback pathway targeting the infragranular and supragranular layers 10,11. Our results also showed asymmetric responses between hemispheres (Figure 1).We previously reported that hemodynamic responses in the human auditory cortex were significantly negatively and positively correlated with neuronal oscillation in the alpha/beta band and gamma band, respectively 15. Oscillatory neuronal activities are likely attributed to the observed fMRI signals entrained by the musical stimuli.
Acknowledgements
This work was supported by Natural Sciences and Engineering Research Council of Canada (NSERC; RGPIN-2020-05927), Canada Foundation for Innovation (38913 and 41351), Canadian Institutes of Health Research (PJT 178345), MITACS (IT25405 and Global link fellowship).References
1 Schroeder, C. E. et al. Trends Neurosci. 32, 9–18 (2009)
2 Gross, J. et al. PLoS Biol. 11, e1001752 (2013)
3 Cogan, G. B. et al. J. Neurophysiol. 106, 554–563 (2011)
4 Doelling, K. B. et al. Proc. Natl. Acad. Sci. U. S. A. 112, E6233–42 (2015)
5 Musacchia, G. et al. Proc. Natl. Acad. Sci. U. S. A. 104, 15894–15898 (2007)
6 Peelle, J. E. et al. Cerebral Cortex 23, 1378–1387 (2013)
7 Ress, D. et al. Neuroimage 34, 74–84 (2007)
8 Koopmans, P. J. et al. Hum. Brain Mapp. 31, 1297–1304 (2010)
9 Scheeringa, R. et al. Proc. Natl. Acad. Sci. U. S. A. 113, 6761–6766 (2016)
10 Felleman, D. J. et al. Cereb. Cortex 1, 1–47 (1991)
11 Harris, K. D. et al. Nature 503, 51–58 (2013)
12 Dale, A. M. et al. Neuroimage 9, 179–194 (1999)
13 Fischl, B. et al. Neuroimage 9, 195–207 (1999)
14 Wu, P. Y. et al. Sci. Rep. 8, 13287 (2018)
15 Lee, H.-J. et al. in Proc Intl Soc Magn Reson Med 638
Figures