3668
Characterizing across-trial variation in the hemodynamic responses using ultra-fast fMRI data at 7T1Institute for Biomedical Engineering, ETH Zurich and University of Zurich, Zurich, Switzerland, 2Translational Neuromodeling Unit (TNU), Institute for Biomedical Engineering, University of Zurich and ETH Zurich, Zurich, Switzerland, 3Max Planck Institute for Metabolism Research, Cologne, Germany
Synopsis
Keywords: fMRI (task based), Modelling, Hemdoynamic response, HRF, Activation, BOLD
Characterizing hemodynamic responses with great temporal precision is crucial for the interpretation of fMRI data with respect to the underlying neuronal activity. Recent literature highlights that analyses based on a canonical hemodynamic response function (HRF) may fail to capture relevant aspects of neuronal activity in certain conditions1. Ultra-fast fMRI enables precise temporally precise characterizations of hemodynamic responses and their trial-by-trial variation. Here, we analyzed fMRI timeseries sampled at which allowed us to model hemodynamic responses for individual trials during a visuo-motor task. Trial-by-trial variability of hemodynamic responses are analyzed by principal components analysis (PCA) and related to trial-specific conditions.Introduction
Hemodynamic responses have been studied over more than two decades using both linear2 and nonlinear models3. Common analysis approaches assume that local hemodynamic responses can be modeled as a scaled hemodynamic response function (HRF) where the scaling is a function of the underlying neuronal activation. However, it is well established that the shape of the HRF varies across the human brain4. More importantly, the linearity and time invariance assumptions of the HRF no longer hold under conditions like rapid stimulus presentation.Here, we present an approach to investigating trial-specific changes of hemodynamic responses which does not require an a priori model of the underlying magnitude of neuronal activation. This approach is possible due to the very low volume repetition time (0.2s) of the fMRI data, which results in 5920 fMRI images to analyze, with the hemodynamic response modeled for each trial individually.
Methods
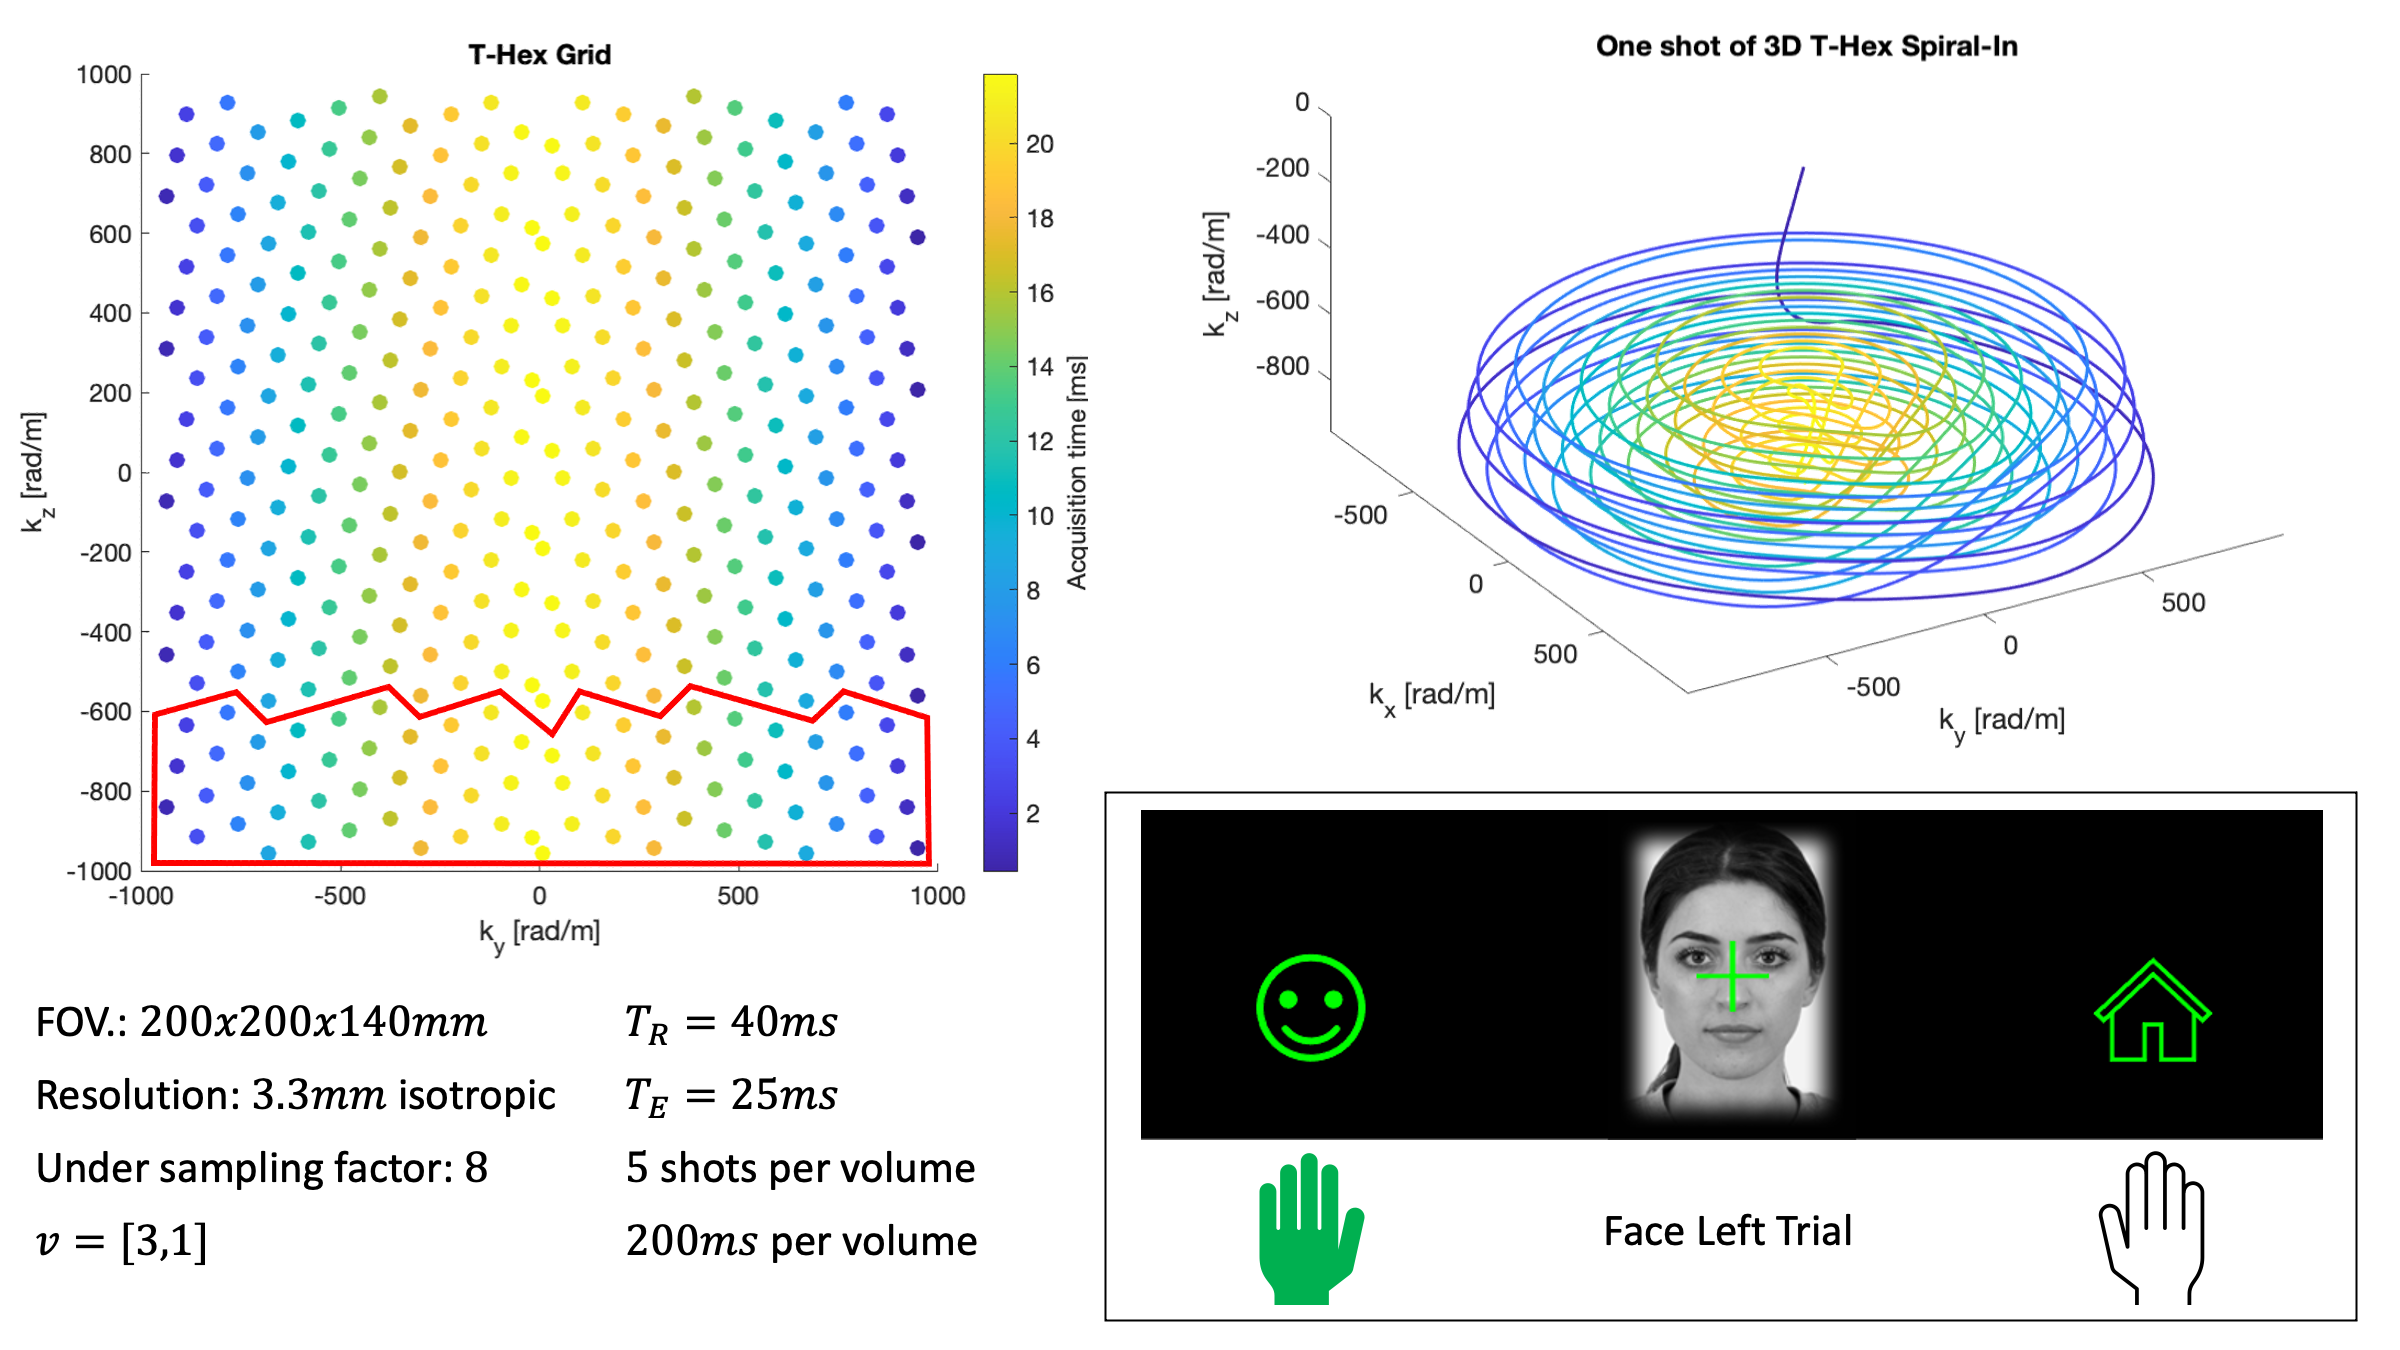
A T-Hex Spiral-In trajectory5 was used to acquire the fMRI data (Figure 1 for details). We used the higher order SENSE reconstruction6, including dynamic field terms up to 3rd order, concurrently measured using 16 19F NMR field probes7.During fMRI, participants had to indicate by left or right hand button presses whether images of faces8 or houses9 were presented centrally (Figure 1). The mapping between hands and choice varied, as indicated by small face or house icons on the left/right sides of the screen. The 96 trials (incl. 16 null trials, total duration 10min) of each of two sessions were fully randomized, and their onsets jittered.
Data were analyzed using SPM12. The functional scans were realigned, coregistered to a structural scan and normalized to MNI space. The first level GLM analysis included event-related regressors for the button press of each trial, convolved with SPM's informed basis set10. Furthermore, confound regressors for physiological noise and motion were included11.
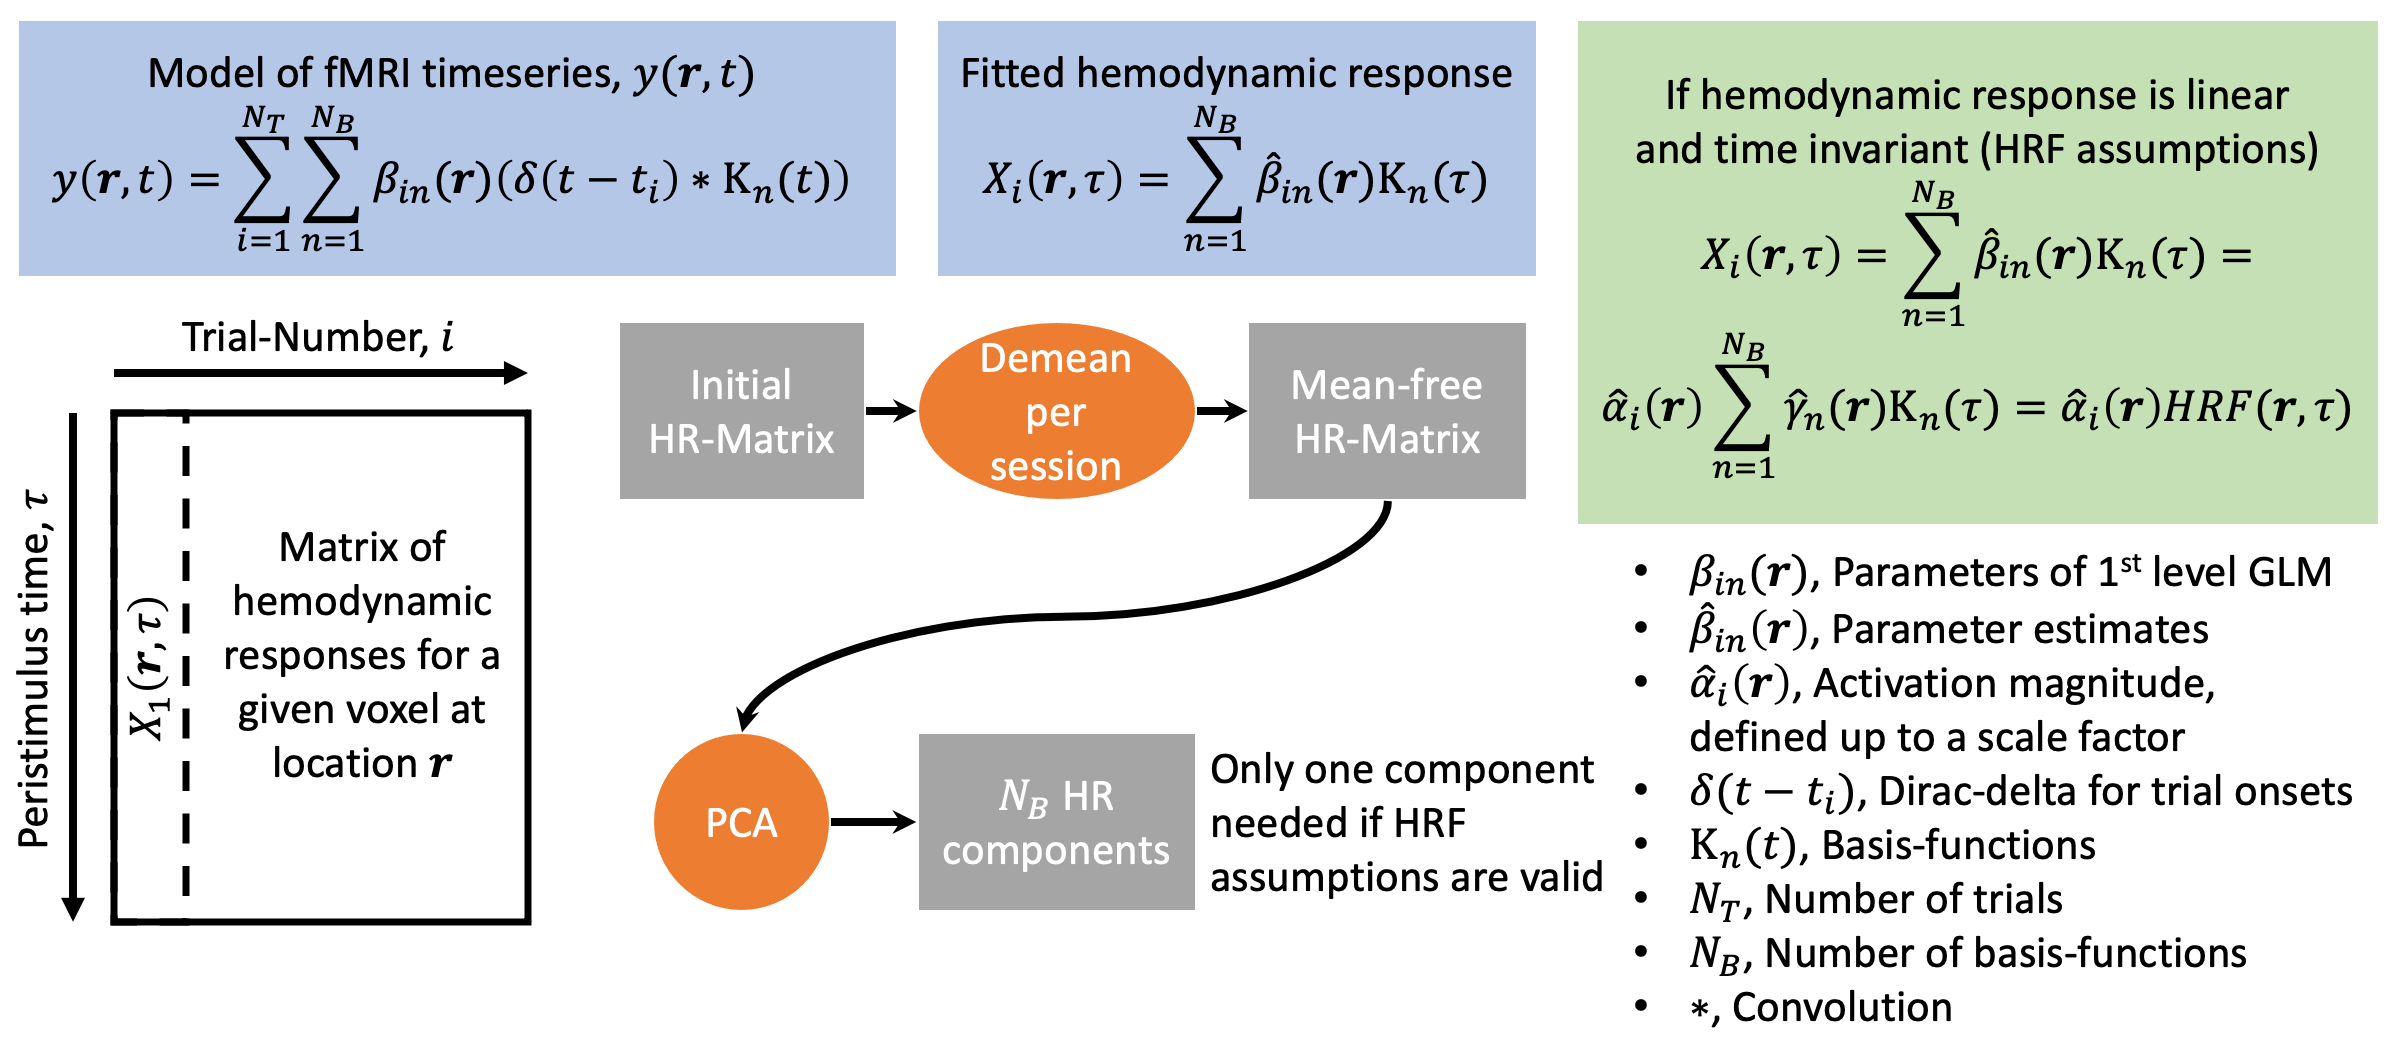
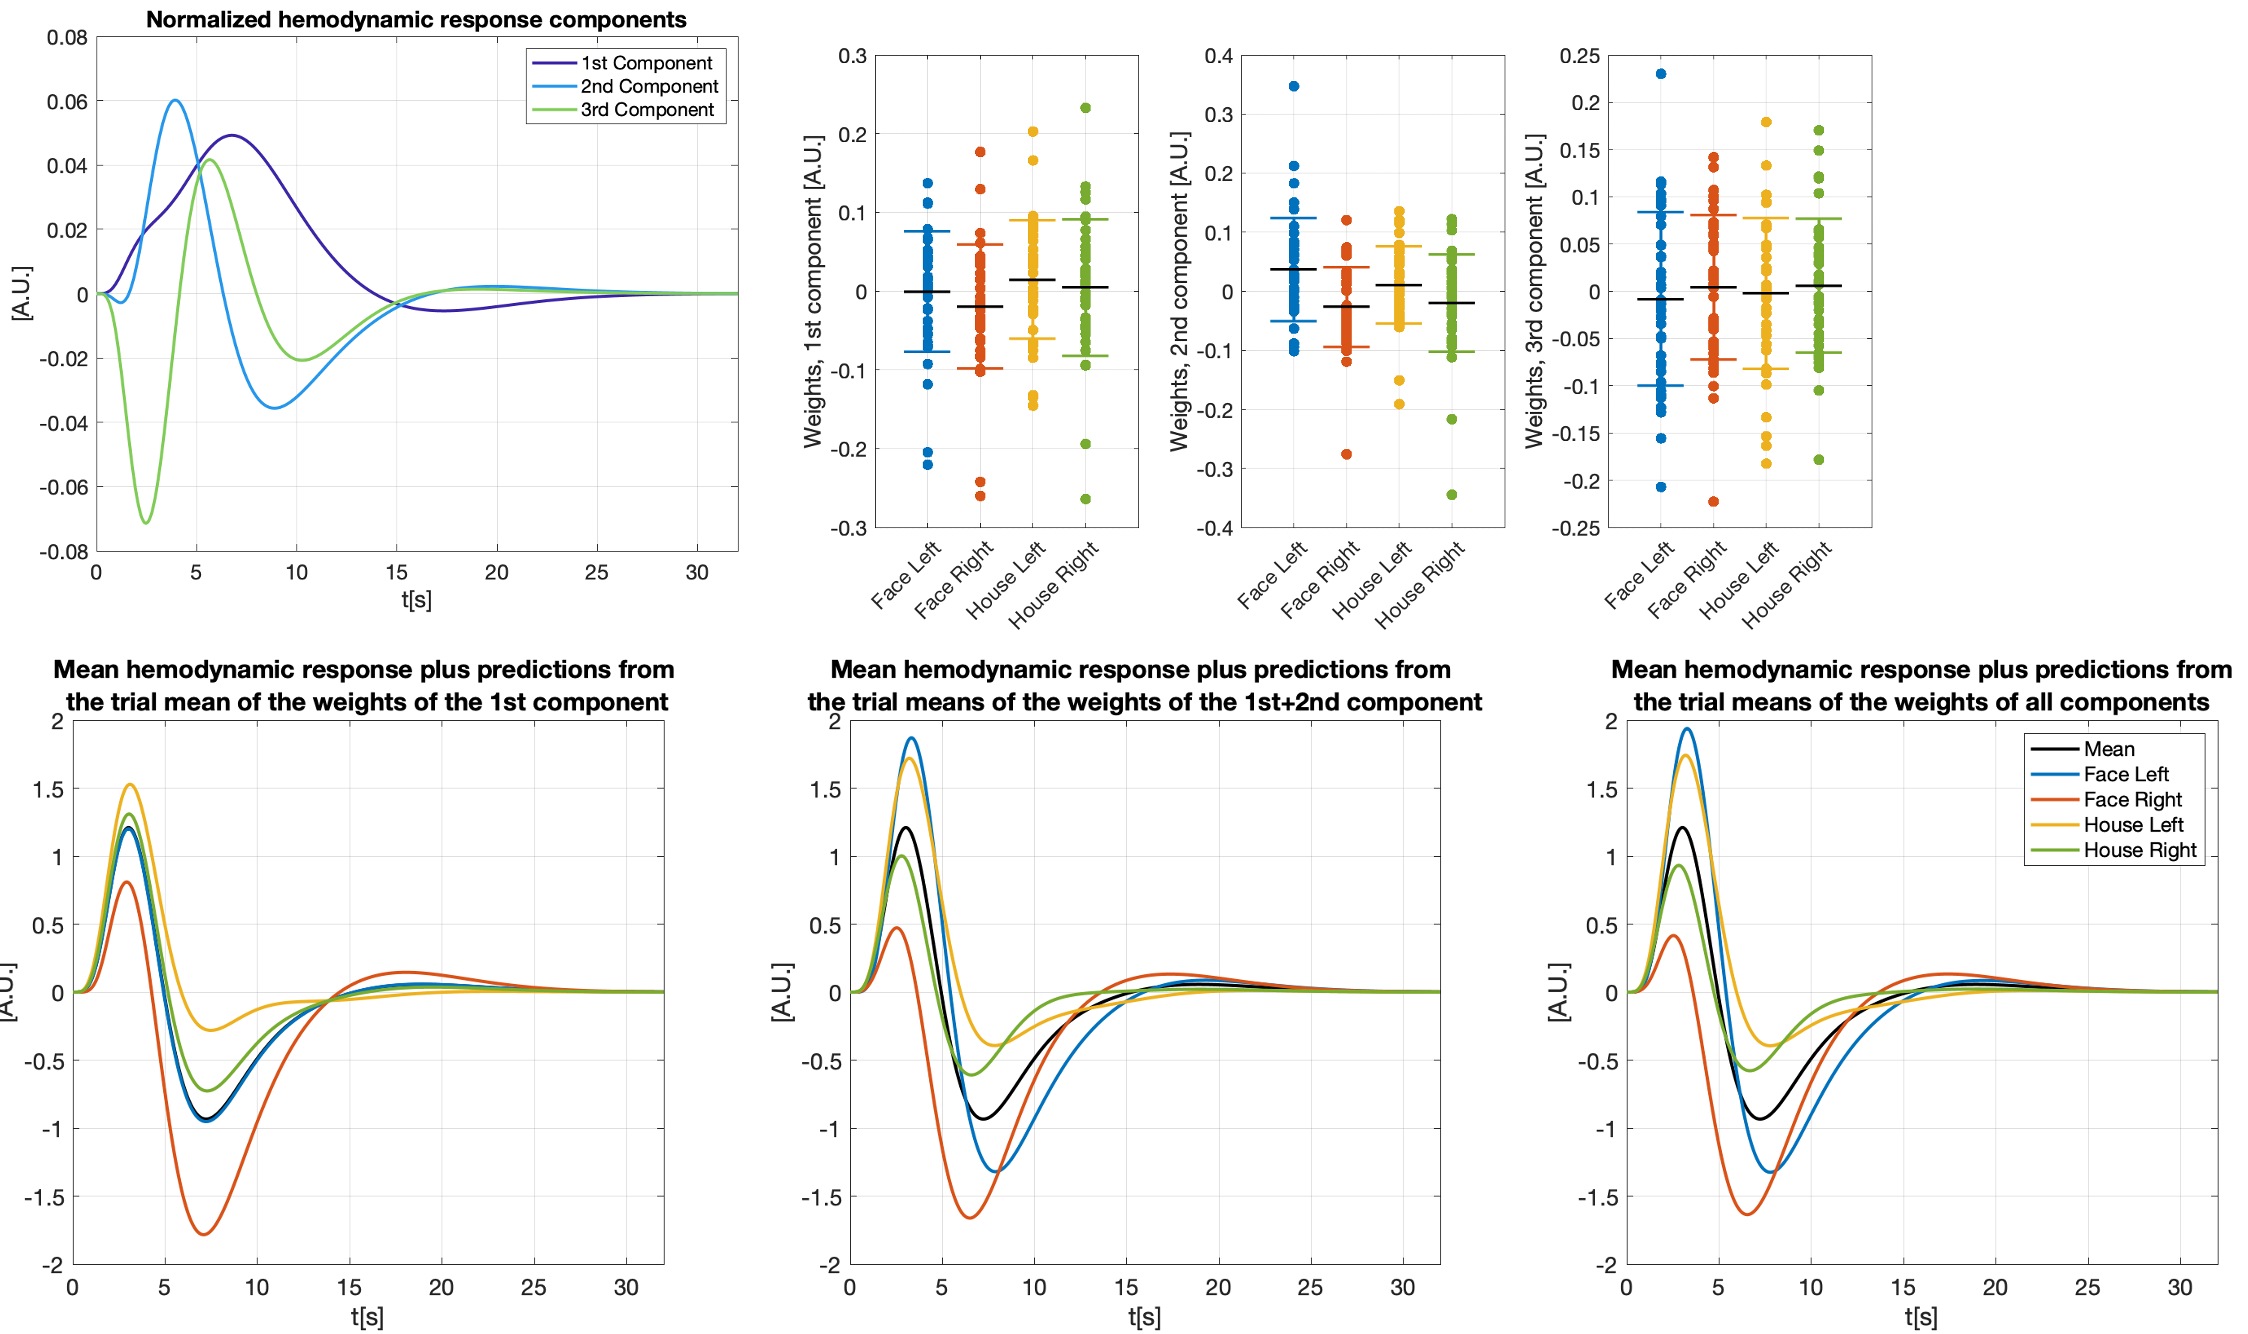
We modeled trial-specific hemodynamic responses as a linear combination of the 3 basis functions (see Figure 2 for details) to capture trial-by-trial deviations of the hemodynamic response from the HRF. If differences in activation strength were the sole cause of hemodynamic response variations, we would be able to fit all of them perfectly using scaled versions of one main component, and this main component would be equal to the HRF up to some scaling.
Placing all trial-specific hemodynamic responses (as modeled by three basis functions) in peristimulus time as columns in a matrix allowed us to compute three components using PCA. Note, this matrix has rank 3 as we used 3 basis functions. The weights of those hemodynamic response components were analyzed in relation to the time needed to react to the visual stimulus and the trial-type ((face, house)x(left hand, right hand), both of which are trial-specific quantities.
Results
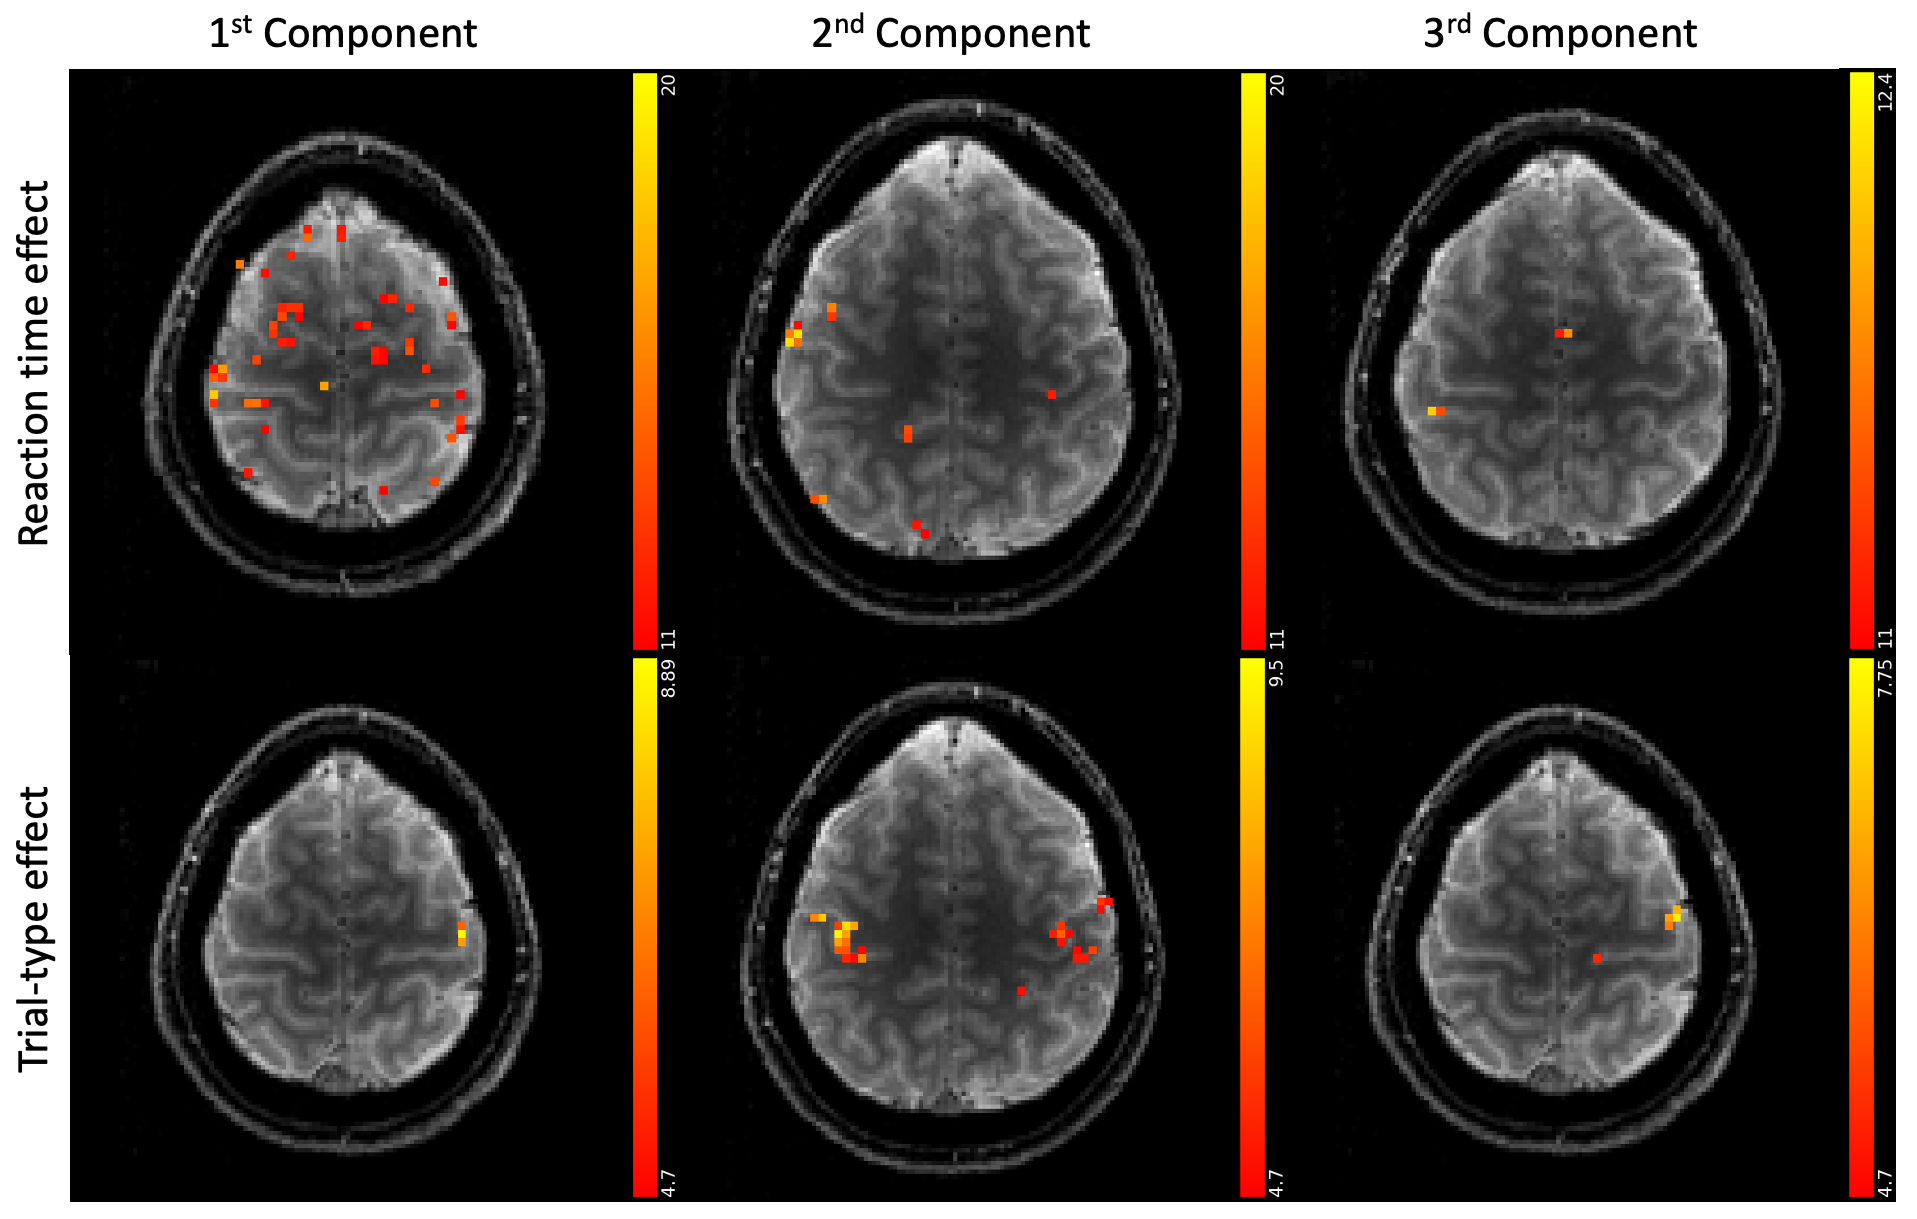
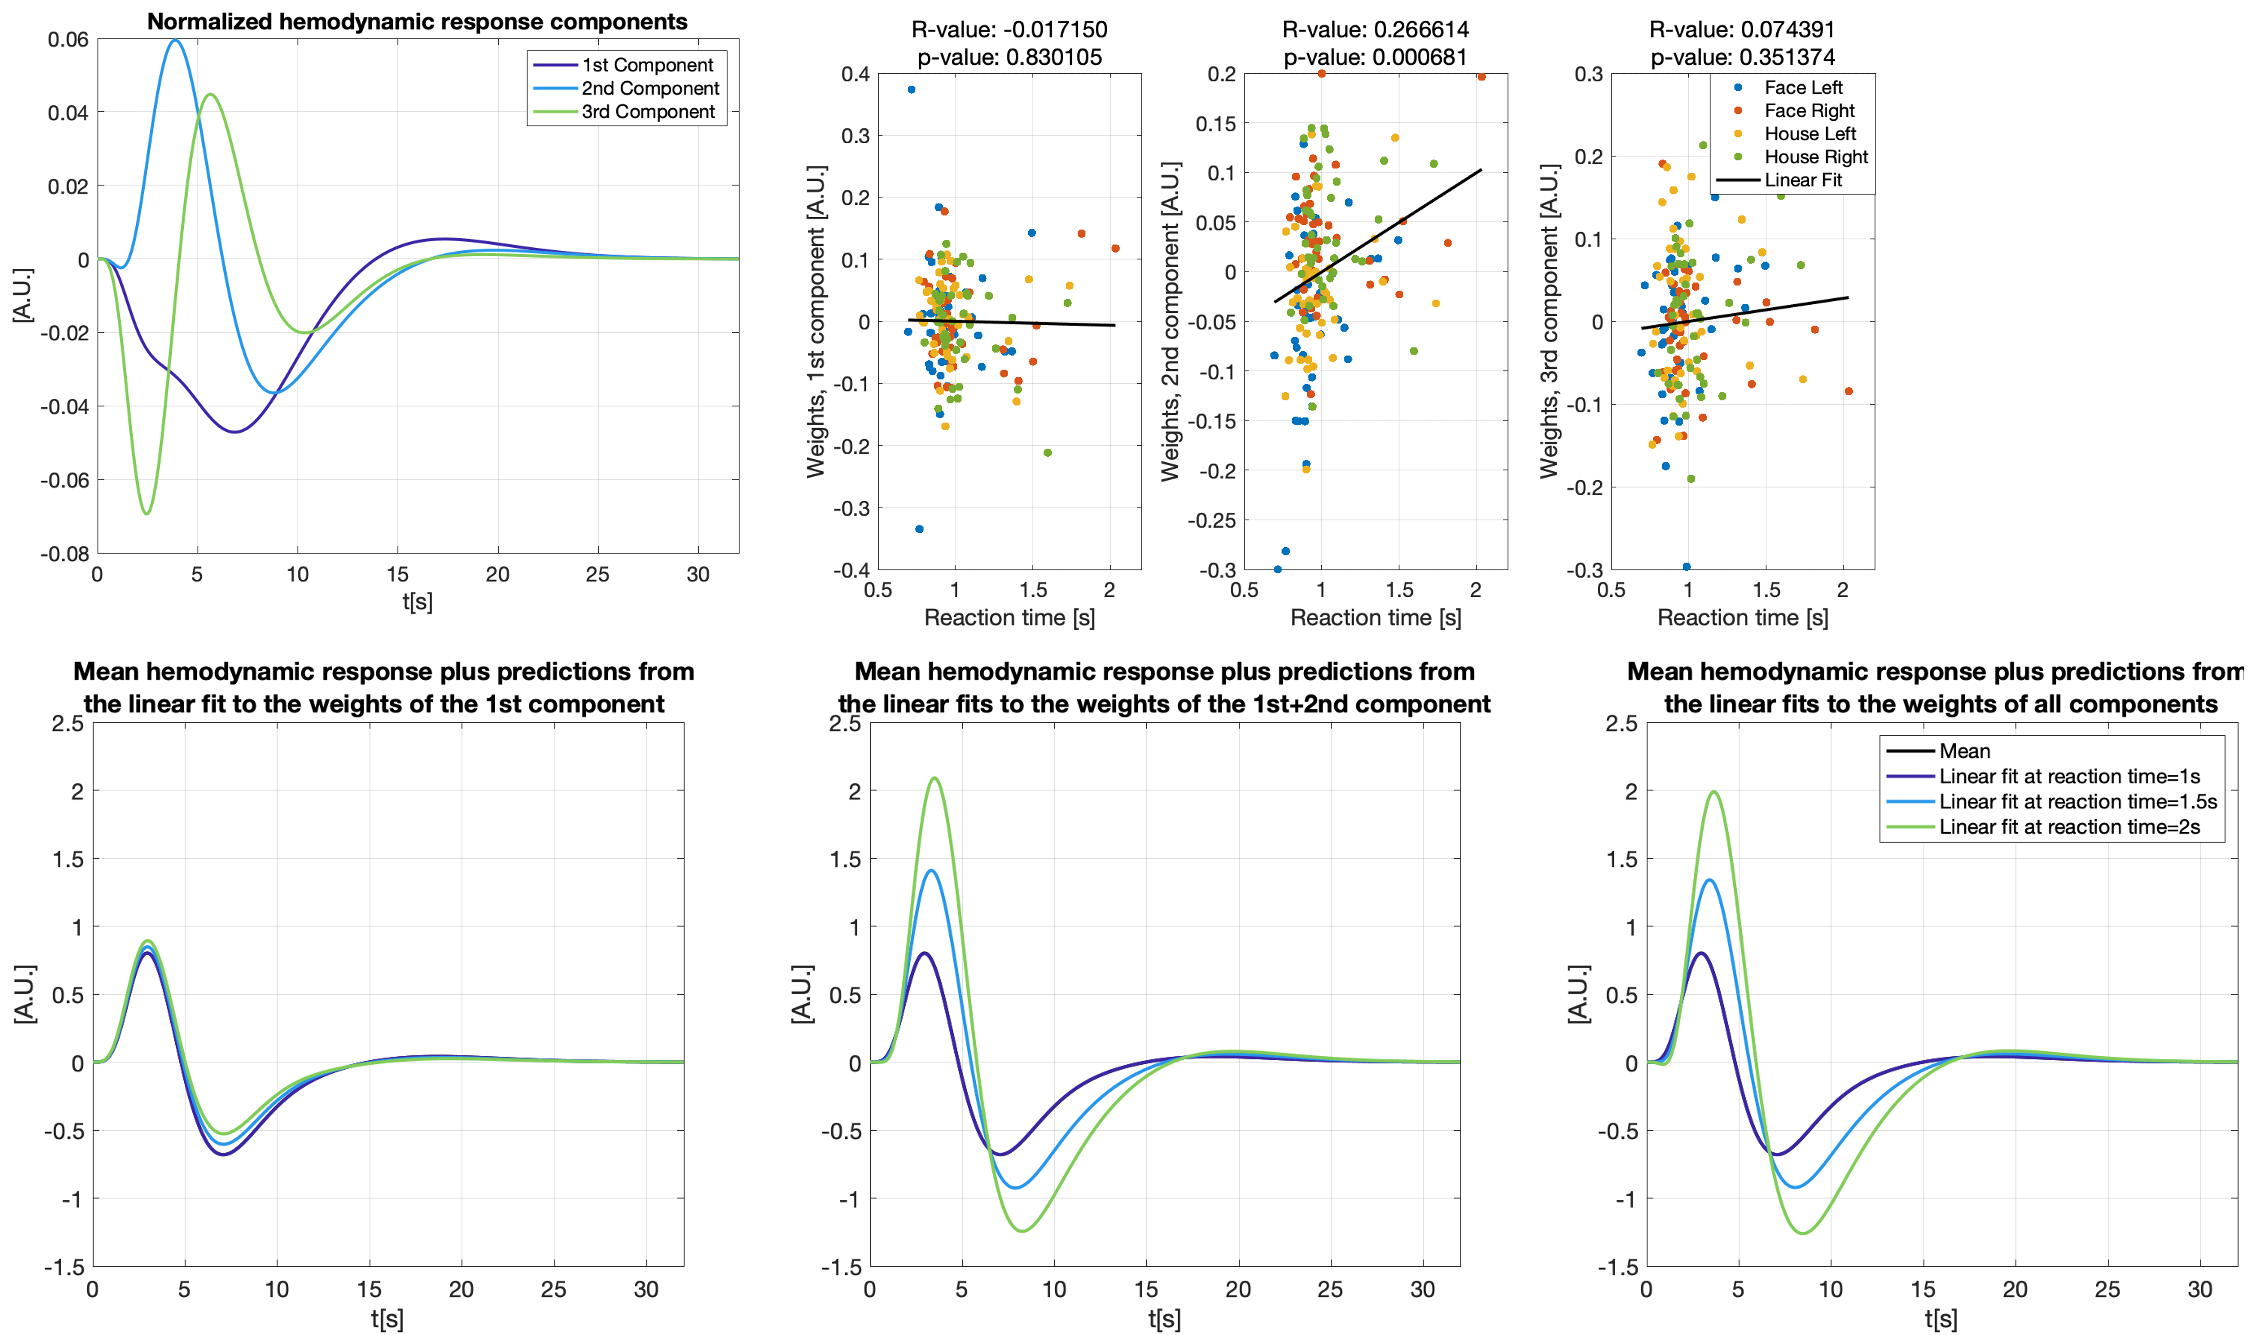
Figure 3 shows different slices covering the primary motor cortex overlayed by a statistical analysis of the component weights testing for significant effects (uncorr. p<0.001) of reaction time and trial-type in the component weights. Voxels with significant responses could be identified in all components.Detailed analyses of two significant voxels (both in the primary motor cortex) including the computed hemodynamic response components, and the trial-specific weights of the components are shown in Figures 4 and 5. Predicted hemodynamic responses according to reaction time or trial type are also shown, however, the mean hemodynamic response was added again as the components were computed on demeaned data.
Trial-specific alternations of the hemodynamic response could clearly be revealed. Going beyond what can be observed with common GLM analyses, the 2nd component in Figure 4 shows a linear relation with the reaction time which alters the hemodynamic response. As expected, left and right hand trials show the strongest differences for the voxel analyzed in Figure 5.
Discussion
We find that trial-specific hemodynamic responses can be decomposed into three components. In contrast, only one component would be expected if variation in the underlying magnitude of neuronal activation represented the sole reason for across-trial differences in hemodynamic responses. This suggests that ultra-fast fMRI can capture changes in hemodynamic responses that either reflect trial-wise changes in neuronal activity, changes in the neurovascular coupling (e.g. due to nonlinearities arising from stimulus pacing or temporal history effects), or both. Ultra-fast fMRI thus promises to provide critical information needed for more refined models of hemodynamic responses.Concerning our results in motor cortex, the differences related to left and right trials are dominant in the voxel shown in Figure 5. This voxel is in the primary motor cortex where it is known that neuronal activity is tightly linked to contralateral hand movements. Note that the trial-type effect is significant for many voxels in 2nd component even though the 1st component is, by definition, the one maximizing the explained variance in all trial specific hemodynamic responses.
Conclusion
Trial-specific variations in hemodynamic responses can be revealed using ultra-fast fMRI.Acknowledgements
No acknowledgement found.References
1. Polimeni, J.R. and L.D. Lewis, Imaging faster neural dynamics with fast fMRI: A need for updated models of the hemodynamic response. Progress in Neurobiology, 2021: p. 102174.
2. Lindquist, M.A., et al., Modeling the hemodynamic response function in fMRI: efficiency, bias and mis-modeling. Neuroimage, 2009. 45(1 Suppl): p. S187-98.
3. Buxton, R.B., E.C. Wong, and L.R. Frank, Dynamics of blood flow and oxygenation changes during brain activation: the balloon model. Magn Reson Med, 1998. 39(6): p. 855-64.
4. Handwerker, D.A., J.M. Ollinger, and M. D'Esposito, Variation of BOLD hemodynamic responses across subjects and brain regions and their effects on statistical analyses. NeuroImage, 2004. 21(4): p. 1639-1651.
5. Engel, M., et al., T-Hex: Tilted hexagonal grids for rapid 3D imaging. Magnetic Resonance in Medicine, 2021. 85(5): p. 2507-2523.
6. Wilm, B.J., et al., Higher order reconstruction for MRI in the presence of spatiotemporal field perturbations. Magn Reson Med, 2011. 65(6): p. 1690-701.
7. Dietrich, B.E., et al., Continuous magnetic field monitoring using rapid Re-excitation of NMR probe sets. IEEE transactions on medical imaging, 2016. 35(6): p. 1452-1462.
8. Ma, D.S., J. Correll, and B. Wittenbrink, The Chicago face database: A free stimulus set of faces and norming data. Behav Res Methods, 2015. 47(4): p. 1122-1135.
9. Filliter, J.H., et al., The DalHouses: 100 new photographs of houses with ratings of typicality, familiarity, and degree of similarity to faces. Behavior Research Methods, 2016. 48(1): p. 178-183.
10. Friston, K.J., et al., Event-related fMRI: characterizing differential responses. Neuroimage, 1998. 7(1): p. 30-40.
11. Kasper, L., et al., The PhysIO Toolbox for Modeling Physiological Noise in fMRI Data. J Neurosci Methods, 2017. 276: p. 56-72.
Figures