3667
Mapping stimulus-driven hemodynamic changes in white matter using 7T high-resolution fMRI1Center for Data Science, New York University, New York City, NY, United States, 2Athinoula A. Martinos Center for Biomedical Imaging, Massachusetts General Hospital, Boston, MA, United States, 3Section on Functional Imaging Methods, Laboratory of Brain and Cognition, National Institute of Health, Bethesda, MD, United States, 4Functional MRI Core, National Institute of Health, Bethesda, MD, United States, 5Department of Radiology, Harvard Medical School, Boston, MA, United States, 6Harvard-MIT Division of Health Sciences and Technology, Massachusetts Institute of Technology, Cambridge, MA, United States
Synopsis
Keywords: fMRI, White Matter
In this study, by integrating 7T high-resolution imaging and massive data averaging, we show that white matter fMRI activations can be detected at a single-voxel level. Hemodynamic changes evoked by the flickering checkerboard stimuli were not homogenous within the optic radiation, and the averaged pattern exhibited a delayed time to peak longer than V1, consistent with previous literature. The current datasets also revealed stimulus-locked changes in certain white-matter tracts beyond the visual pathway.Introduction
Over the past decade, multiple studies have shown that white-matter fMRI activations can be detected across a range of cognitive tasks and naturalistic conditions [1-6]. Despite this empirical evidence, there have been some skepticism over white-matter fMRI—not only because of the sometimes elusive nature of these apparent white-matter hemodynamic changes, but also because most studies employed a modest spatial resolution (>3 mm isotropic voxel size), raising concerns regarding contamination from adjacent gray-matter tissue. Employing smaller-voxel acquisitions is perhaps the most straightforward approach to address the latter concern, yet, surprisingly, little effort has been devoted to mapping white-matter changes at finer spatial resolutions. Therefore, our primary goal was to leverage 7T high-resolution fMRI to reduce gray-matter contamination and thus increase confidence in functional mapping in white matter. A simple flickering checkerboard visual stimulus was used to generate robust fMRI changes in the visual system; and massively repeated imaging sessions were acquired on four subjects to achieve adequate sensitivity to detect fMRI changes at a single-voxel level [7,8].Methods
Two independent fMRI datasets were analyzed. Dataset I: One subject underwent 44 runs of flickering checkerboard visual experiments (on/off=16/20 s per block, five blocks per run). Functional MRI data were collected on a 7T Siemens scanner using a single-shot gradient-echo simultaneous multi-slice EPI sequence [9], 1.1-mm isotropic voxel size, TR/TE=1700/26 ms, flip angle=72°, FOV=192x192 mm, 87 slices, acceleration factor R=4, SMS factor=3. Dataset II: Descriptions of this dataset are in [8]. Three subjects each performed 1 of 3 different tasks: a) full field-of-view visual stimulation + attention control task (“fFOV+Task”); b) full field-of-view visual stimulation only (“fFOV only”); and c) hemifield visual stimulation (“hFOV only”). Each subject underwent 100 runs of the same task (on/off=20/40 s per block, five blocks per run). Functional MRI data were collected on a 7T Siemens scanner using a single-shot gradient-echo EPI sequence, 2 mm isotropic voxel size, TR/TE=2000/25 ms, flip angle=50°, FOV=192x192 mm, 54 slices, acceleration factor R=2.All functional runs were co-registered using Freesurfer and FSL Flirt. Stimulus-driven hemodynamic responses (SHRs) were derived by averaging the evoked percent signal changes across all task blocks/sessions. For each dataset, a conservative white-matter mask was generated by segmenting a high-resolution T1 anatomical image using Freesurfer, with further erosion in the native functional space (~2 mm erosion). Voxels within each white-matter tract were further extracted by renormalizing the Xtract Atlas [10,11] to each subject’s native space (each tract was carefully inspected and thresholded to ensure no overlap with gray matter). Modest spatial smoothing (FWHM = 2 and 4 mm) was applied to enhance the signal to noise ratio of voxel-wise responses. The smoothing kernel was constrained within the conservative optic radiation mask to avoid contamination from adjacent gray-matter signals. To examine the spatiotemporal structures of SHRs within the optic radiation, we also performed principal component analysis (PCA) on voxel-wise signals. SHRs of four additional white matter tracts, including Superior Longitudinal Fasciculus 1 and 3, Frontal Aslant and Arcuate Fasciculus, were also analyzed due to higher number of voxels within each of these tracts and their clear separations from the gray matter.
Results & Discussion:
1. Wide-spread, stimulus-locked activation is observed in gray matter (Fig. 1): To test the sensitivity of our new high-resolution data, we first reproduced previous observations of responses in cortical gray matter following intensive within-subject averaging [7,8], and indeed found activations in almost every cortical gray-matter region (A). SHRs exhibited substantial variations across the brain, which cannot be fully modelled by the canonical hemodynamic response (B), as expected.2. SHRs in V1 vs. optic radiation (Fig. 2): On average, the amplitudes of SHRs within the optic radiation were an order of magnitude smaller than SHRs in the recipient cortical gray-matter region (V1). The visual stimuli resulted in a delayed time to peak in white matter, in agreement previous studies [3,6].
3. SHRs are spatially heterogenous within the optic radiation (Figs. 3 & 4): Considerable heterogeneity of fMRI responses is seen at the single-voxel level. For instance, a prolonged initial decrease was seen in voxel 3, but this pattern was not clear in other voxels (Fig. 3, Dataset I). The first PC within the optic radiation resembled gray-matter SHRs; and the second PC exhibited a biphasic pattern with a delayed time to peak (Fig. 4).
4. SHRs are identified in white-matter tracts beyond the visual pathway (Fig. 5): We were also able to detect SHRs in some white-matter tracts not directly connecting the visual pathway, consistent with extensive cortical activations evoked by the visual stimuli (Fig. 1). SHRs beyond the optic radiation had reduced magnitudes however and varied from location to location.
Conclusion
By employing 7T high-resolution imaging and massive data averaging, we were able to detect stimulus-driven fMRI changes in white matter at the single voxel level. In our datasets, SHRs were heterogenous within the optic radiation, and the averaged pattern exhibited a delayed time to peak longer than V1, consistent with previous literature. We also revealed stimulus-locked changes in white-matter tracts beyond the visual pathway. Further investigations will test the reproducibility of the present findings in a larger sample size and probe the hemodynamic mechanisms underlying these white-matter signals.Acknowledgements
This work was supported in part by the NIH NINDS (grants R00-NS118120 and R01-NS128843), NIBIB (grants P41-EB030006 and R01-EB019437), the BRAIN Initiative (NIH NIMH grants R01-MH111419 and NINDS U19-NS123717), NIMH Intramural Research Program, Harvard Mind Brain Behavior Faculty Research Award, and the MGH/HST Athinoula A. Martinos Center for Biomedical Imaging; and the resources provided by the NIH Shared Instrumentation Grant S10-RR019371.References
[1] Gawryluk, J.R., Mazerolle, E.L. and D'Arcy, R.C., 2014. Does functional MRI detect activation in white matter? A review of emerging evidence, issues, and future directions. Frontiers in neuroscience, 8, p.239.
[2] Gore, J.C., Li, M., Gao, Y., Wu, T.L., Schilling, K.G., Huang, Y., Mishra, A., Newton, A.T., Rogers, B.P., Chen, L.M. and Anderson, A.W., 2019. Functional MRI and resting state connectivity in white matter-a mini-review. Magnetic resonance imaging, 63, pp.1-11.
[3] Li, M., Newton, A.T., Anderson, A.W., Ding, Z. and Gore, J.C., 2019. Characterization of the hemodynamic response function in white matter tracts for event-related fMRI. Nature communications, 10(1), pp.1-11.
[4] Marussich, L., Lu, K.H., Wen, H. and Liu, Z., 2017. Mapping white-matter functional organization at rest and during naturalistic visual perception. Neuroimage, 146, pp.1128-1141.
[5] Ding, Z., Huang, Y., Bailey, S.K., Gao, Y., Cutting, L.E., Rogers, B.P., Newton, A.T. and Gore, J.C., 2018. Detection of synchronous brain activity in white matter tracts at rest and under functional loading. Proceedings of the National Academy of Sciences, 115(3), pp.595-600.
[6] Schilling, K.G., Li, M., Rheault, F., Ding, Z., Anderson, A.W., Kang, H., Landman, B.A. and Gore, J.C., 2022. Anomalous and heterogeneous characteristics of the BOLD hemodynamic response function in white matter. Cerebral Cortex Communications, 3(3), p.tgac035.
[7] Gonzalez-Castillo, J., Saad, Z.S., Handwerker, D.A., Inati, S.J., Brenowitz, N. and Bandettini, P.A., 2012. Whole-brain, time-locked activation with simple tasks revealed using massive averaging and model-free analysis. Proceedings of the National Academy of Sciences, 109(14), pp.5487-5492.
[8] Gonzalez-Castillo, J., Hoy, C.W., Handwerker, D.A., Roopchansingh, V., Inati, S.J., Saad, Z.S., Cox, R.W. and Bandettini, P.A., 2015. Task dependence, tissue specificity, and spatial distribution of widespread activations in large single-subject functional MRI datasets at 7T. Cerebral Cortex, 25(12), pp.4667-4677.
[9] Setsompop, K., Gagoski, B.A., Polimeni, J.R., Witzel, T., Wedeen, V.J. and Wald, L.L., 2012. Blipped‐controlled aliasing in parallel imaging for simultaneous multislice echo planar imaging with reduced g‐factor penalty. Magnetic resonance in medicine, 67(5), pp.1210-1224.
[10] Warrington, S., Bryant, K.L., Khrapitchev, A.A., Sallet, J., Charquero-Ballester, M., Douaud, G., Jbabdi, S., Mars, R.B. and Sotiropoulos, S.N., 2020. XTRACT-Standardised protocols for automated tractography in the human and macaque brain. Neuroimage, 217, p.116923.
[11] De Groot, M., Vernooij, M.W., Klein, S., Ikram, M.A., Vos, F.M., Smith, S.M., Niessen, W.J. and Andersson, J.L., 2013. Improving alignment in tract-based spatial statistics: evaluation and optimization of image registration. Neuroimage, 76, pp.400-411.
[12] Schaefer, A., Kong, R., Gordon, E.M., Laumann, T.O., Zuo, X.N., Holmes, A.J., Eickhoff, S.B. and Yeo, B.T., 2018. Local-global parcellation of the human cerebral cortex from intrinsic functional connectivity MRI. Cerebral cortex, 28(9), pp.3095-3114.
Figures
Figure 1 SHRs in the cerebral cortex (Dataset I). (A) Cortical parcellations were generated using a 7-network 100-parcel functional atlas [12]. Each panel shows the response of one cortical parcel. Mean and standard errors across all blocks and sessions are shown. (B) Task activations derived from a general linear model analysis, using the canonical hemodynamic response function. These results reproduce findings from previous studies [7,8].
Figure 2 SHRs of V1 and optic radiation (Dataset I and Dataset II, unsmoothed data). While the shapes of the SHRs in the white matter are not clearly recognizable, they are consistent across trials, as evidenced in the low trial-to-trial variability represented in the error bars, and similar in magnitude to responses seen in gray matter outside the visual network (as shown in Figure 1). For Dataset II “hFOV Only”, only the contralateral optic radiation was included for analyses.
Figure 3 Illustration of spatially varying SHRs within the optic radiation (Dataset I and Dataset II). Responses with different spatial smoothing kernels are shown.
Figure 4 Spatial scores and time courses of the principal components within the optic radiation (Dataset I and Dataset II, unsmoothed data). The map of the scores demonstrates that white-matter locations exhibiting the positive monophasic response can be adjacent to locations exhibiting the more negative (or delayed) multiphasic response.
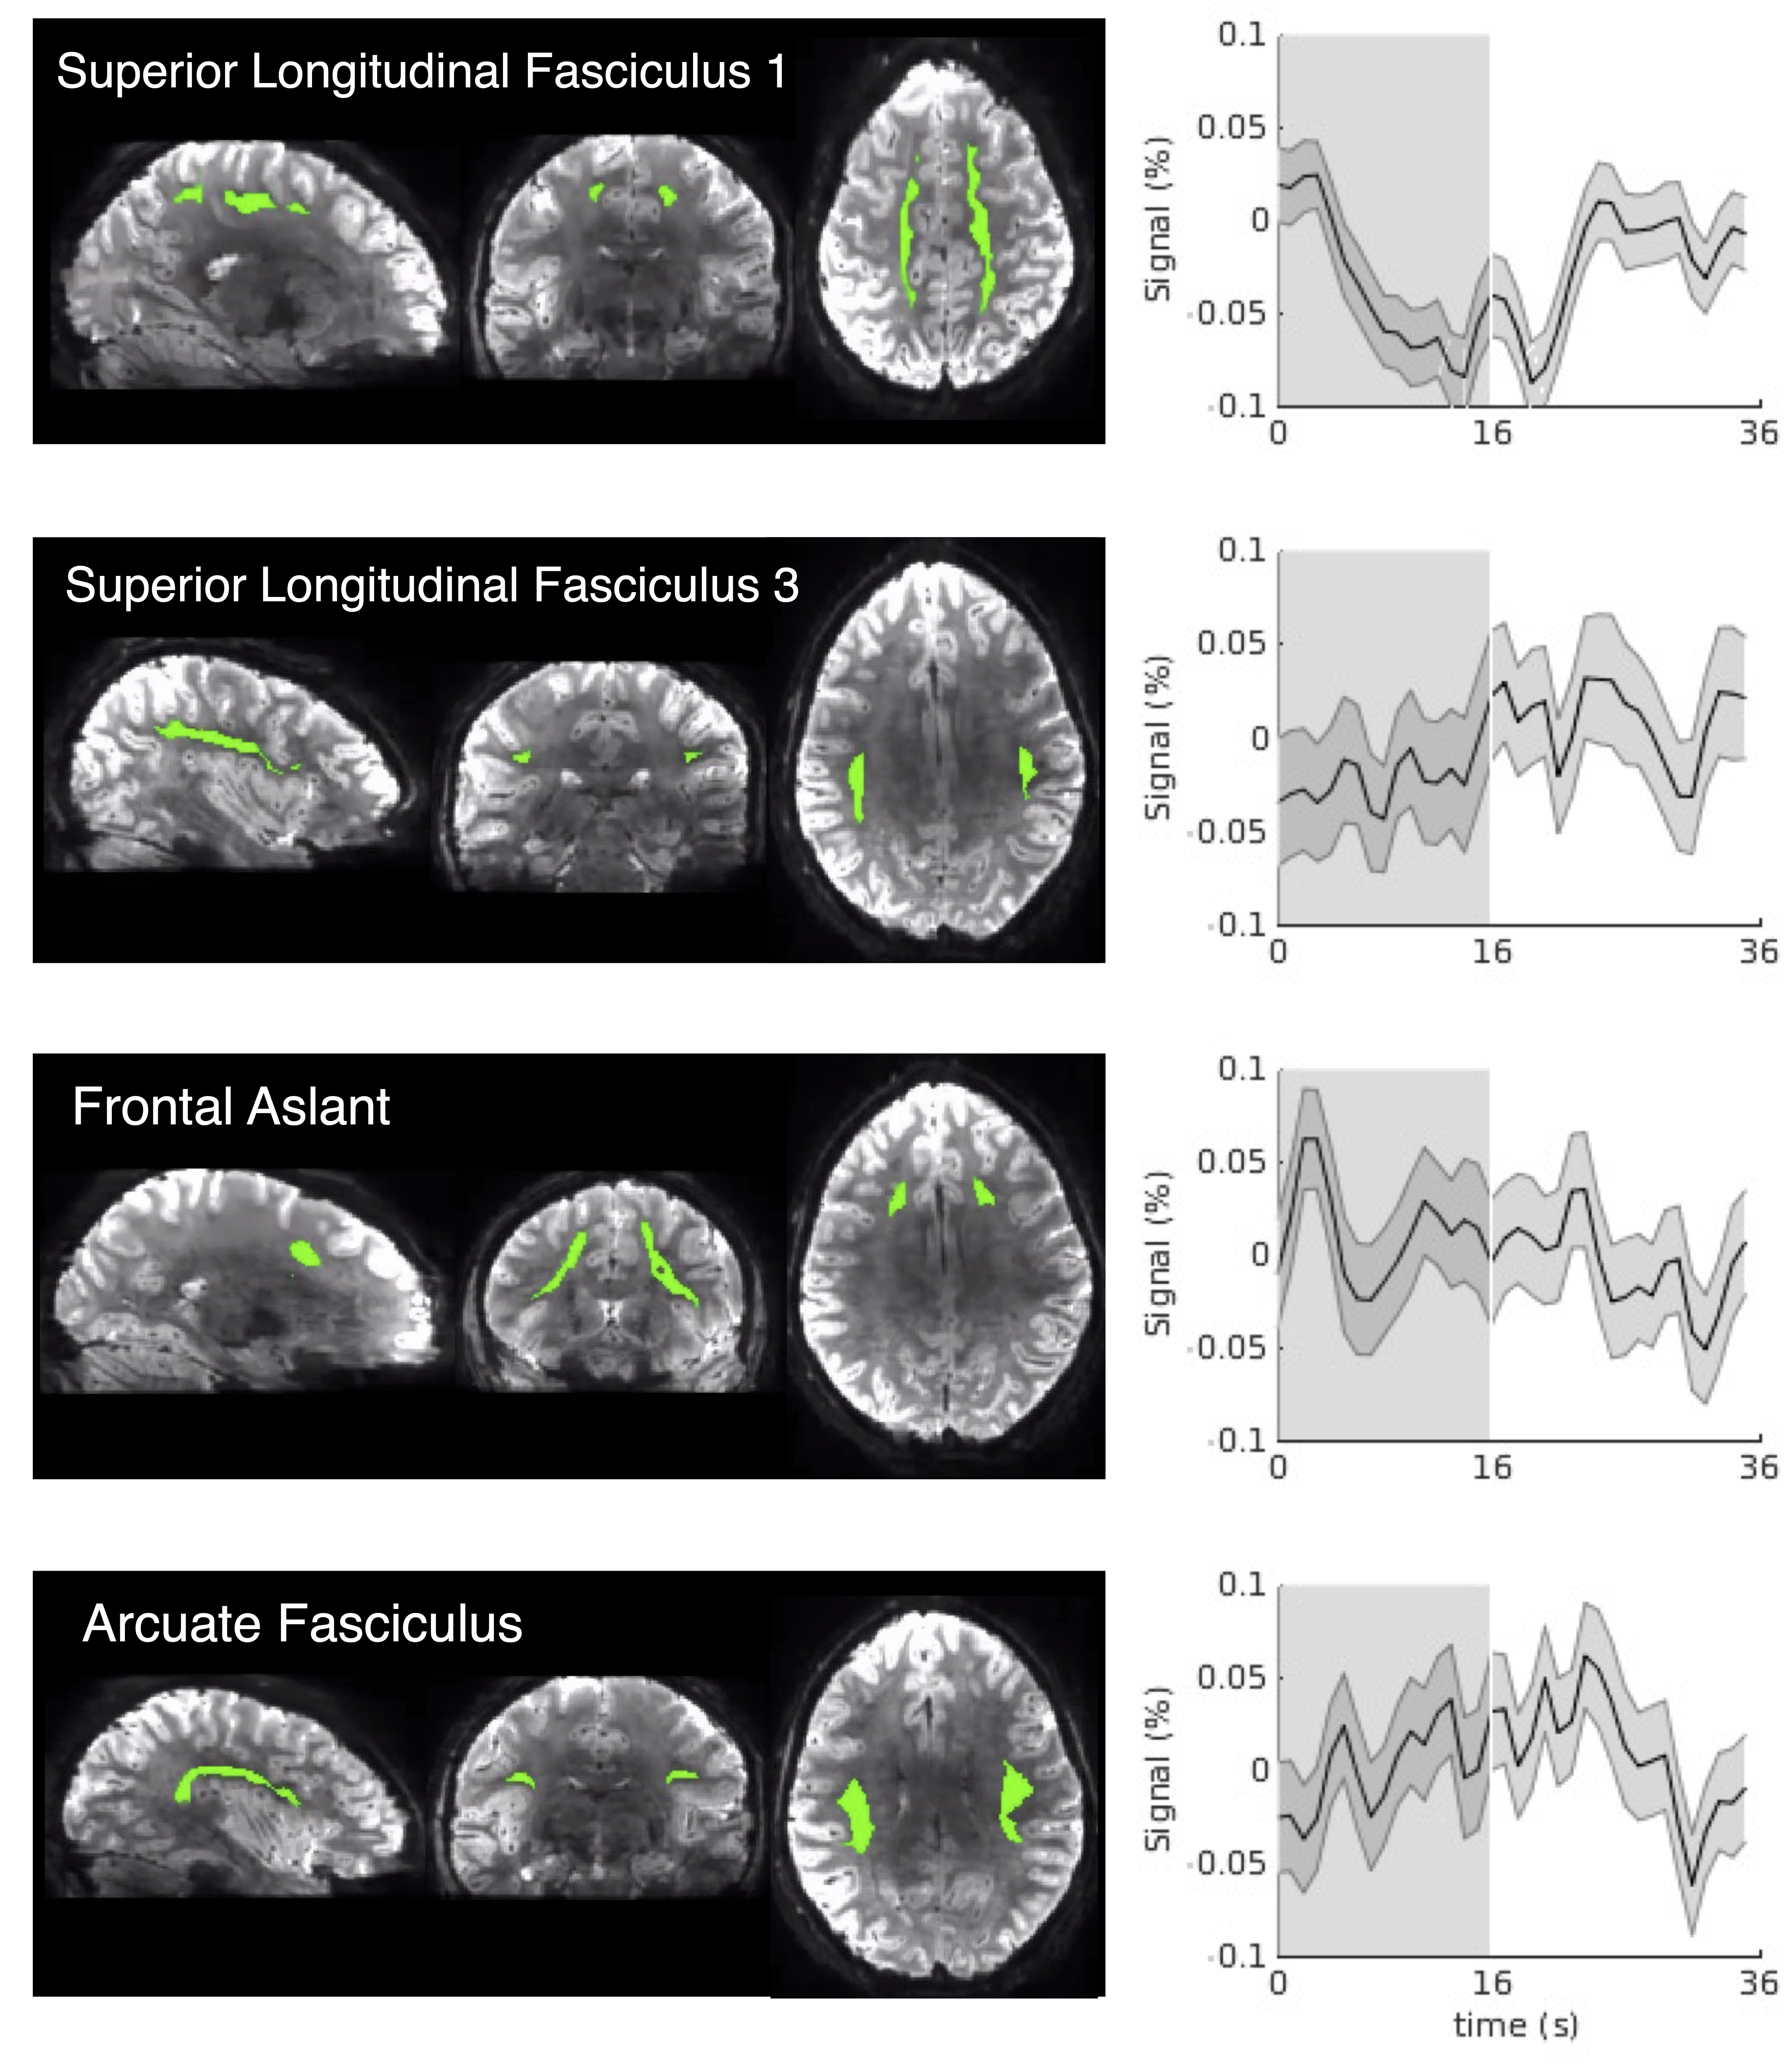
Figure 5. SHRs of exemplar white-matter tracts outside the optic radiation (Dataset I, unsmoothed data, mean and standard errors across all trials are shown). The spatial mask of each tract is displayed on the left of the SHR.