3665
Dependence of the EPI and bSSFP resting-state fMRI signals on the cortical orientation relative to B0: Initial observations at 9.4 Tesla
Dana Ramadan1,2, Jonas Bause1, Rüdiger Stirnberg3, Philipp Ehses3, and Klaus Scheffler1,4
1Department for High-field Magnetic Resonance, Max Planck Institute for Biological Cybernetics Tübingen, Tübingen, Germany, 2Graduate Training Centre of Neuroscience, University of Tübingen, Tübingen, Germany, 3German Center for Neurodegenerative Diseases (DZNE), Bonn, Germany, 4Department of Biomedical Magnetic Resonance, University of Tübingen, Tübingen, Germany
1Department for High-field Magnetic Resonance, Max Planck Institute for Biological Cybernetics Tübingen, Tübingen, Germany, 2Graduate Training Centre of Neuroscience, University of Tübingen, Tübingen, Germany, 3German Center for Neurodegenerative Diseases (DZNE), Bonn, Germany, 4Department of Biomedical Magnetic Resonance, University of Tübingen, Tübingen, Germany
Synopsis
Keywords: fMRI, High-Field MRI, Blood Vessels, Brain
The spatial specificity of fMRI with GRE-EPI is significantly affected by large draining veins on the cortical surface. They cause susceptibility changes that are strongest when the veins are oriented perpendicular to B0. Since they follow the cortical curvature, their orientation to B0 can be approximated by the cortical orientation. Previous studies have shown a high dependence of the GRE-EPI signal on the cortical orientation, reflecting its disadvantage of being sensitive to these veins. In this preliminary two-subject study, this phenomenon is investigated with GRE-EPI and bSSFP in different cortical depths to experimentally explore the sensitivity of bSSFP to microvasculature.Introduction
Susceptibility offsets between the intra-vascular and extra-vascular spaces of venous blood are highest when the vessels are oriented perpendicular to the main axis of the magnetic field ($$$\overrightarrow{B_0}$$$)1. It is well known, that large pial veins follow the cortical curvature, ascending intracortical veins run perpendicular to them, whereas the capillaries are oriented randomly. The gradient-echo (GRE) echo-planar imaging (EPI) blood oxygenation level dependent (BOLD) fMRI signal is particularly sensitive to the large draining veins distant from the capillary bed2. Due to the strict architecture of the large veins to the cortex, studies showed a strong dependence of the GRE-EPI signal on the cortical orientation to $$$\overrightarrow{B_0}$$$3–5, expected to increase with B06. Contrary to GRE-EPI, MRI signal simulations have shown a high sensitivity of bSSFP to microvasculature at ultra-high field strengths5. In this work, we aim to prove this experimentally by comparing segmented 3D GRE-EPI to bSSFP in their resting-state signal dependence on the cortical orientation to $$$\overrightarrow{B_0}$$$ at 9.4T.Methods
Two subjects were scanned at a 9.4T MRI using an in-house developed transmit coil7 after giving written informed consent. A high-resolution T1-weighted MPRAGE image was acquired with inversion TR=3.26s, TI=1.48s, GRAPPA 2x2 and an isotropic resolution of 0.6mm. The parameters listed in Figure 1 were used to acquire 4 runs with 110 frames each for bSSFP and segmented 3D GRE-EPI8 with a voxel size of 1.1mm isotropic and a comparable volume TR of 3.026s and 3.0s for bSSFP and EPI, respectively. The slab was positioned tangentially to the calcarine sulcus. For the EPI sequence, phase encoding (PE) was performed in anterior-to-posterior direction, with one additional run with 5 frames in reversed PE-direction to perform distortion correction.After motion correction in SPM12, the time-normalized coefficient of variation (COV) defined as the inverse of the effective tSNR $$$(COV=\frac{1}{tSNR_{eff}}=\frac{\sigma}{\mu}\sqrt{TR_{vol}})$$$ was calculated. To avoid any interpolation of the functional data (e.g., voxel displacement due to distortion correction), the MPRAGE was co-registered to the mean of all runs, with an extra warping step for the EPI data.
Cortical orientations to $$$\overrightarrow{B_0}$$$ were obtained from FreeSurfer (v7.1.1) by a) segmenting the anatomical image into gray matter (GM) and white matter (WM), b) calculating 9 intermediate surfaces9 between the WM/GM and GM/CSF boundaries and finally the angle between the cortical surface normal and $$$\overrightarrow{B_0}$$$ ($$$\theta_{B_0}$$$)4. The cortical orientation values calculated on the surface were converted to voxel space and co-registered to the functional images using the same procedure as for the MPRAGE (Figure 2).
Five equi-distant cortical depths were calculated in LayNii10 using a co-registered GM/WM segmentation. Because the orientation distribution follows the distribution of angles on a sphere ($$$\sim sin(\theta_{B_0})$$$), more voxels are contained at the equator $$$(\theta_{B_0}=90^{\circ})$$$. To consider the unequal distribution, bins with constant voxel counts were calculated. The COV was plotted against the orientation in the entire cortical ribbon covered by the EPI and bSSFP scans and in five cortical depths. One EPI run of subject 1 was discarded because of excessive motion.
Results
Figure 3 shows the expected and observed distribution of $$$\theta_{B_0}$$$ in the investigated slab (A) and the calculated equal-sized bins (B). It is obvious that the intervals between the bin edges decreases towards $$$\theta_{B_0}=90^{\circ}$$$. In Figure 4, equal-sized bins are calculated in each depth and the COV is plotted against $$$\theta_{B_0}$$$ normalized on the bin containing $$$\theta_{B_0}=90^{\circ}(=0\%)$$$. Points are plotted in the middle of the respective interval and at the mean of all runs. An overall higher signal fluctuation of the COV can be seen for EPI in each depth compared to bSSFP. Figure 5 shows the depth dependence of both sequences. Higher absolute COV values (=lower tSNR) are observed with EPI compared to bSSFP (Figure 5 (left column)). While for the former sequence the values increase towards the cortical surface, the opposite is observed for bSSFP. When normalized to the deepest depth (Depth5, Figure 5 (right column)), lines containing higher $$$\theta_{B_0}$$$ values (light orange) show less depth dependence compared to smaller $$$\theta_{B_0}$$$ (black), with the opposite true for EPI.Discussion and Conclusion
The observed difference between subjects in EPI could be due to difference in angioarchitecture of large veins, whereas the similarity between subjects in bSSFP might be an indicator of its robustness against such effects. A lower cortical orientation dependence for bSSFP compared to GRE-EPI was also theoretically described by Báez-Yánez et al.5, however curves looked different for simulations of different vessel networks. Contrary to the work by Viessmann et al.4, we found a higher cortical orientation dependence in deeper depths than in superficial ones which may be due to different TR and postprocessing. Although only a relatively thin slab is investigated here, the distribution of the cortical angles shows that the number of voxels is sufficient for the analysis. The lack of orientation dependence observed in the bSSFP signal might point to higher sensitivity of bSSFP to the randomly oriented microvasculature. This signal contribution from microvessels located closer to activation areas could be an indicator for higher specificity of bSSFP compared to EPI. Further experiments with more subjects, test-retest experiments, as well as large vein segmentation are planned to investigate cortical orientation dependence of bSSFP and EPI in more detail.Acknowledgements
No acknowledgement found.References
1. Chu, S. C.-K., Xu, Y., Balschi, J. A. & Springer, C. S. J. Bulk Magnetic Susceptibility Shifts in NMR Studies of Compartmentalized Samples: Use of Paramagnetic Reagents. MAGNETIC RESONANCE IN MEDICINE 13, (1990).2. Lai, S. et al. Identification of Vascular Structures as a Major Source of Signal Contrast in High Resolution 2D and 3D Functional Activation Imaging of the Motor Cortex at 1.5T: Preliminary Results. (1993).
3. Gagnon, L. et al. Quantifying the microvascular origin of BOLD-fMRI from first principles with two-photon microscopy and an oxygen-sensitive nanoprobe. J. Neurosci. 35, 3663–3675 (2015).
4. Viessmann, O., Scheffler, K., Bianciardi, M., Wald, L. L. & Polimeni, J. R. Dependence of resting-state fMRI fluctuation amplitudes on cerebral cortical orientation relative to the direction of B0 and anatomical axes. Neuroimage 196, 337–350 (2019).
5. Báez-Yánez, M. G. et al. The impact of vessel size, orientation and intravascular contribution on the neurovascular fingerprint of BOLD bSSFP fMRI. Neuroimage 163, 13–23 (2017).
6. Gati, J. S., Menon, R. S., Ugurbil, K. & Rutt, B. K. Experimental Determination of the BOLD Field Strength Dependence in Vessels and Tissue. (1997).
7. Shajan, G. et al. A 16-channel dual-row transmit array in combination with a 31-element receive array for human brain imaging at 9.4 T. Magn. Reson. Med. 71, 870–879 (2014).
8. Stirnberg, R. & Stöcker, T. Segmented K‐space blipped‐controlled aliasing in parallel imaging for high spatiotemporal resolution EPI. Magn. Reson. Med. 85, 1540–1551 (2021).
9. Polimeni, J. R., Fischl, B., Greve, D. N. & Wald, L. L. Laminar analysis of 7T BOLD using an imposed spatial activation pattern in human V1. Neuroimage 52, 1334–1346 (2010).
10. Huber, L. (Renzo) et al. LayNii: A software suite for layer-fMRI. Neuroimage 237, 118091 (2021).
Figures
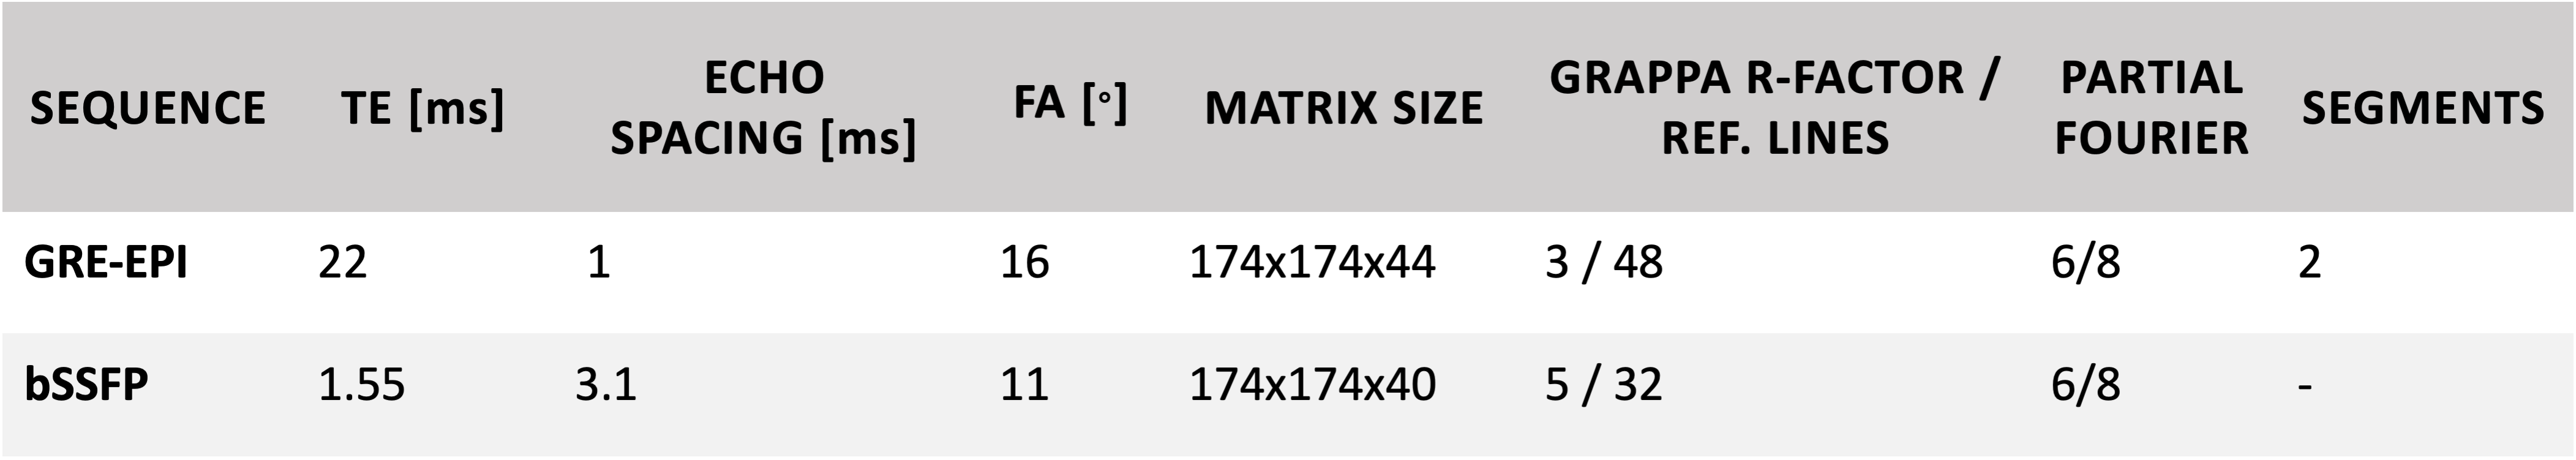
Figure 1: Acquisition parameters for the segmented 3D GRE-EPI and bSSFP to obtain functional volumes with similar volume TR around 3 seconds and a voxel size of 1.1 mm isotropic to enable comparison. TE: echo time, FA: flip angle
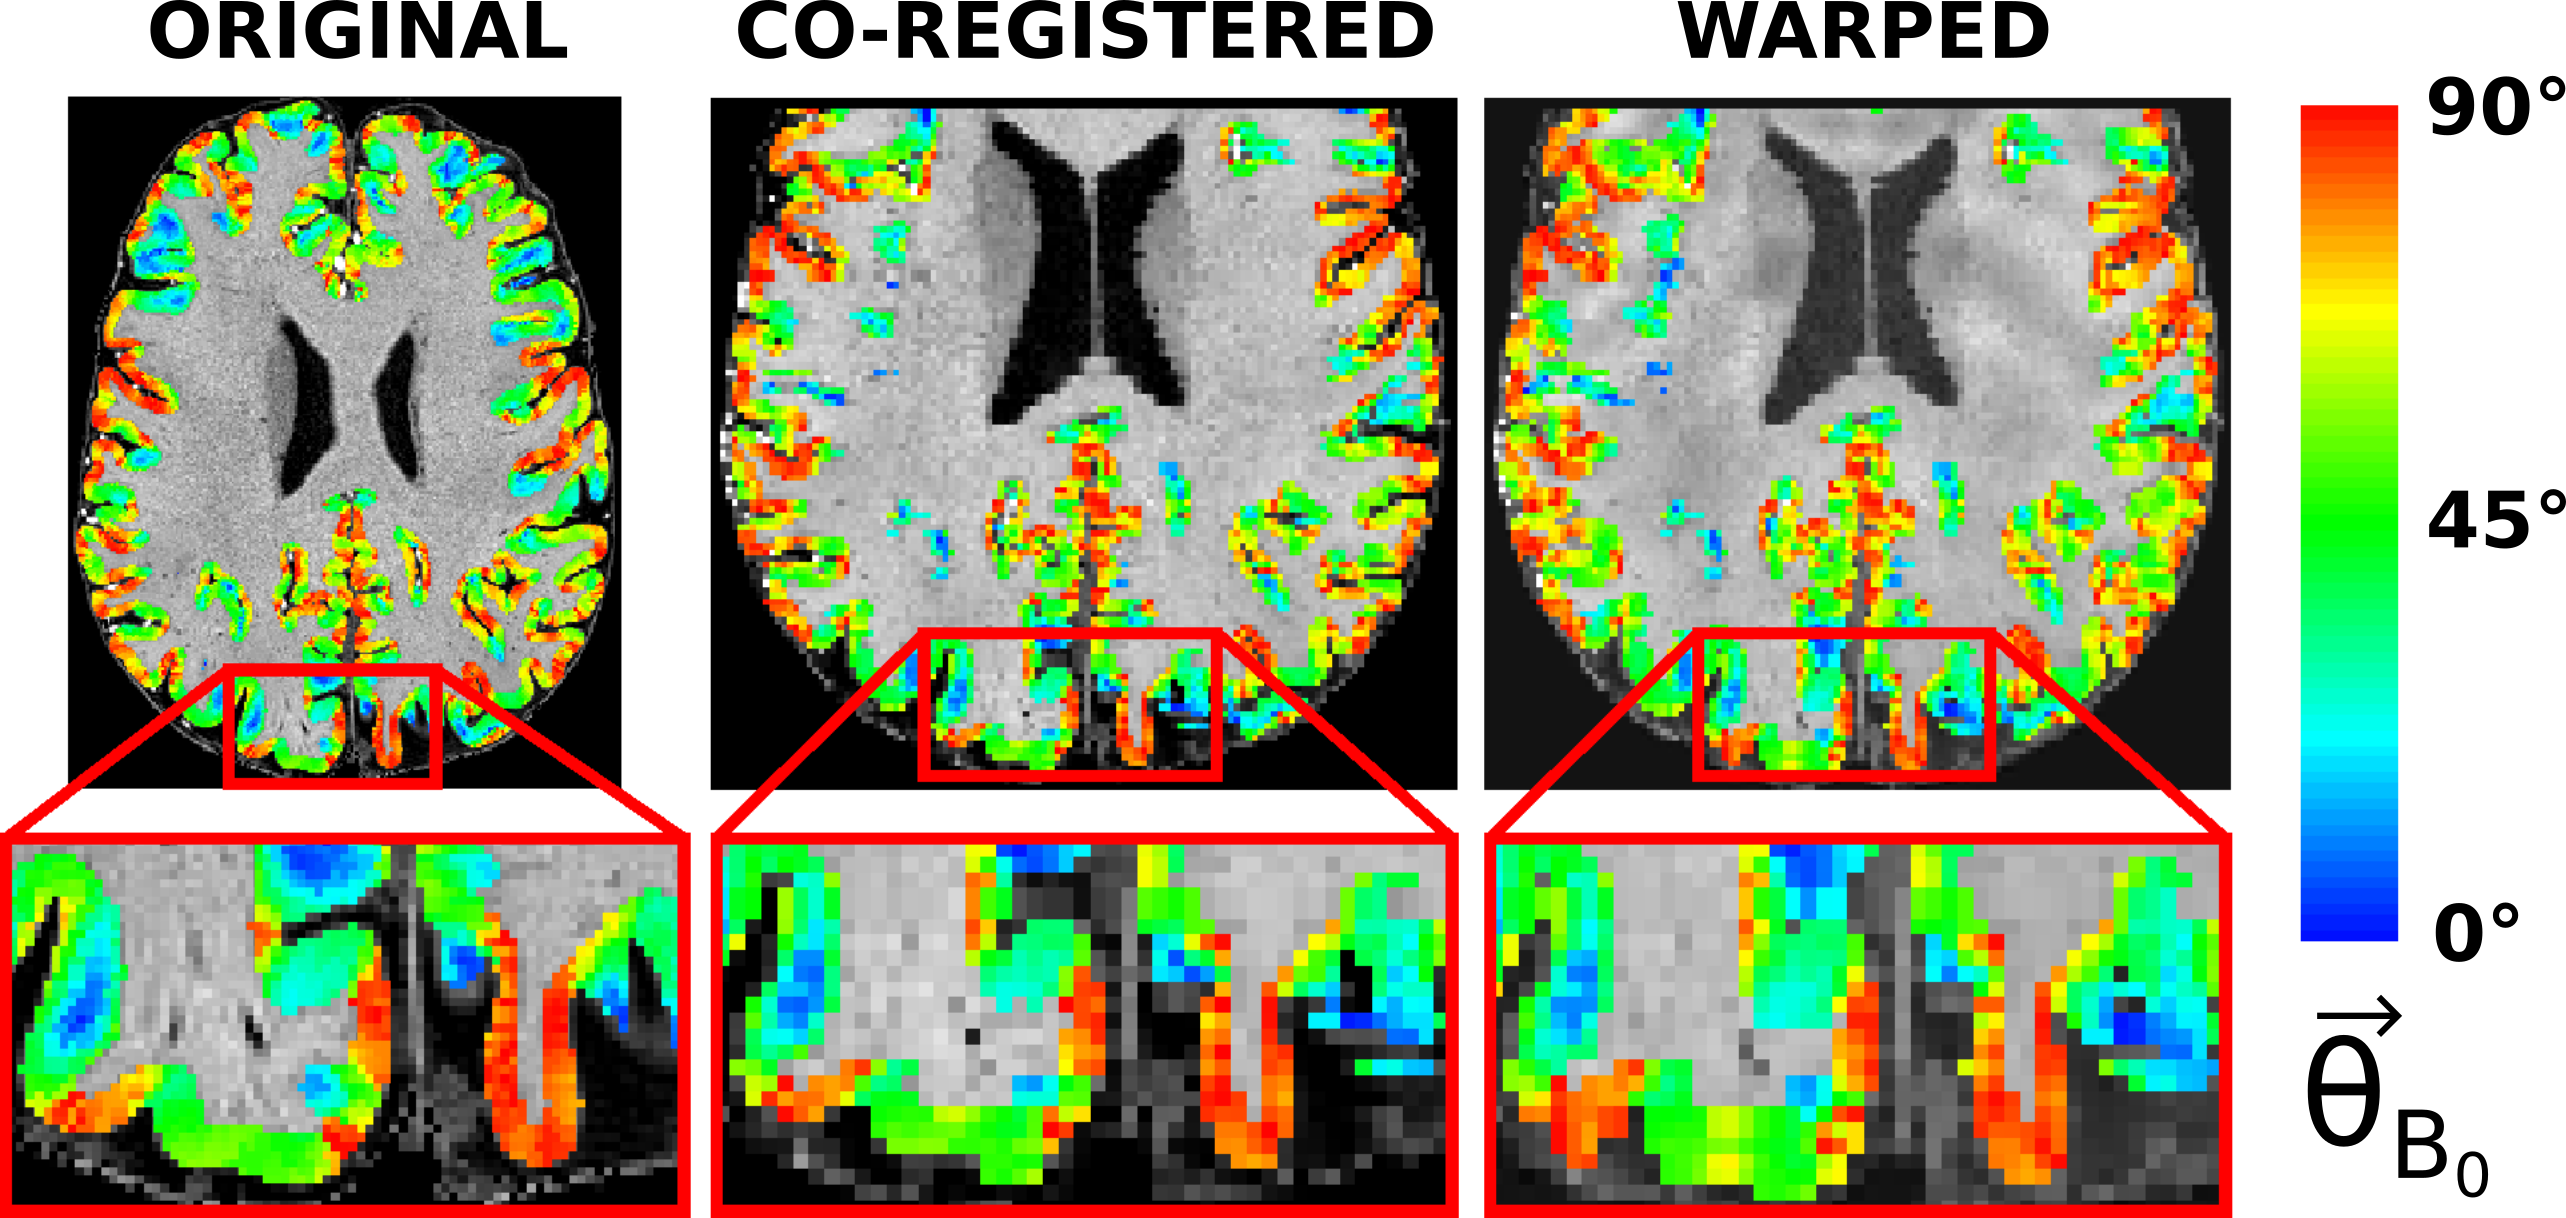
Figure 2: The angle between the surface normal of the cortex and $$$\overrightarrow{B_0}(\theta_{B_0})$$$ shown on top of the original anatomical MPRAGE image (left), on the co-registered anatomical image to the unwarped EPI (middle) and on the warped anatomical image to the original EPI. The cortical orientation is wrapped to include values from $$$0^{\circ}$$$ to $$$90^{\circ}$$$ as the fluctuation of the fMRI signal is expected to show no dependence on the polarity of the surface normal.
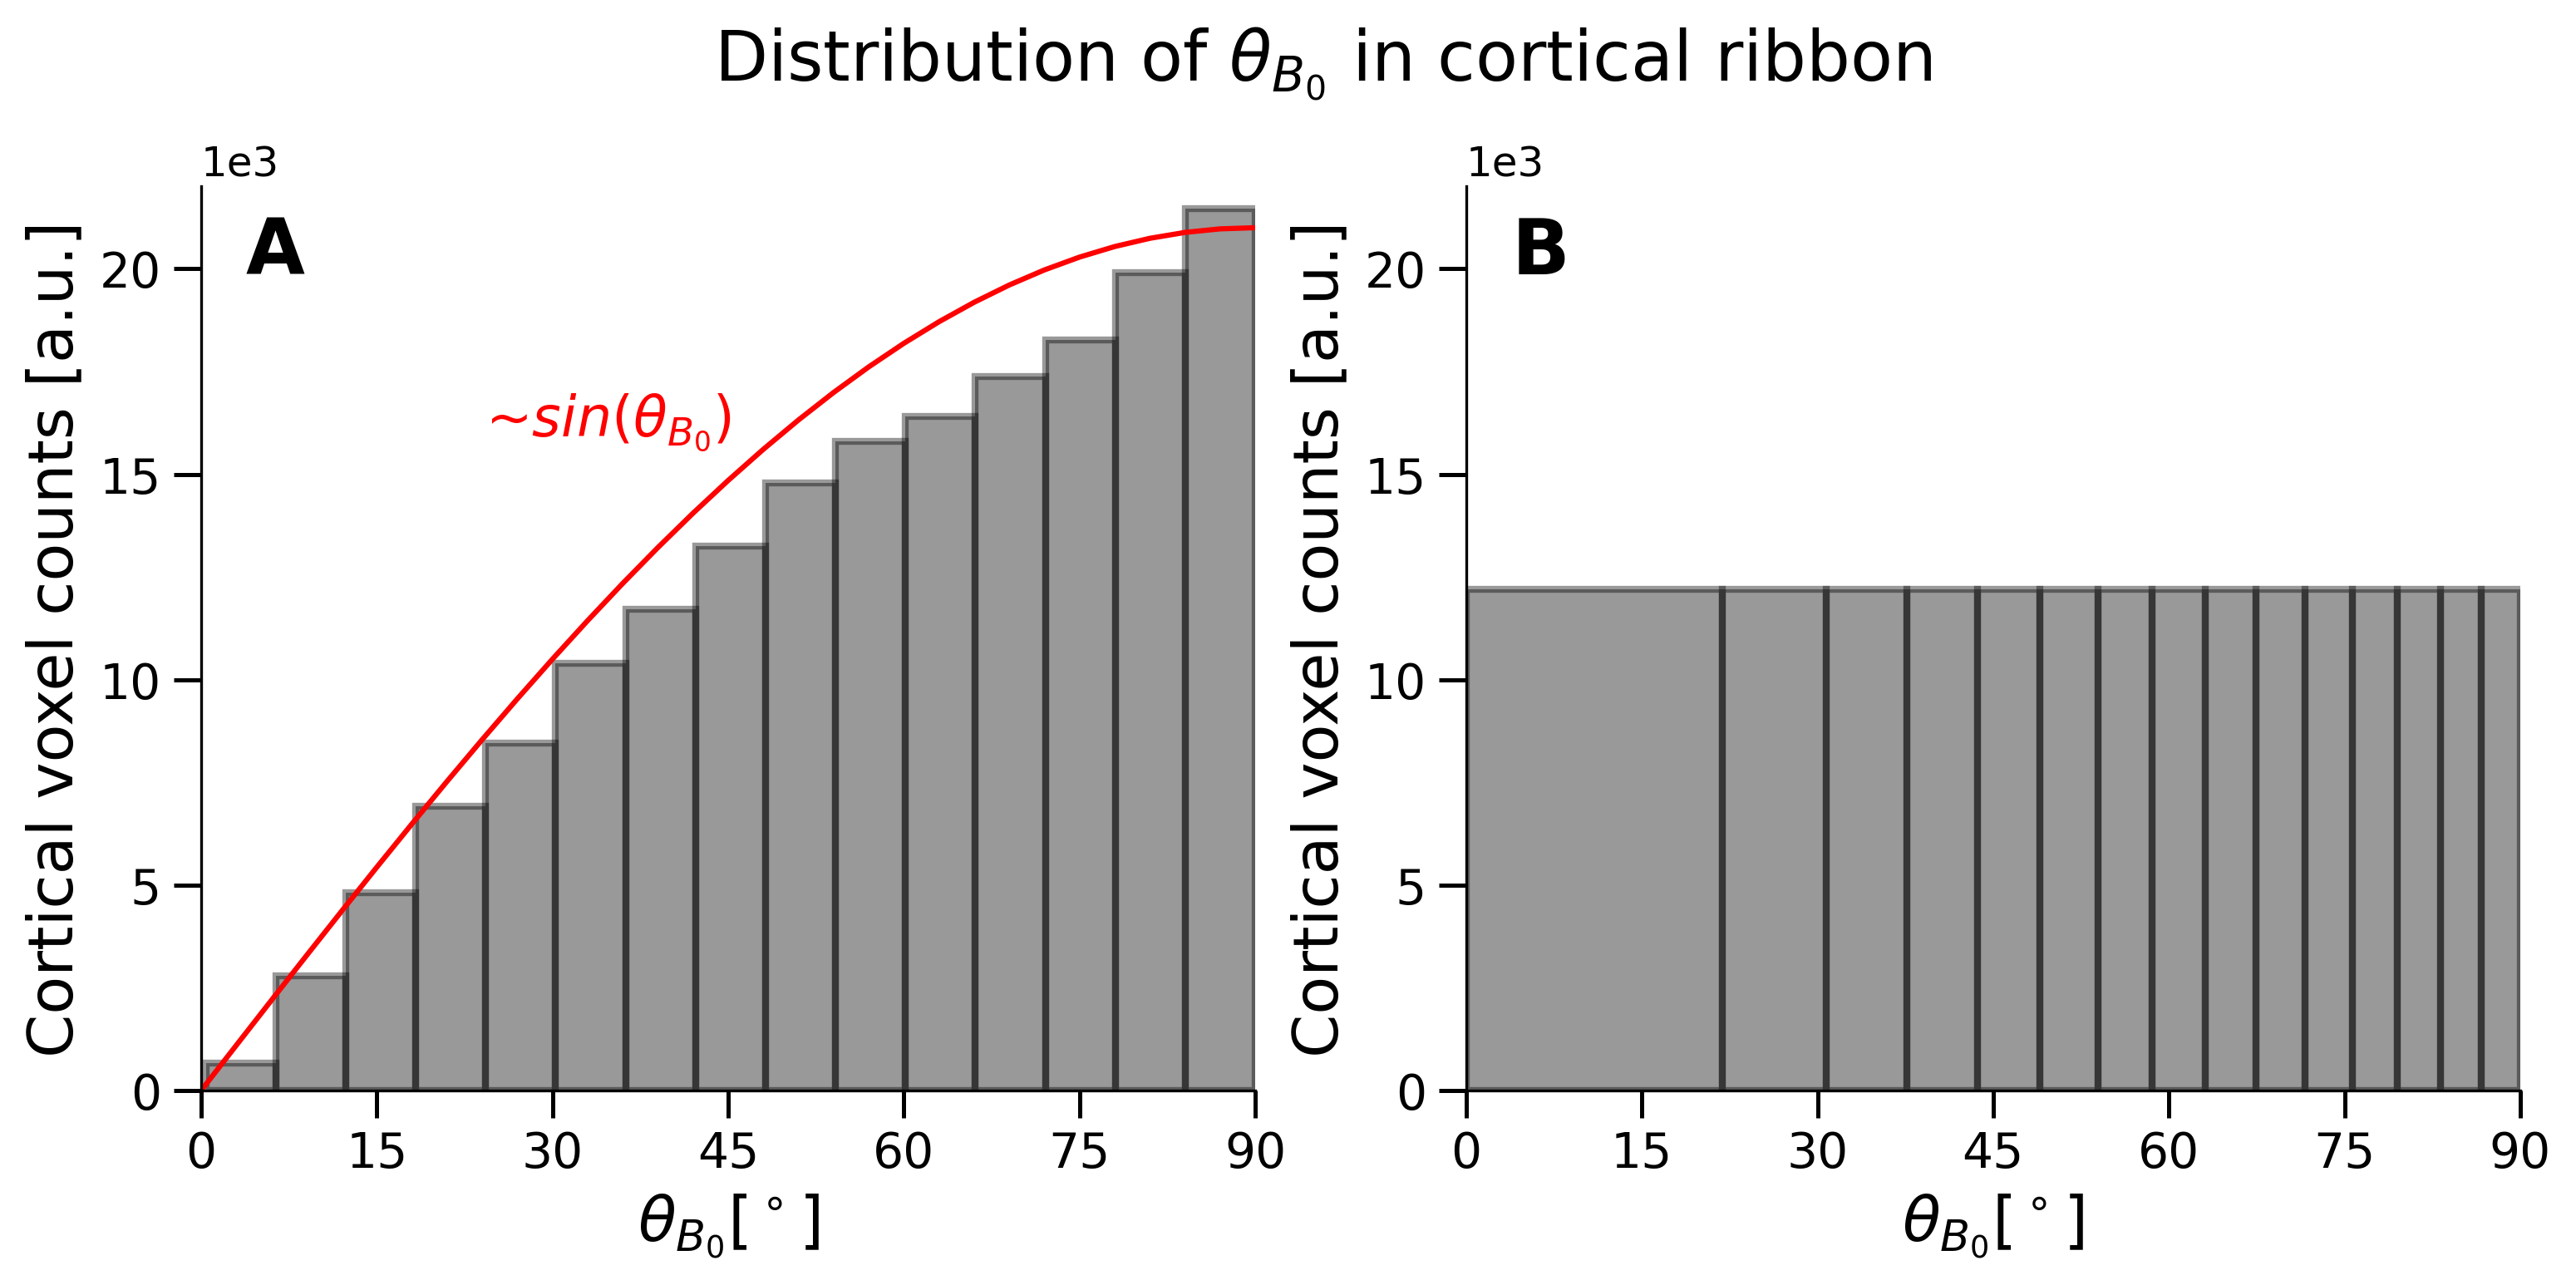
Figure 3: Exemplary distribution of $$$(\theta_{B_0})$$$ in the cortical ribbon co-registered and warped to the EPI image. The distribution in A shows a generic histogram, with a total number of 15 bins. It can be seen that the distribution is proportional to $$$sin(\theta_{B_0})$$$ shown in red. To remove any biases in the number of voxels while plotting (see Figure 4), bins containing the same number of voxels are calculated (B) using the same data. The same number of bins is shown in B as in A.
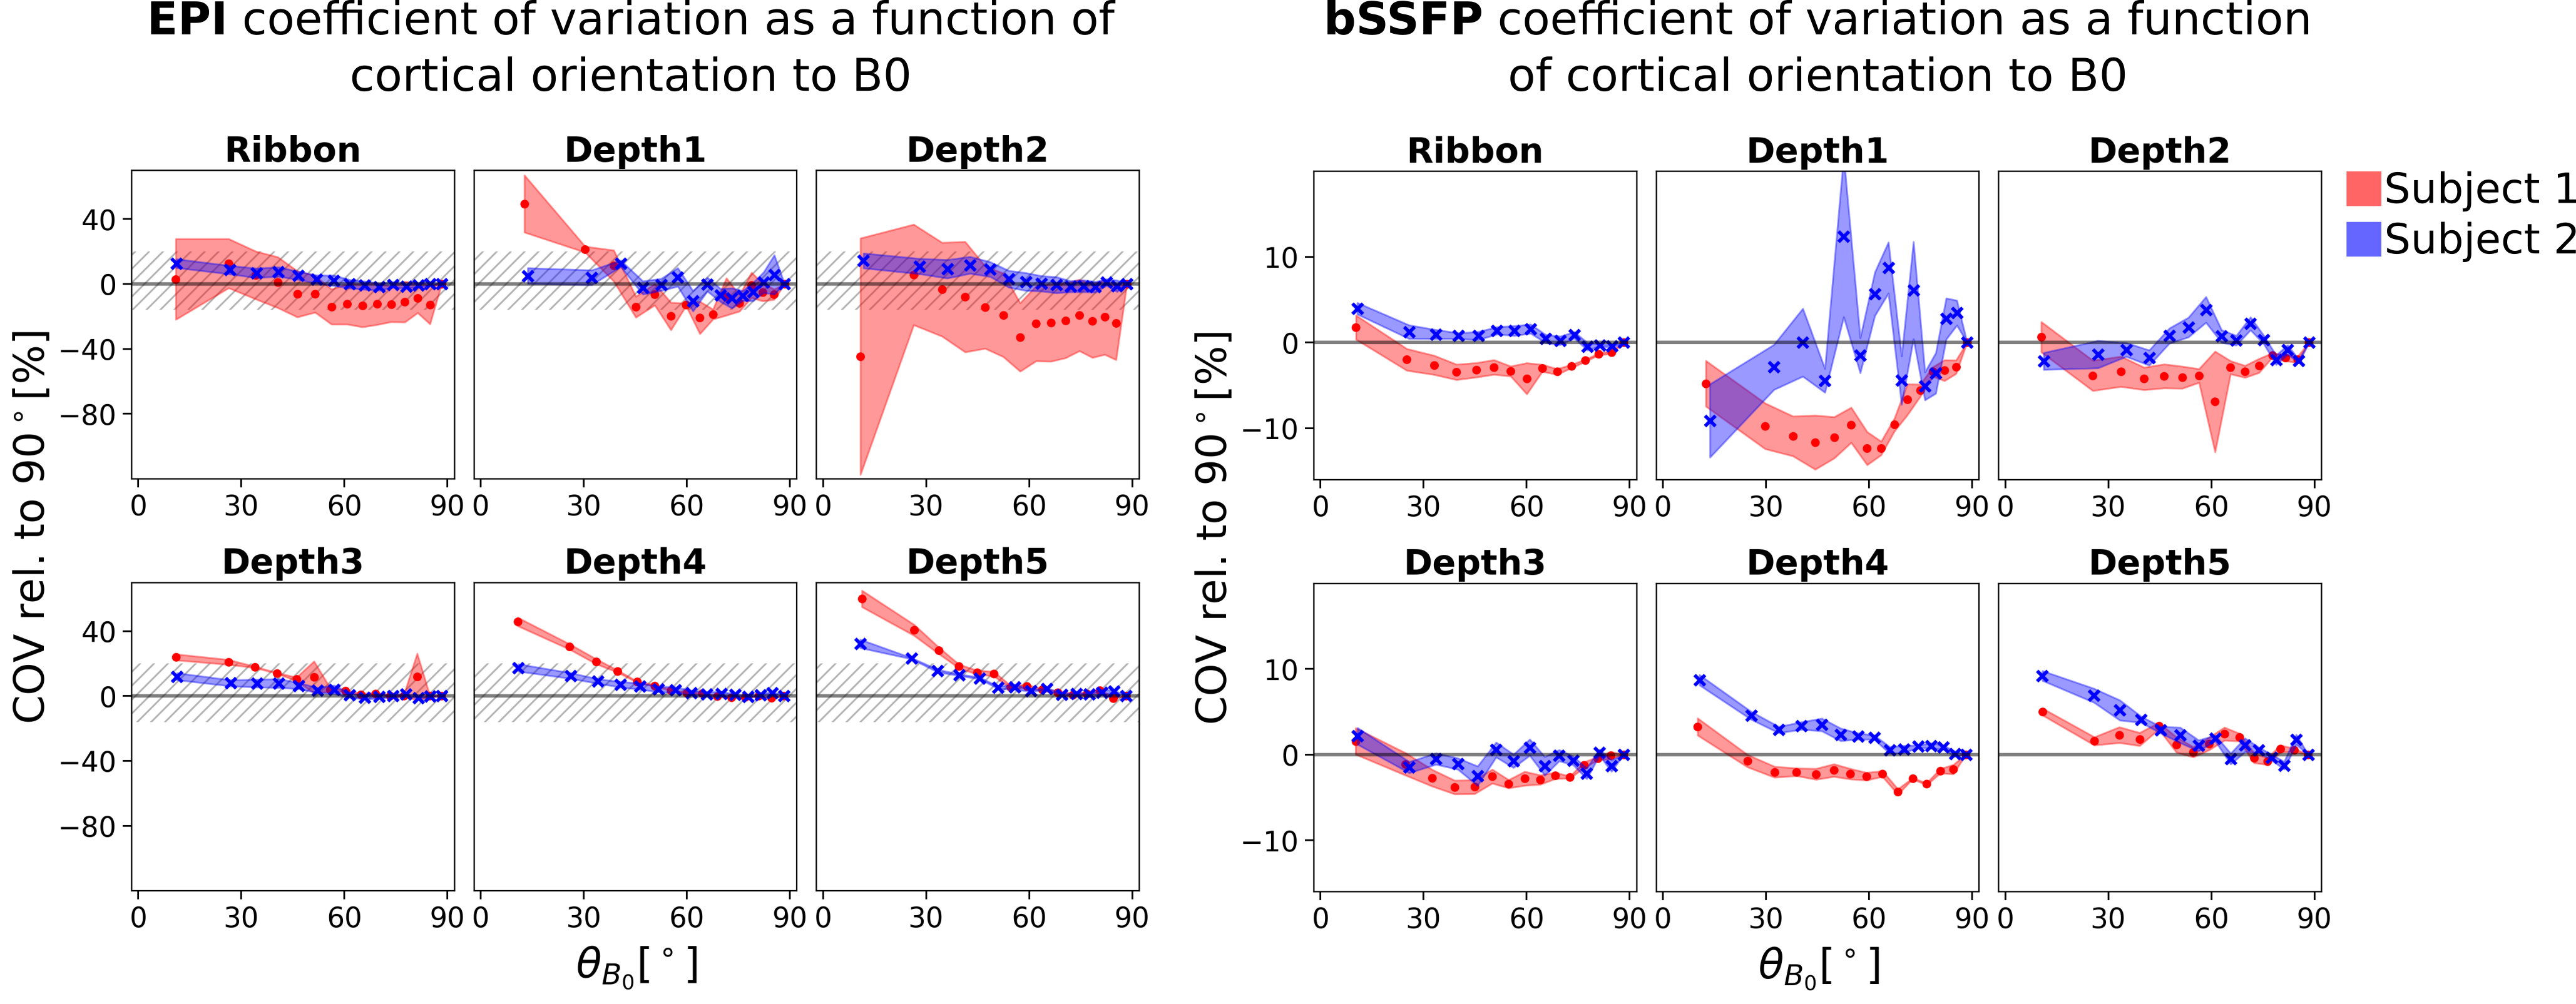
Figure 4: Coefficient of variation of the EPI (left) and bSSFP (right) resting-state signals normalized on $$$\theta_{B_0}=90^\circ$$$ as a function of cortical orientation to $$$\overrightarrow{B_0}$$$ in the whole cortical ribbon and in five equi-distant cortical depths. The dashed area in the EPI plots corresponds to the entire plotting area of the bSSFP plots. Depth1 is closest to CSF and contains 20% of the cortical thickness. Each cross in each plot includes the same number of voxels and is the mean of four runs. The shaded area shows the standard deviation over runs.
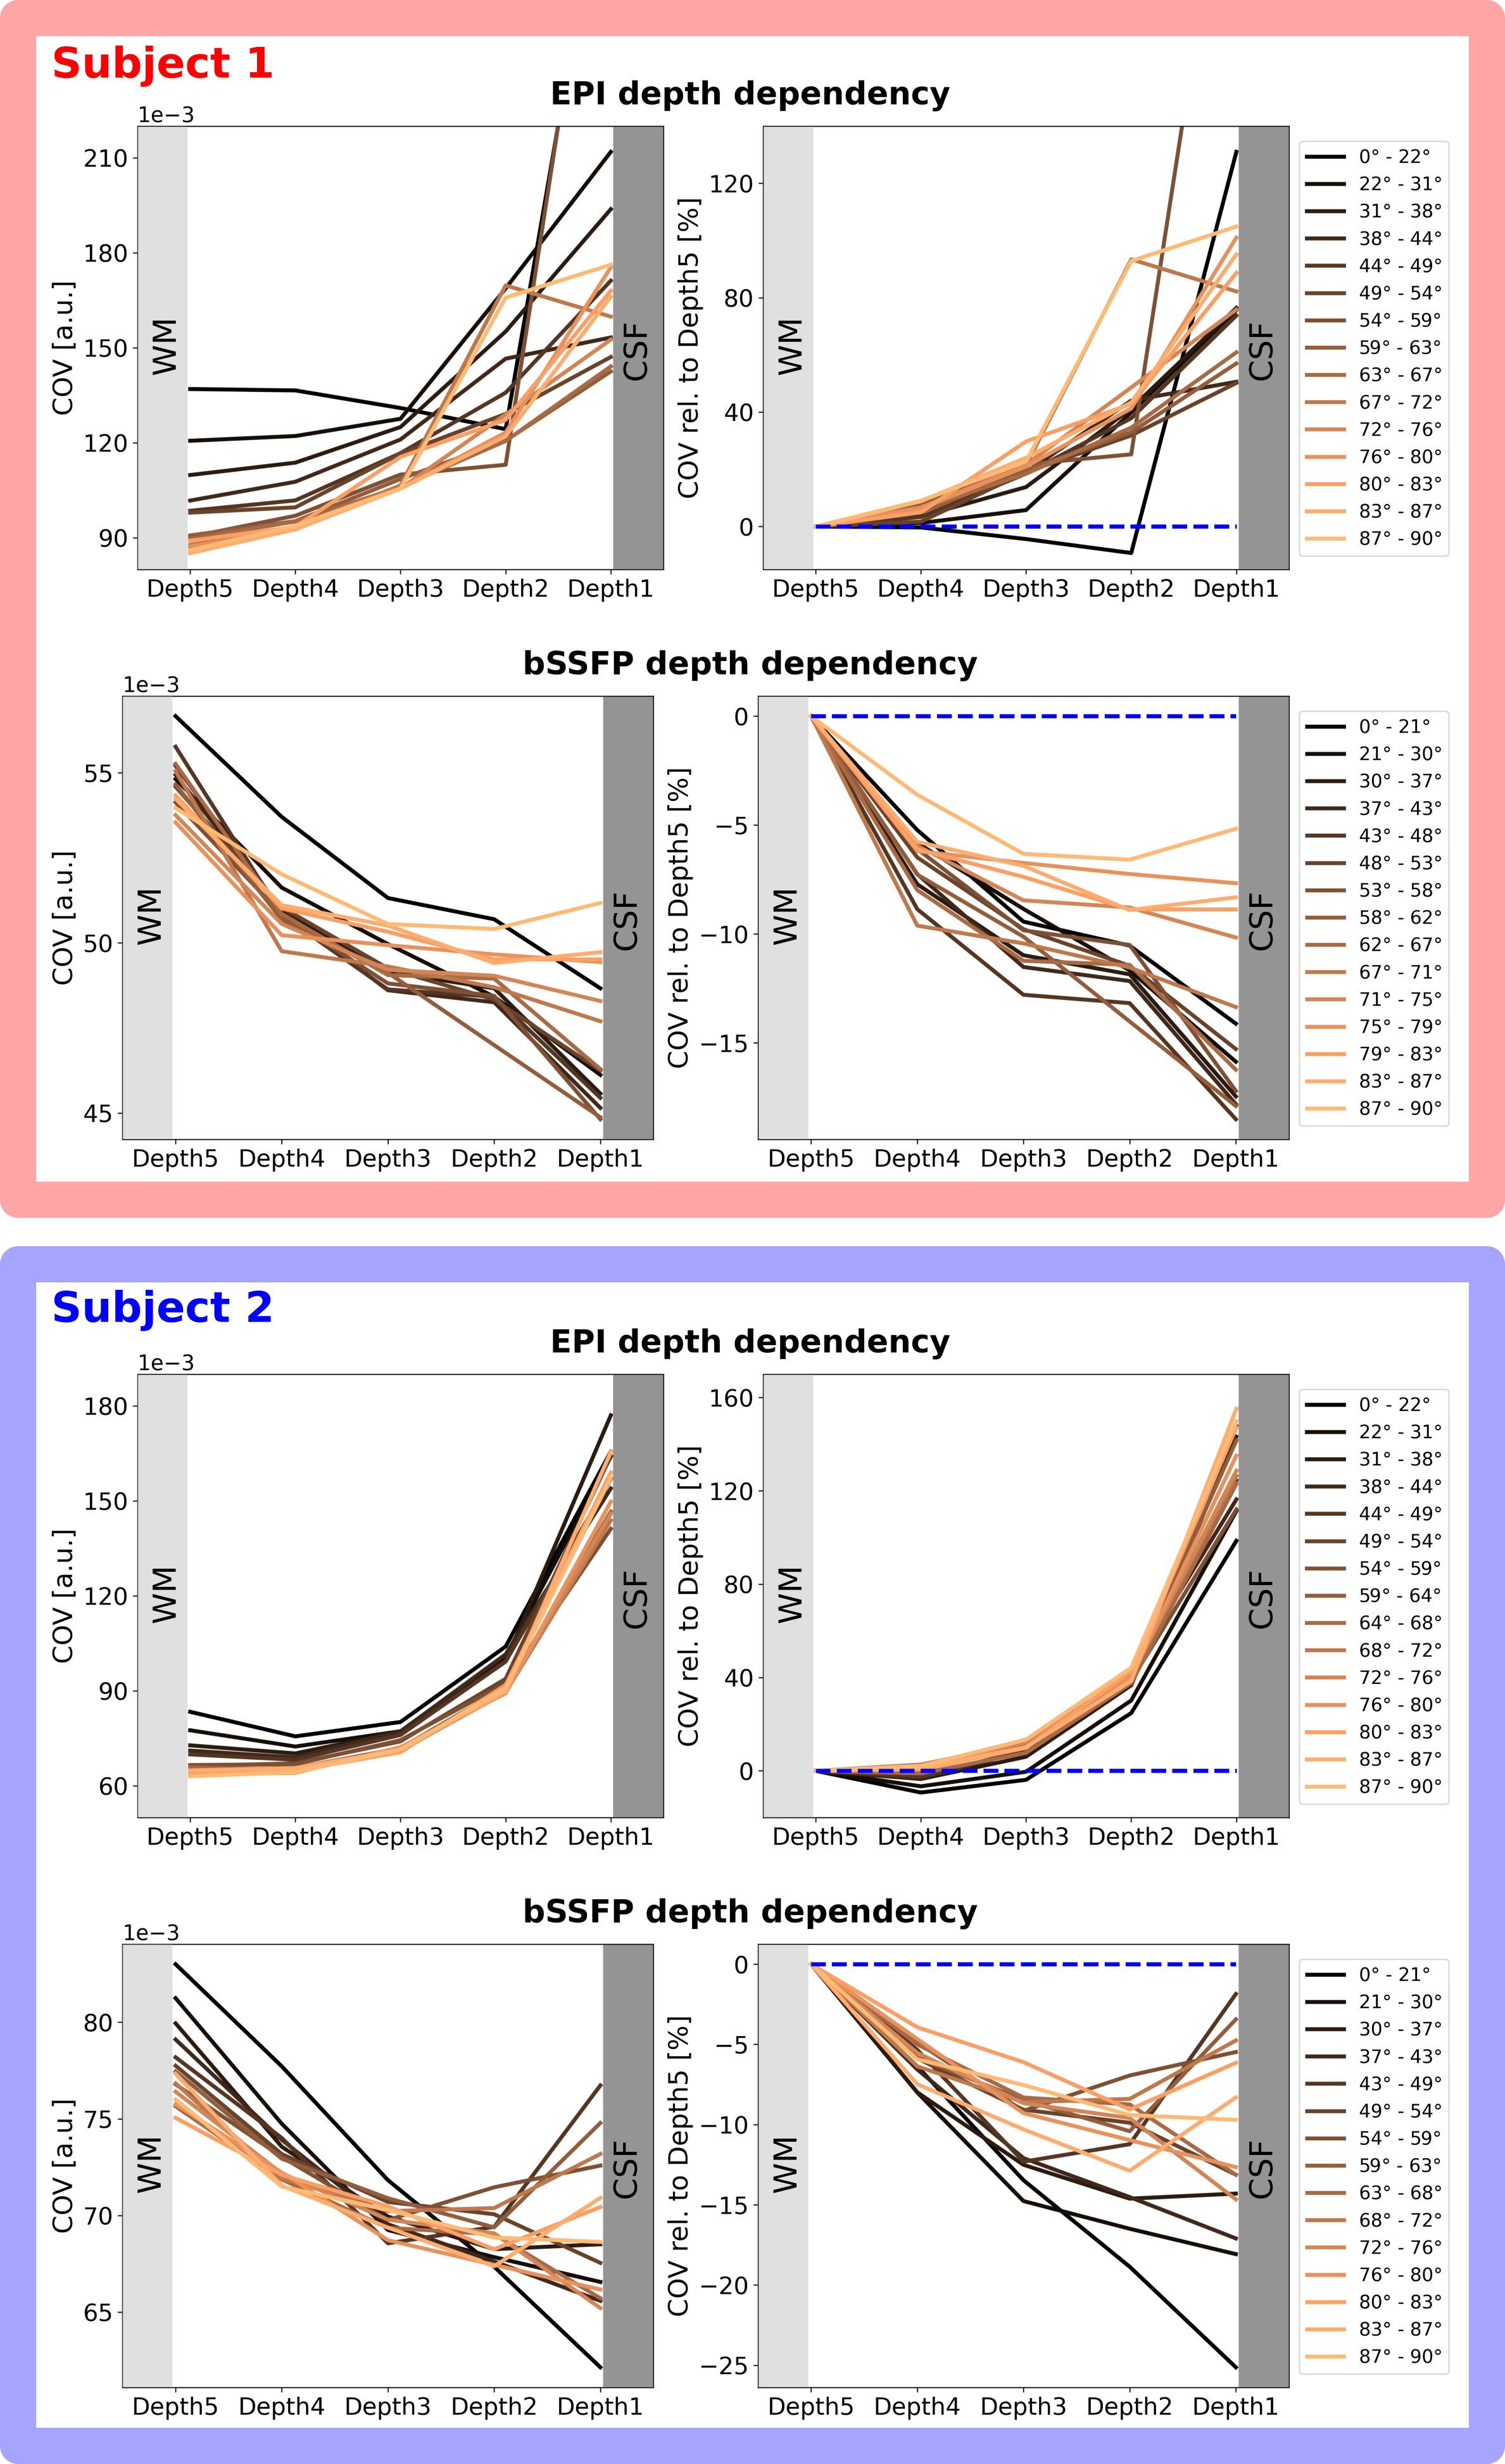
Figure 5: Cortical depth dependency of the COV for EPI (top) and the bSSFP (bottom) for subject 1 (red) and 2 (blue). The absolute values (left column) are higher for EPI than bSSFP. A clear decrease of the signal fluctuation for EPI is shown, while the reversed effect is observed for bSSFP with deeper depths. Normalized to Depth5 closest to WM (right column), lower $$$\theta_{B_0}$$$ (black) for bSSFP, but higher $$$\theta_{B_0}$$$ (light orange) for EPI, exhibit strongest depth dependence. The blue dashed line shows Depth5 at 0%.
DOI: https://doi.org/10.58530/2023/3665