3664
Ocular Dominance Columns Examined using BOLD fMRI with Phase Regression at 7 T1Centre for Functional and Metabolic Mapping, Robarts Research Institute, London, ON, Canada, 2Medical Biophysics, The University of Western Ontario, London, ON, Canada
Synopsis
Keywords: fMRI (task based), High-Field MRI, Phase Regression
We investigated the signal spatial specificity of the GRE-BOLD contrast with and without phase regression in ocular dominance columns and layers of human V1. Phase regression is a post-processing technique that uses phase data to suppress the large vein signal, thus improving the GRE signal spatial specificity. Our results showed that the phase regressed laminar BOLD signal profile peaks towards the middle cortical depth, while that of GRE-BOLD was biased towards the cortical surface. Phase regression did not improve the contrast between columns, suggesting that the phase is not sensitive to intracortical veins running parallel to the cortical surface.Introduction
Ocular dominance columns (ODCs) are a fine-scale cortical structure located within the primary visual cortex (V1) and are predominantly sensitive to input from a specific eye1. Exclusive monocular input in ODCs is specific to cortical layer 4C, while at layers above and below they will have varying amounts of signal exchange between eyes1. The most common MR sequence used in laminar fMRI studies is gradient-echo blood-oxygenation-level-dependent (GRE-BOLD) due to its speed of acquisition, high SNR, minimal constraints with the specific absorption rate, and overall robustness2. However, the GRE-BOLD signal is skewed towards the location of veins at the cortical surface3, making an accurate interpretation of the laminar analysis challenging4.Phase regression is a proposed post-processing technique to suppress the signal from large veins5. As the phase data mainly reflects the BOLD signal changes around large veins, it can be used as a filter to remove the unwanted venous bias5. This technique helps provide GRE-BOLD with increased spatial specificity, making it a better suited method for laminar and columnar studies.
Methods
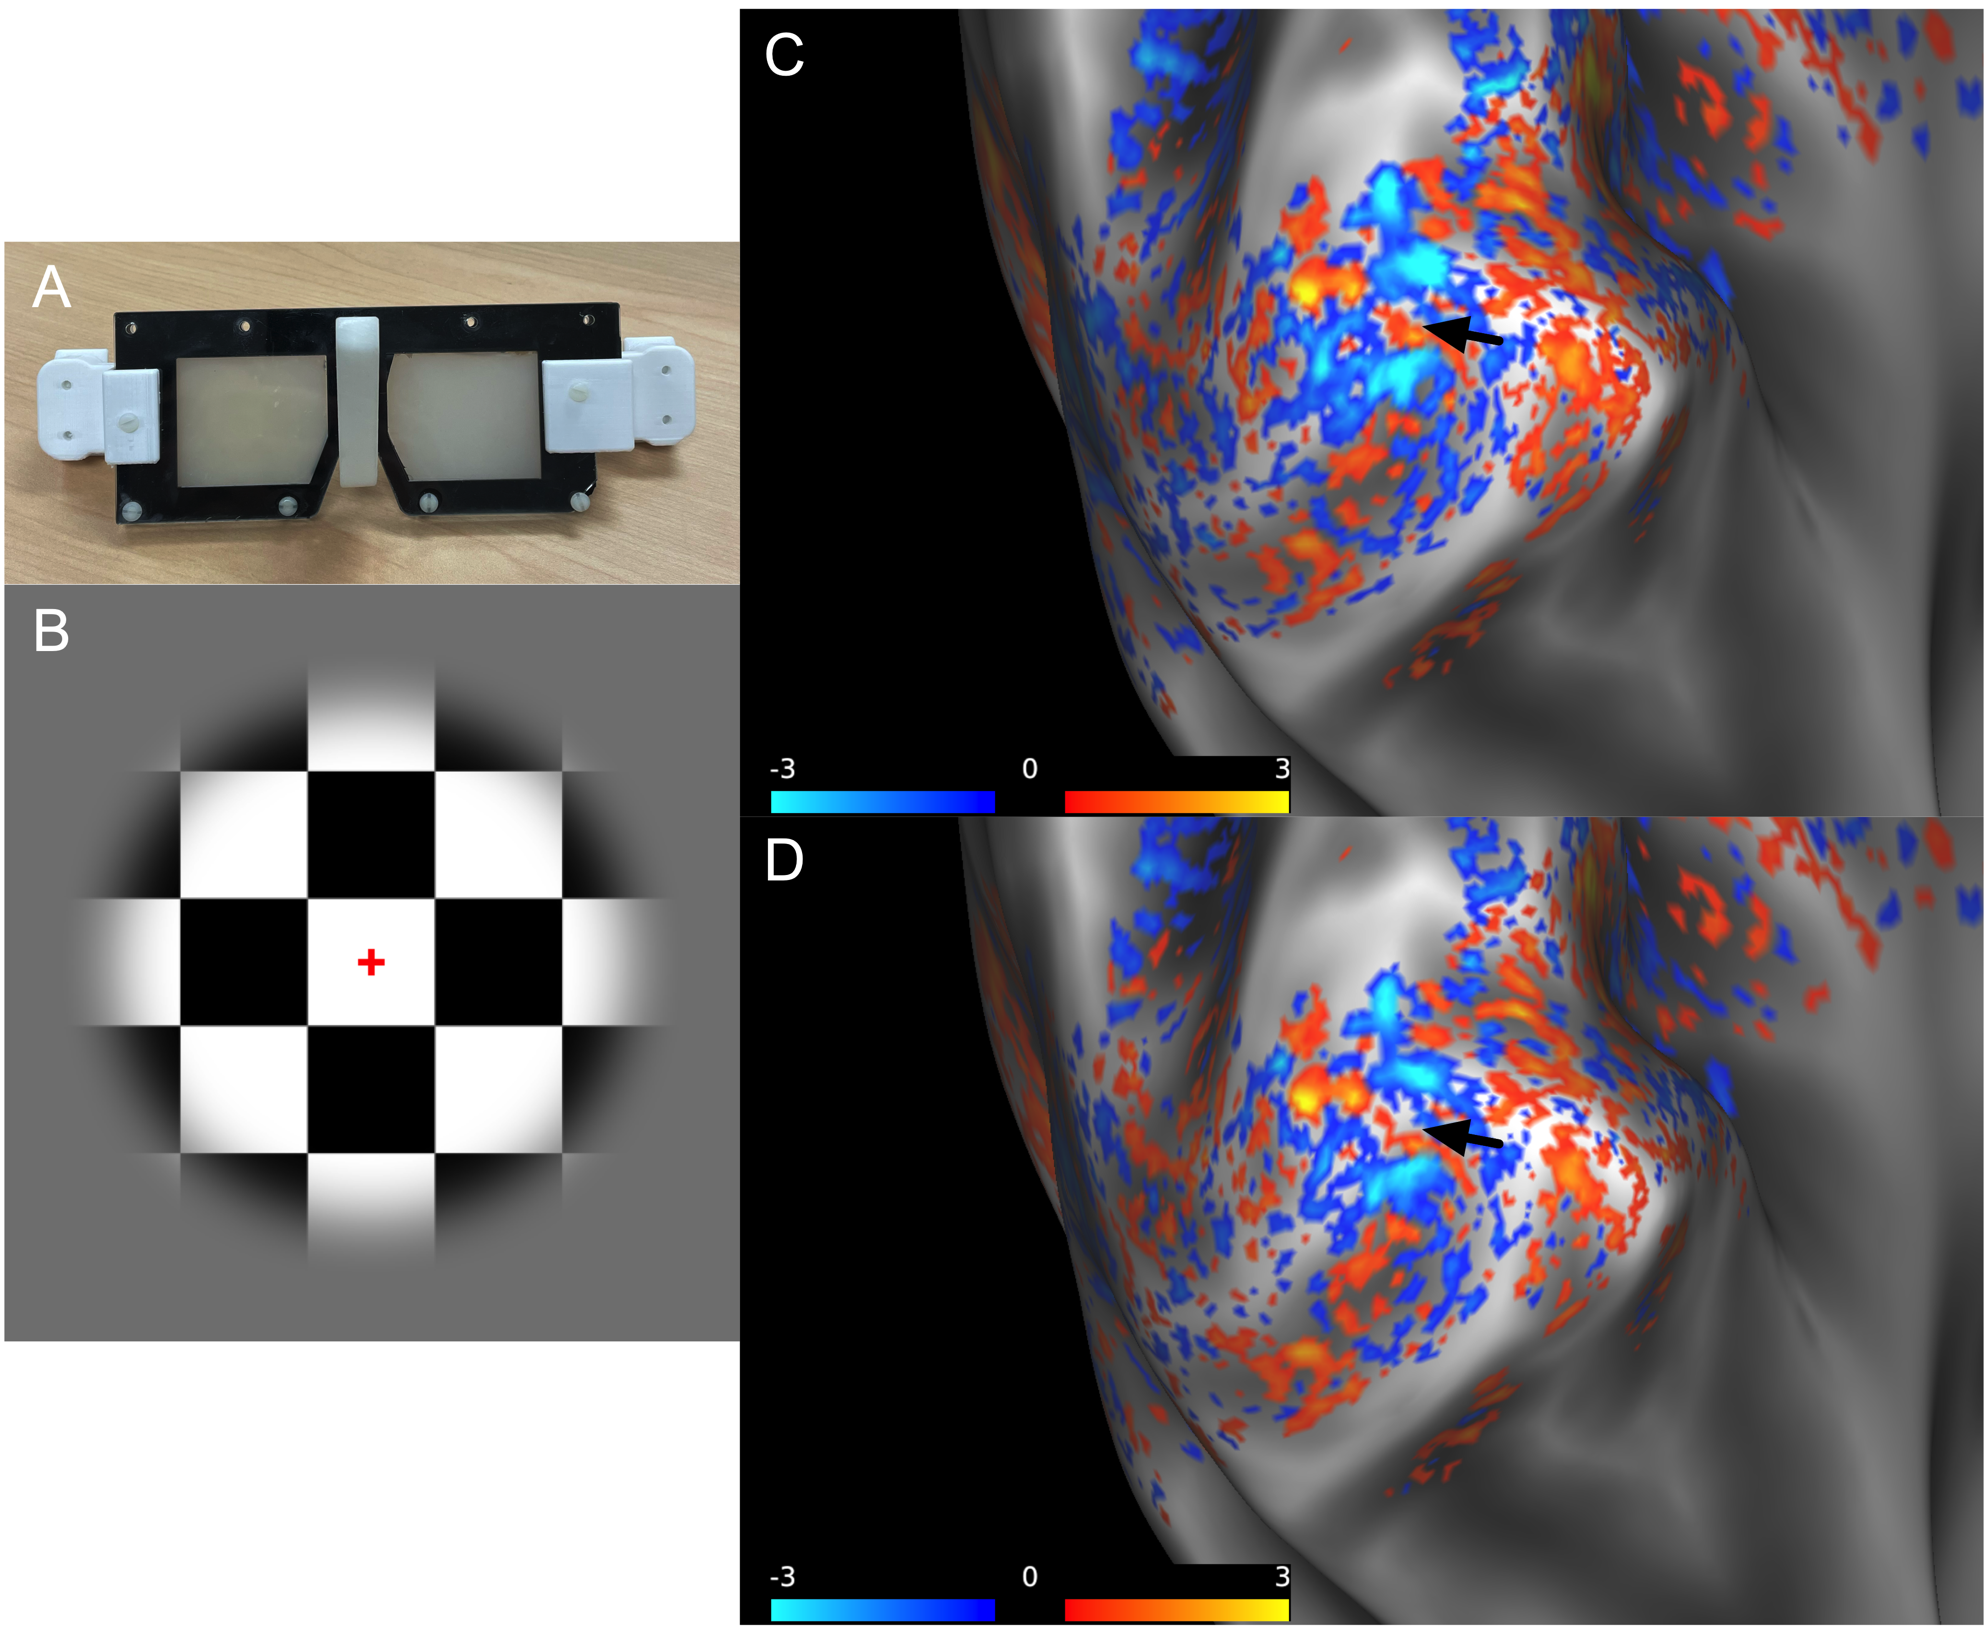
Data from five participants (3 females and 2 males; age range 22-35 years) was collected after ensuring normal or borderline normal stereovision. MP2RAGE data at 0.75 mm isotropic resolution and two sessions of GE-EPI data at 0.8 mm isotropic resolution were collected at 7 T using a phase sensitive coil combination6. The first functional session was for retinotopy and consisted of meridian mapping to localize V1 using a stimulus of vertical and horizontal bowties (data not shown). The second functional session was to image ODCs using a 10 Hz contrast reversing checkerboard paired with goggles modified from PLATO’s Visual Occlusion Spectacles with lenses that can rapidly change from transparent to light scattering independently. Five functional runs, each 600 volumes, were acquired at each imaging session with the following parameters: TR/TE = 1000/23.8 ms, GRAPPA factor of 3, partial Fourier 6/8, and 28 slices positioned parallel to the calcarine sulcus.The functional data was run through a custom preprocessing and phase regression pipeline modified from Stanley et al7. The magnitude and phase data were motion corrected, and the phase data was unwrapped while the magnitude data was thermally denoised8. Low frequency drifts were removed by detrending the magnitude and phase data to allow for more accurate fitting between magnitude and phase data. In phase regression, the fit of the phase time course to the magnitude time course gives an estimate of the venous BOLD signal contribution, and the fitted phase is subtracted from the native magnitude to produce phase regressed data more specific to the microvasculature.
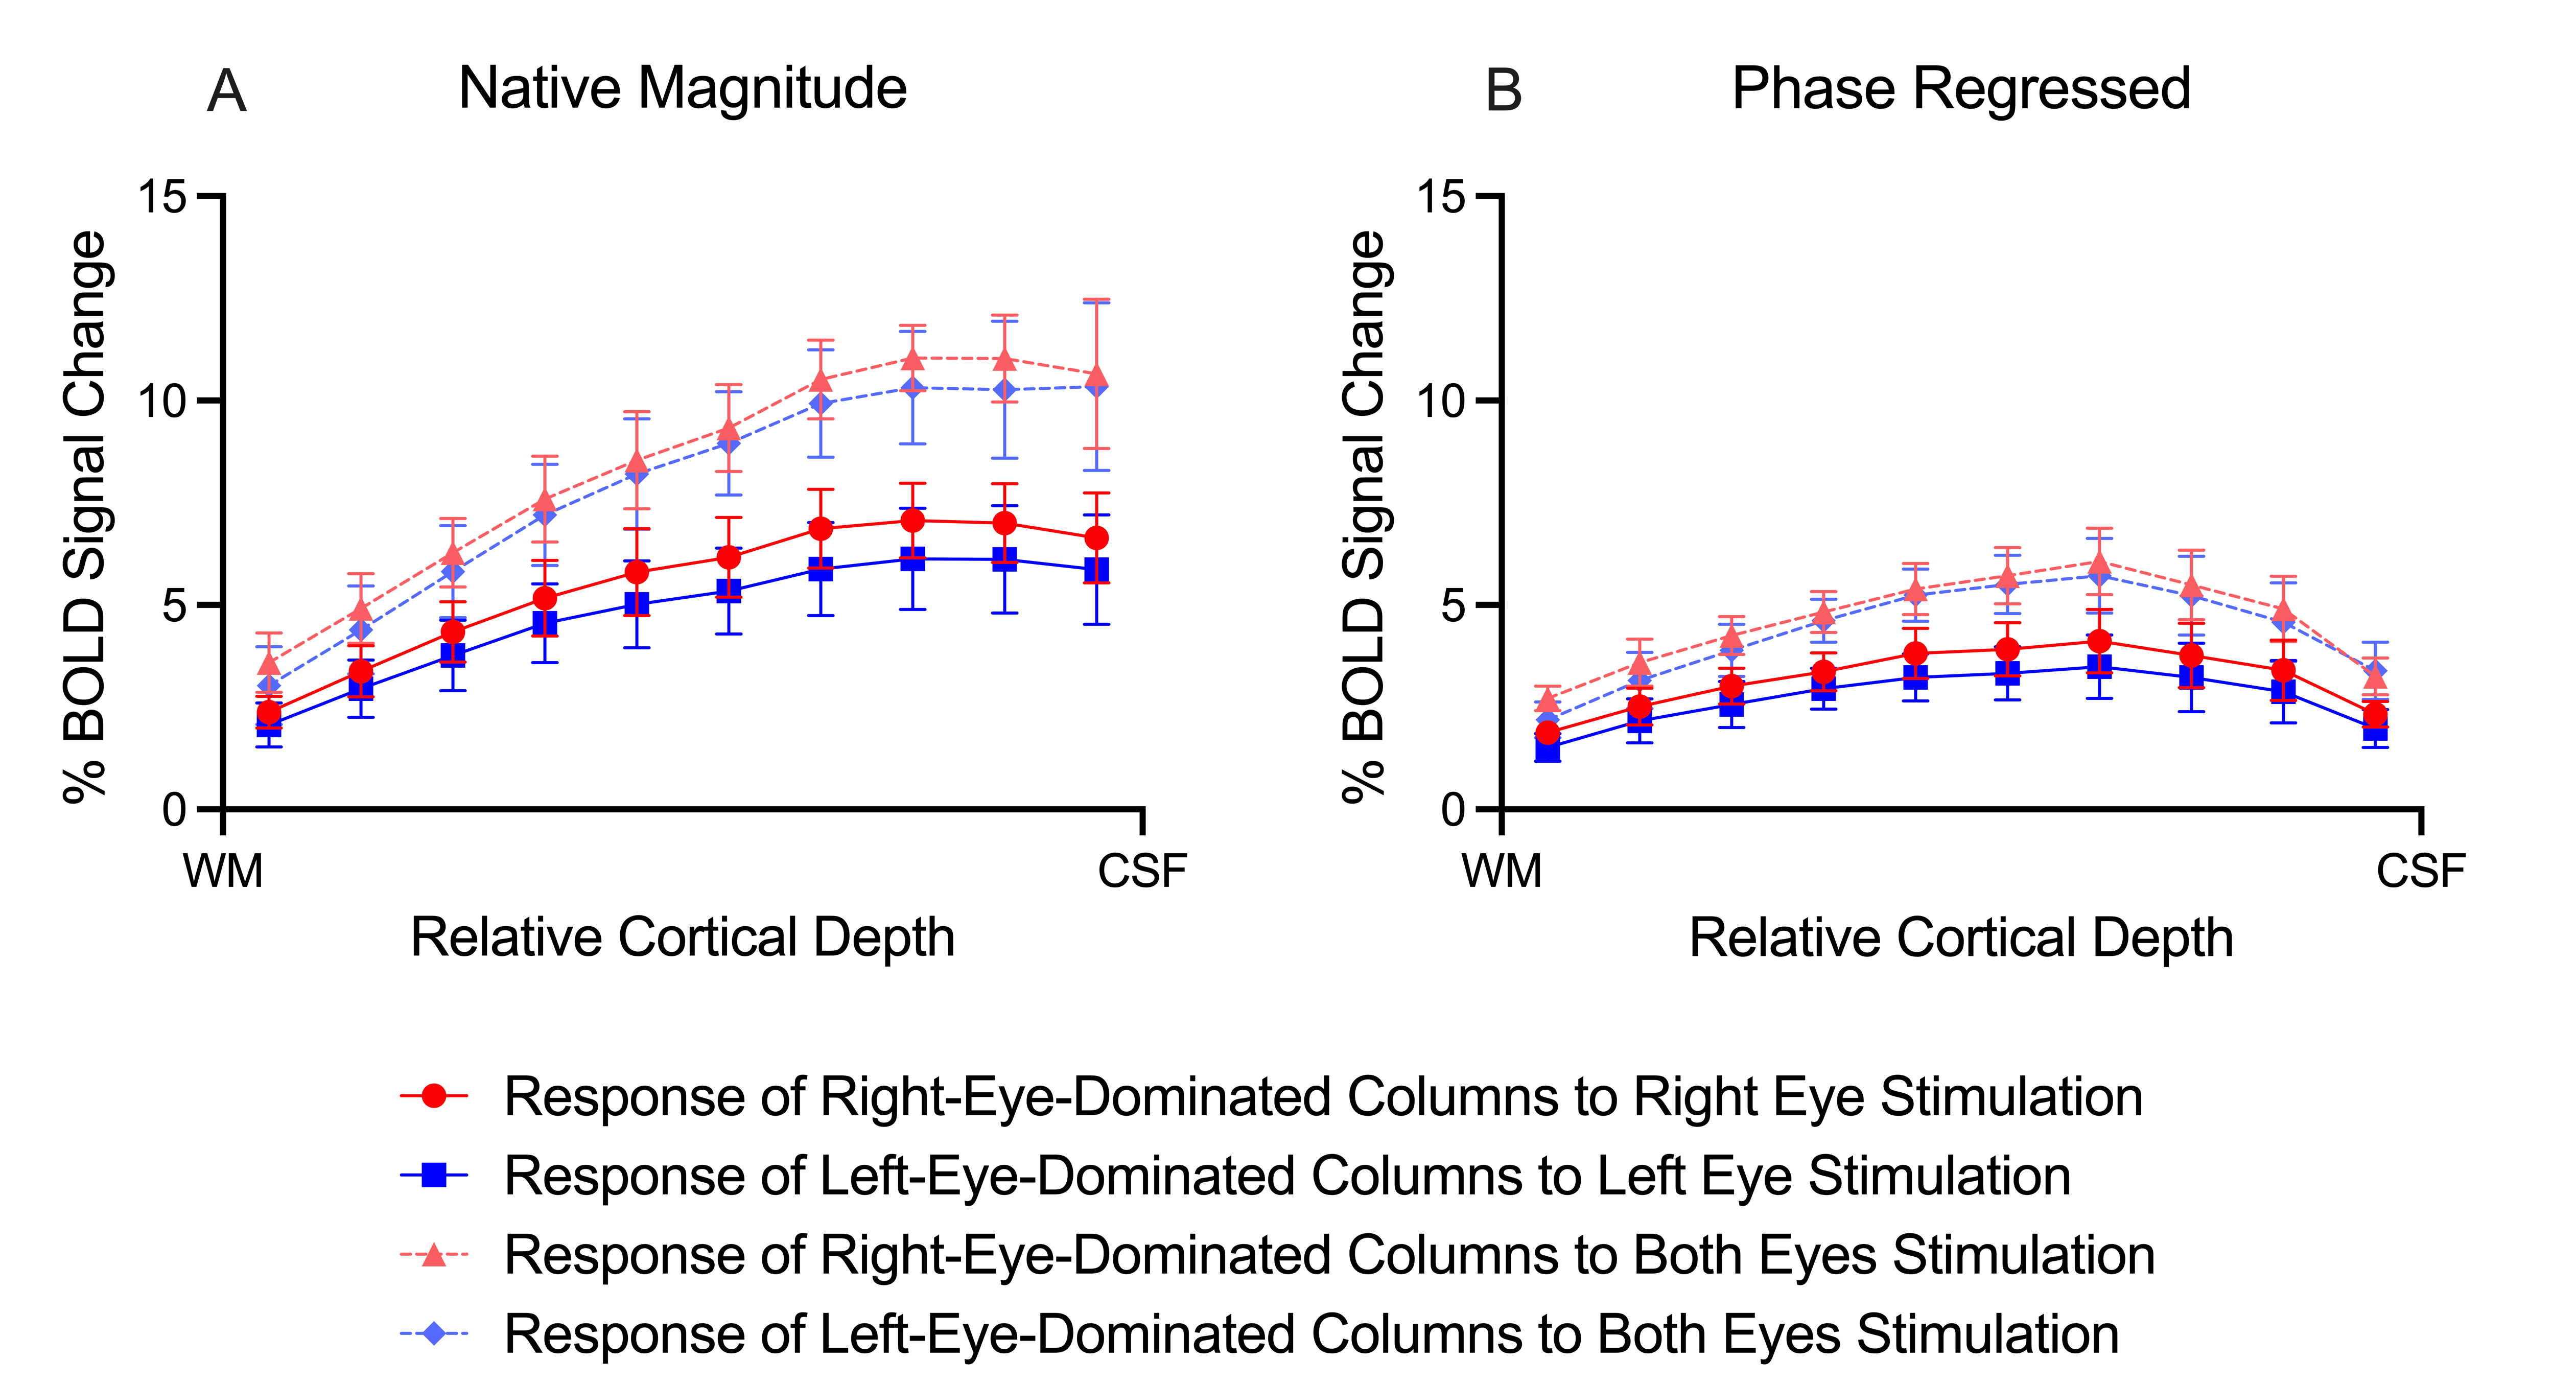
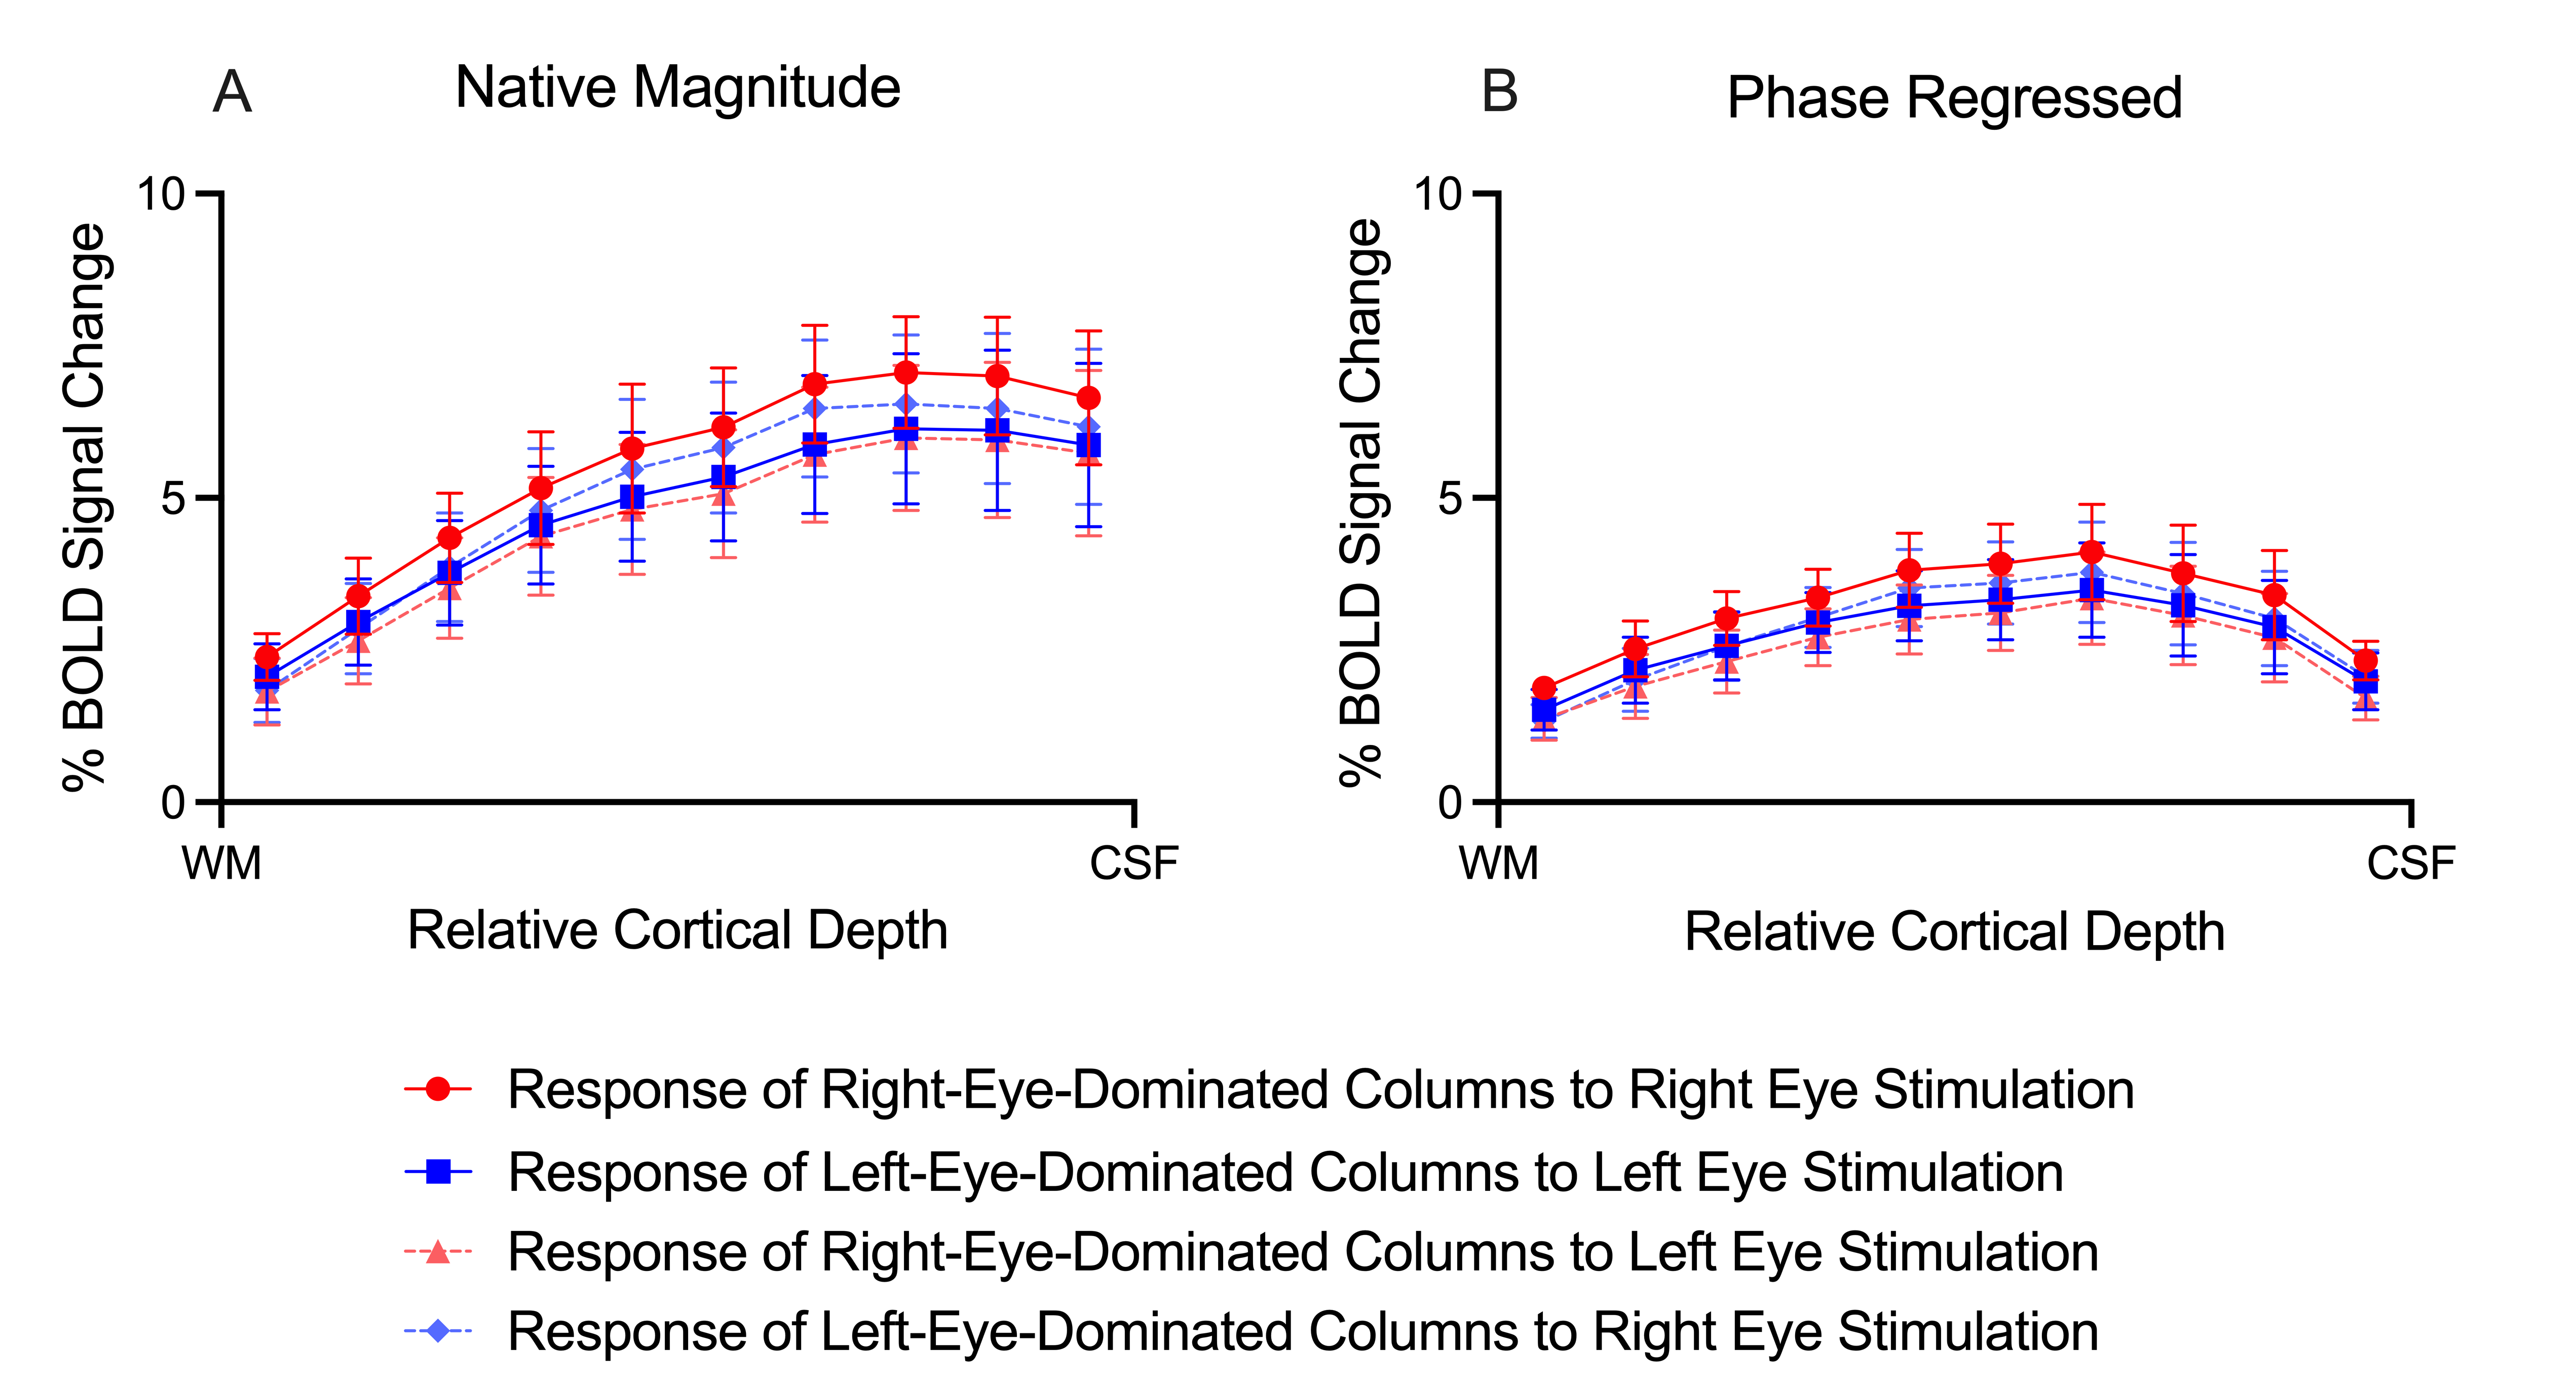
The meridian mapping was used to define the V1 boundaries to assist with ROI delineation. Laminar profiles were generated from ten cortical depths using LayNii (LN2_LAYERS)9. To compare ODCs across cortical depths, right- and left-eye-dominated columns were created by thresholding the Right > Baseline and Left > Baseline t-maps greater than 2.3, respectively.
Results
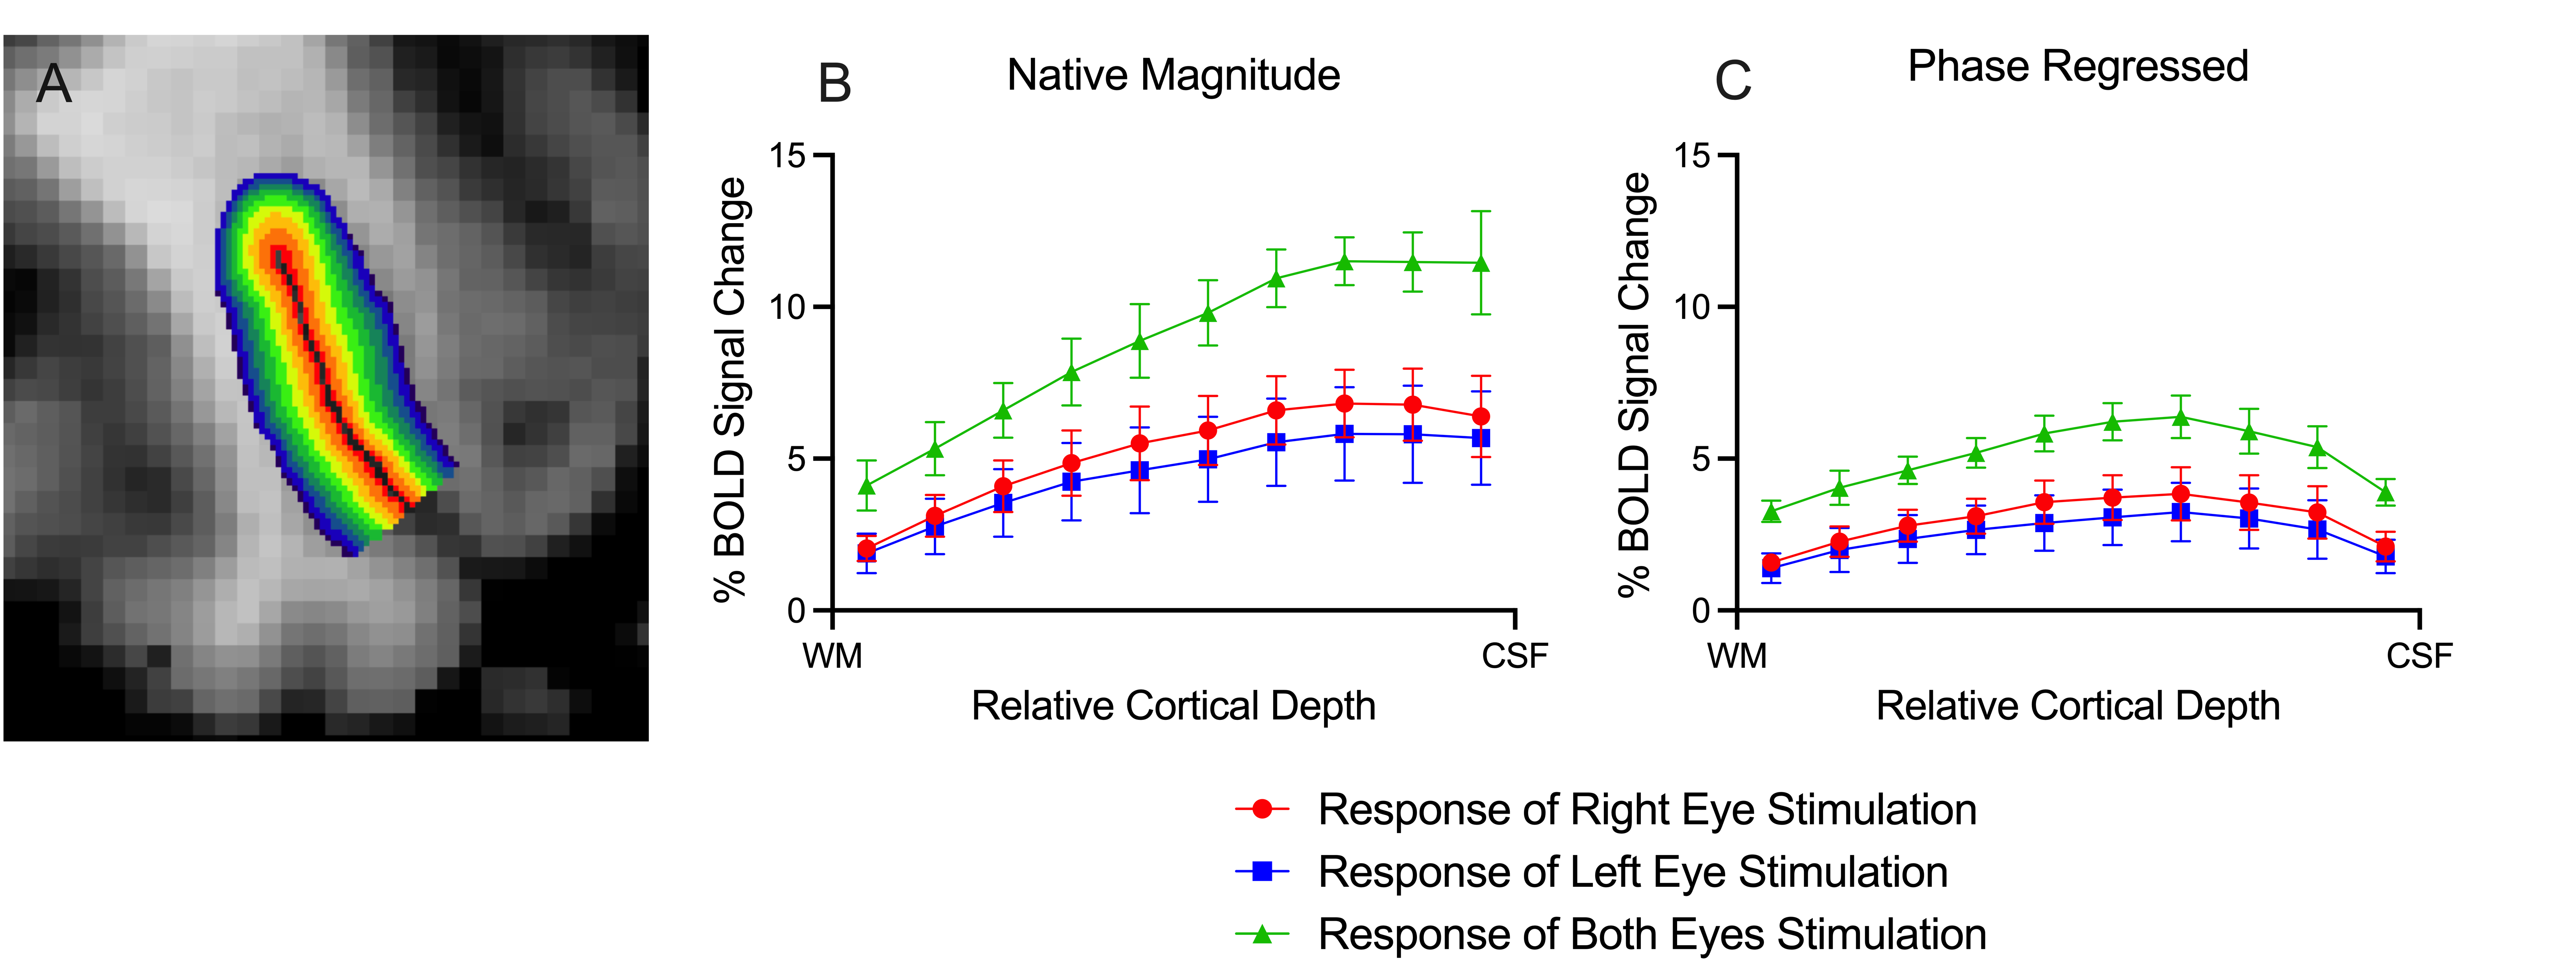
ODCs were displayed using the Right - Left contrast on an inflated surface in Figure 1. The laminar BOLD signal profile of the native magnitude increased towards the cortical surface while the phase regressed profile peaked towards the middle of the cortex, as shown in Figure 2. Monocular stimulation of ODCs was compared across cortical depths to both binocular stimulation and monocular stimulation from the opposing eye in Figure 3 and Figure 4, respectively.Discussion
In this work, we investigated the signal spatial specificity of the GRE BOLD contrast with and without phase regression on the scale of cortical layers and columns of the human V1. Phase regression was able to suppress the BOLD signal around veins10 making activation in ODCs more spatially specific. The phase regressed laminar BOLD signal profile peaked towards the middle cortical depth as expected, while the laminar GRE-BOLD response was biased towards the cortical surface11. However, the peak appears to be located closer to superficial than middle layers, meaning that the suppression is most proficient with pial veins and the largest/most superficial intracortical veins.When examining ODCs across cortical depths, binocular stimulation produced nearly twice the percent signal change as monocular stimulation within specific eye-dominated columns. And surprisingly, the percent signal change in ODCs with the corresponding and opposing monocular stimulation are nearly identical. This shows that there is a significant amount of overlap between the right- and left-eye-dominated columns defined from the t-maps, and why the contribution from both eyes would create the stronger binocular stimulation.
Conclusion
GRE-BOLD with phase regression promises to provide higher signal spatial specificity while preserving a substantial signal sensitivity. While failing to provide the spatial specificity required within the cortex to accurately examine fine-scale cortical structures, phase regression does prove successful at producing accurate laminar BOLD signal profiles. By effectively suppressing the unwanted signal from large veins and constraining the BOLD signal more to the microvasculature, this simple data-driven approach could be a suitable candidate for laminar studies without the need for acquiring any additional data. However, phase regression does not improve the contrast between columns (Figure 4), suggesting that the phase is not sensitive to the venous vessel sizes that run parallel to the cortical surface in the various layers.Acknowledgements
The authors would like to thank Trevor Szekeres for assistance with data acquisition. This work was supported by the Canadian Institutes of Health Research (CIHR) Foundation Grant, the Brain Canada Platform Support Grant, the Canada Graduate Scholarships-Master's Award, Natural Sciences and Engineering Research Council of Canada (NSERC), and the Canada First Research Excellence Fund, Brain-sCAN.References
1. Hubel, D. H. & Wiesel, T. N. Receptive fields, binocular interaction and functional architecture in the cat’s visual cortex. J Physiology 160, 106–154 (1962).
2. Uludağ, K., Müller-Bierl, B. & Uğurbil, K. An integrative model for neuronal activity-induced signal changes for gradient and spin echo functional imaging. Neuroimage 48, 150–165 (2009).
3. Menon, R. S. The great brain versus vein debate. Neuroimage 62, 970–974 (2012).
4. Panchuelo, R. M. S., Schluppeck, D., Harmer, J., Bowtell, R. & Francis, S. Assessing the Spatial Precision of SE and GE-BOLD Contrast at 7 Tesla. Brain Topogr 28, 62–65 (2015).
5. Menon, R. S. Postacquisition suppression of large‐vessel BOLD signals in high‐resolution fMRI. Magnet Reson Med 47, 1–9 (2002).
6. Stanley, O. W., Menon, R. S. & Klassen, L. M. Receiver phase alignment using fitted SVD derived sensitivities from routine prescans. Plos One 16, e0256700 (2021).
7. Stanley, O. W., Kuurstra, A. B., Klassen, L. M., Menon, R. S. & Gati, J. S. Effects of phase regression on high-resolution functional MRI of the primary visual cortex. Neuroimage 227, 117631 (2021).
8. Moeller, S. et al. NOise reduction with DIstribution Corrected (NORDIC) PCA in dMRI with complex-valued parameter-free locally low-rank processing. Neuroimage 226, 117539 (2021).
9. Huber, L. (Renzo) et al. LayNii: A software suite for layer-fMRI. Neuroimage 237, 118091 (2021).
10. Turner, R. How Much Cortex Can a Vein Drain? Downstream Dilution of Activation-Related Cerebral Blood Oxygenation Changes. Neuroimage 16, 1062–1067 (2002).
11. Duvernoy, H. M., Delon, S. & Vannson, J. L. Cortical blood vessels of the human brain. Brain Res Bull 7, 519–579 (1981).
Figures