3663
Measuring individual vein and artery BOLD responses to visual stimuli in humans with multi-echo single-vessel functional MRI at 7T
Divya Varadarajan1,2, Paul Wighton1,2, Jingyuan Chen1,2, Sebastien Proulx1,2, Robert Frost1,2, Andre van der Kouwe1,2, Avery Berman3, and Jonathan R. Polimeni1,2
1Athinoula A. Martinos Center for Biomedical Imaging, Charlestown, MA, United States, 2Harvard Medical School, Boston, MA, United States, 3Carleton University, Ottawa, ON, Canada
1Athinoula A. Martinos Center for Biomedical Imaging, Charlestown, MA, United States, 2Harvard Medical School, Boston, MA, United States, 3Carleton University, Ottawa, ON, Canada
Synopsis
Keywords: fMRI, Blood vessels
Here we apply single-vessel fMRI techniques to evaluate BOLD and non-BOLD contributions within individual arteries and veins. First we identified individual vessels from inflow effects in a small set of slices, and distinguished arteries and veins on the basis of their T2* decay. Then we applied a high-inplane-resolution multi-echo single-vessel fMRI approach to examine fMRI responses within these vessels. We find evidence for both BOLD and potentially non-BOLD responses within arteries, suggesting that in some cases BOLD may capture arterial responses BOLD which may be more neuronally specific (in space and time) than effects from downstream veins.Introduction
Single-vessel fMRI (sv-fMRI)1-3 acquires anisotropic voxels with in-plane resolution at the scale of individual blood vessels and is useful for understanding the various components of fMRI signals. Typically, sv-fMRI acquires few slices and multiple gradient echoes to promote inflow contrast while also measuring the blood-oxygenation-level-dependent (BOLD) signal. Here we utilize a 0.5⨉0.5⨉1.2 mm3 three-slice FLASH-based sv-fMRI acquisition at 7T to examine the BOLD signal in individual cortical arteries and veins (running approximately perpendicular to the slice) within human visual cortex to test whether intravascular and extravascular oxygenation changes can be detected. This partial-brain acquisition is vulnerable to motion, especially through-slice motion which cannot be corrected retrospectively, and therefore we also adapted the AutoCorrect4 technique for automatically adjusting slice prescription to prospectively correct subject motion between runs. We demonstrate both T2*- and non-T2*-weighted components of the responses in arteries, veins, and parenchyma providing additional evidence for BOLD responses within small arteries.Methods
Three human volunteers participated after giving written informed consent. Each session began with a 1-mm MEMPRAGE adapted to 7T5-6. We acquired 3 slices of 2D multi-echo FLASH fMRI (TE=[3.5,12.7,21.9] ms, TR = 111 ms, FA=20°,40°,60°, voxel size 0.5⨉0.5⨉1.2 mm3, bandwidth = 400 Hz/px) perpendicular to the long axis of the calcarine sulcus , with a temporal sampling rate of 13 s. Visual stimulation consisted of a standard flashing “dartboard” pattern (with a fixation task), presented in a block design with 26 s on and 39 s off. We acquired 6 runs of 300 s (24 trials) .To address motion correction, we adapted the AutoCorrect4 framework where we acquire a scout before each structural and sv-fMRI scan and register in real-time the skull-stripped scout (SynthStrip7) to the reference scout using Robust Register8.
To identify vessels and distinguish arteries and veins, we also acquired an “A-V map”1 consisting of a pair of 2D multi-echo FLASH with the same prescription and FOV as the fMRI data but with double the in-plane resolution (0.25⨉0.25⨉1.2 mm3), a higher flip angle to promote time-of-flight (TOF) contrast. Vessels could be identified by their TOF contrast, and T2* value.
We analyzed percent signal change in the lowest and largest echoes to differentiate BOLD and non-BOLD changes within arteries and veins and the surrounding parenchyma. We also performed a standard General Linear Model analysis assuming a canonical BOLD HRF.
Results
We first demonstrate the ability of AutoCorrect to track between scan motion and prescribe the same high-resolution slices in every run. Figure 1A shows the misalignment in the scout of two runs: one affected by moderate motion and one without. Figure 1B shows a sv-fMRI slice of the first time point obtained after accurate slice prescription with AutoCorrect. AutoCorrect successfully corrects for between-scan motion when it is present, without introducing misalignment when motion is absent, enabling imaging of the same vessels across runs.Fig 2A demonstrates how vessels were identified and arteries and veins differentiated with the A-V map data. With these data we identify voxels interior to the individual arteries and veins to derive ROIs; we then project these ROIs to the functional data after rigid-body registration. An activation map is shown in Figure 2C, with identified vessels within the activated region. The fMRI responses within the two exemplary vessels are plotted in Figure 2D. We observed the expected increase in the BOLD signal at longer echo times in both the identified artery and vein. At the shortest echo time, which is less affected by T2* effects, a smaller but clear positive response is seen in both vessels, suggesting a non-BOLD response as well. Contrary to the general belief, we find that this artery shows both non-BOLD and BOLD related changes. We also observe a positive BOLD signal in the parenchymal/extravascular voxels surrounding both vessels in the activation map.
Lastly, we evaluated whether arteries within the activation region show similar responses across subjects. Group-level results are presented in Figure 3. Consistent with Figure 2, we found that the intravascular fMRI signal within arteries exhibited a positive BOLD response, up to ~4% when TE is approximately equal to gray matter T2*, while the non-BOLD response was detectable but less distinct.
Discussion
We demonstrated that sv-fMRI can be used to identify clear BOLD responses within individual small arteries that supply the activated cortex. Here we attempted to restrict voxels to be within vessels to reflect intravascular signal, however some partial volume effects are expected, thus these signals are likely a combination of intravascular and extravascular intensity changes as well as dynamic partial volume effects. While it is often assumed that the arterial blood is fully oxygenated such that arterial BOLD is negligible, our data are consistent with previous reports that suggest—because the oxygen saturation of blood in small arteries is sufficiently low9—flow changes associated with neural activity will cause a reduction in arterial deoxyhemoglobin and thus an increase in T2*10. Not only do these data provide additional insights into the behavior of individual vessels, but it also suggests that BOLD can in some cases reflect arterial effects which may be more neuronally specific. Future work will further investigate non-BOLD effects, which may be attributed to either flow or volume changes, or both.Acknowledgements
Thanks to Estee Goldberg and Kyle Droppa for help with volunteer recruitment and scheduling, and Danny Park for pulse sequence Support. This work was supported in part by the NIH NIBIB (grants P41-EB030006, R01-EB032746 and R01-EB019437), NINDS (grant R01-NS128843), the BRAIN Initiative (NIH NIMH grants R01-MH111419 and NINDS U19-NS123717), the MGH/HST Athinoula A. Martinos Center for Biomedical Imaging; and the resources provided by the NIH Shared Instrumentation Grant S10-OD023637.References
- Yu, X., Glen, D., Wang, S., Dodd, S., Hirano, Y., Saad, Z. S., Reynolds, R., Silva, A. C., & Koretsky, A. P. (2012). Direct imaging of macrovascular and microvascular contributions to BOLD fMRI in layers IV-V of the rat whisker-barrel cortex. NeuroImage, 59(2), 1451–1460. https://doi.org/10.1016/j.neuroimage.2011.08.001
- Yu, X., He, Y., Wang, M., Merkle, H., Dodd, S. J., Silva, A. C., & Koretsky, A. P. (2016). Sensory and optogenetically driven single-vessel fMRI. Nature Methods, 13(4), 337–340. https://doi.org/10.1038/nmeth.3765
- He, Y., Wang, M., Chen, X., Pohmann, R., Polimeni, J. R., Scheffler, K., Rosen, B. R., Kleinfeld, D., & Yu, X. (2018). Ultra-slow single-vessel BOLD and CBV-based fMRI spatiotemporal dynamics and their correlation with neuronal intracellular calcium signals. Neuron, 97(4), 925-939.e5. https://doi.org/10.1016/j.neuron.2018.01.025
- van der Kouwe AJ, Benner T, Fischl B, Schmitt F, Salat DH, Harder M, Sorensen AG, Dale AM. On-line automatic slice positioning for brain MR imaging. Neuroimage. 2005 Aug 1;27(1):222-30. doi: 10.1016/j.neuroimage.2005.03.035. PMID: 15886023.
- Zaretskaya N, Fischl B, Reuter M, Renvall V, Polimeni JR. Advantages of cortical surface reconstruction using submillimeter 7 T MEMPRAGE. Neuroimage. 2018 Jan 15;165:11-26. doi: 10.1016/j.neuroimage.2017.09.060. Epub 2017 Sep 29. PMID: 28970143; PMCID: PMC6383677.
- van der Kouwe AJW, Benner T, Salat DH, Fischl B. Brain morphometry with multiecho MPRAGE. Neuroimage. 2008 Apr 1;40(2):559-569. doi: 10.1016/j.neuroimage.2007.12.025. Epub 2008 Feb 1. PMID: 18242102; PMCID: PMC2408694.
- Hoopes A, Mora JS, Dalca AV, Fischl B, Hoffmann M. SynthStrip: skull-stripping for any brain image. Neuroimage. 2022 Oct 15;260:119474. doi: 10.1016/j.neuroimage.2022.119474. Epub 2022 Jul 13. PMID: 35842095; PMCID: PMC9465771.
- Reuter M, Rosas HD, Fischl B. Highly accurate inverse consistent registration: a robust approach. Neuroimage. 2010 Dec;53(4):1181-96. doi: 10.1016/j.neuroimage.2010.07.020. Epub 2010 Jul 14. PMID: 20637289; PMCID: PMC2946852.
- Sakadzić S, Roussakis E, Yaseen MA, et al. Two-photon high-resolution measurement of partial pressure of oxygen in cerebral vasculature and tissue. Nat Methods. 2010;7(9):755-759. doi:10.1038/nmeth.1490
- Tong, Y., Yao, J.F., Chen, J.J., Frederick, B.D., 2018. The resting-state fMRI arterial signal predicts differential blood transit time through the brain. J. Cereb. Blood Flow Metab. 271678X17753329.
Figures
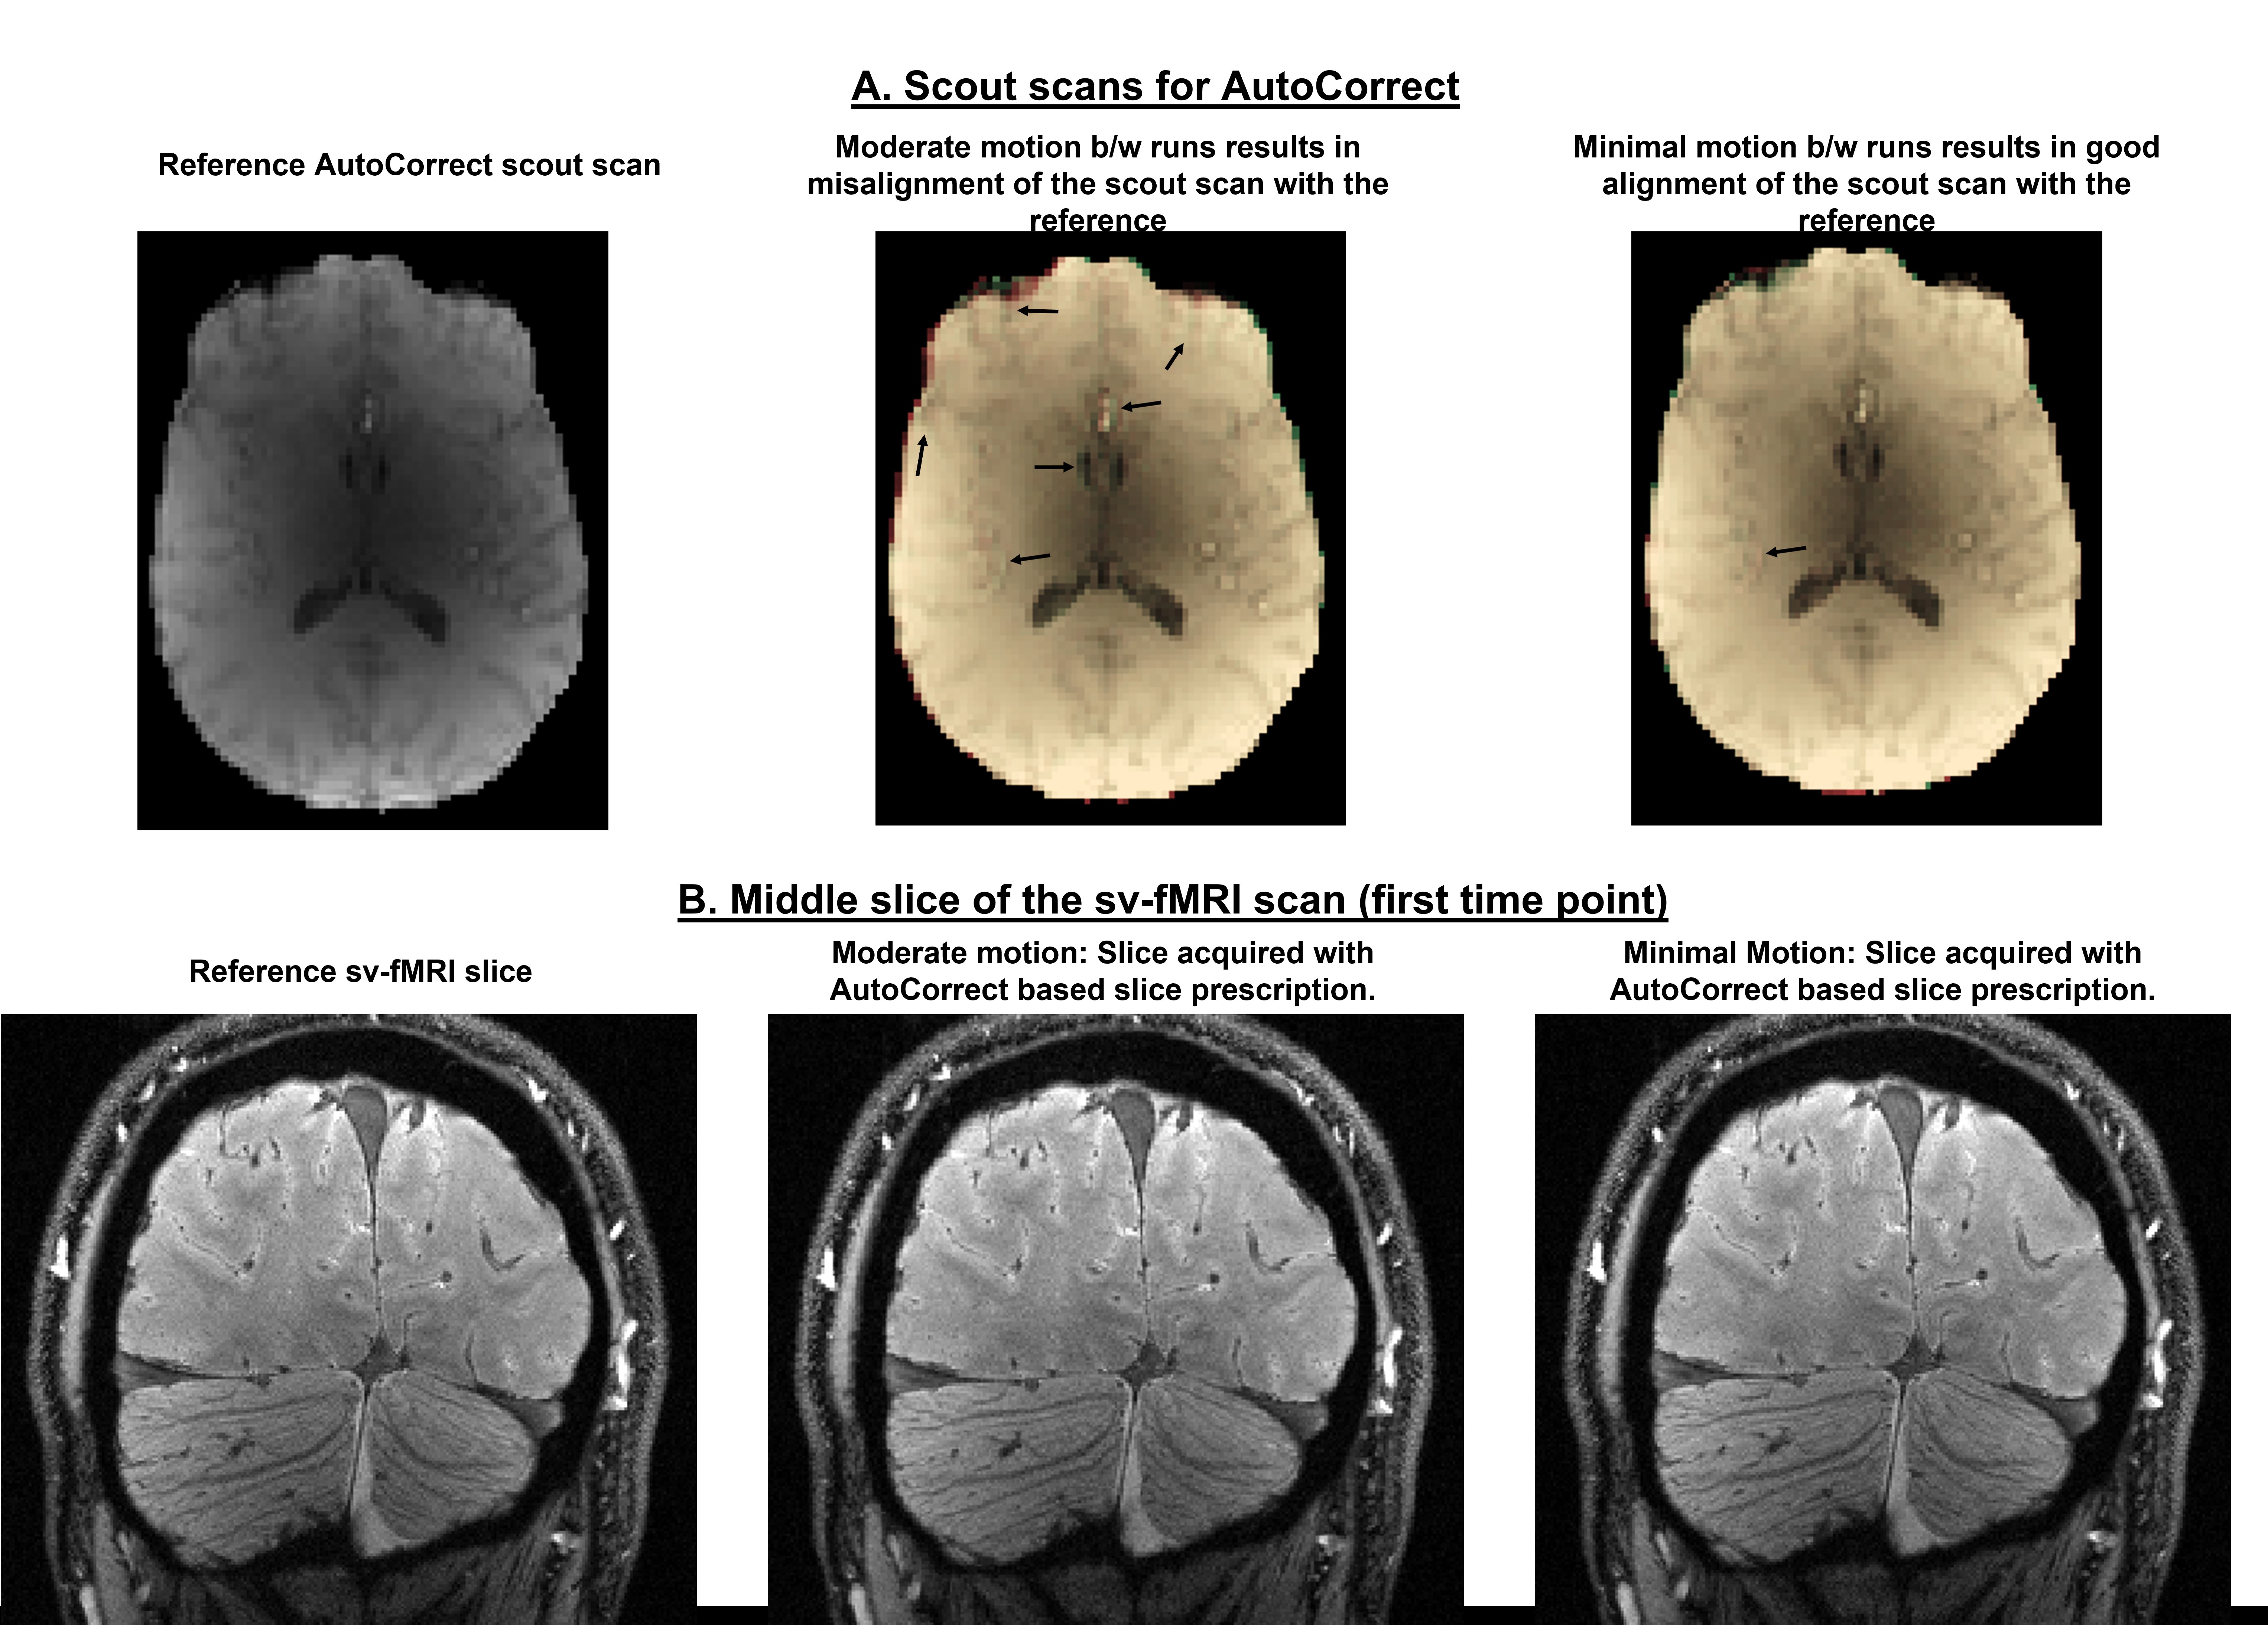
Fig 1: 1A: Reference AutoCorrect scout from one session is overlapped with scouts from two runs of the same session: one corresponding to moderate motion between scans and other with minimal motion. The gray matter edges in the moderate motion case are misaligned from the reference, which is highly problematic for sv-fMRI if uncorrected.1B: High res sv-fMRI slices of all three runs from the same session acquired after using AutoCorrect for prospective prescription correction. The final acquired slices are well aligned, providing good alignment of individual vessels between all runs.

Fig 2: 2A: A-V map: Two echo times of structural FLASH MRI scans to classify arteries and veins. The red arrow marks an artery, and the blue arrow marks a vein whose response is analyzed. 2B: Single vessel fMRI slice at the first time point registered to the A-V map using AutoCorrect. The artery and vein selected in 2A are marked. 2C: Activation map of the entire slice (thresholded at z = 2.3) showing the area of positive BOLD correlation. 2D. The mean over all trials and corresponding standard error of the sv-fMRI signal from a single voxel in the marked artery and vein for three echo times.
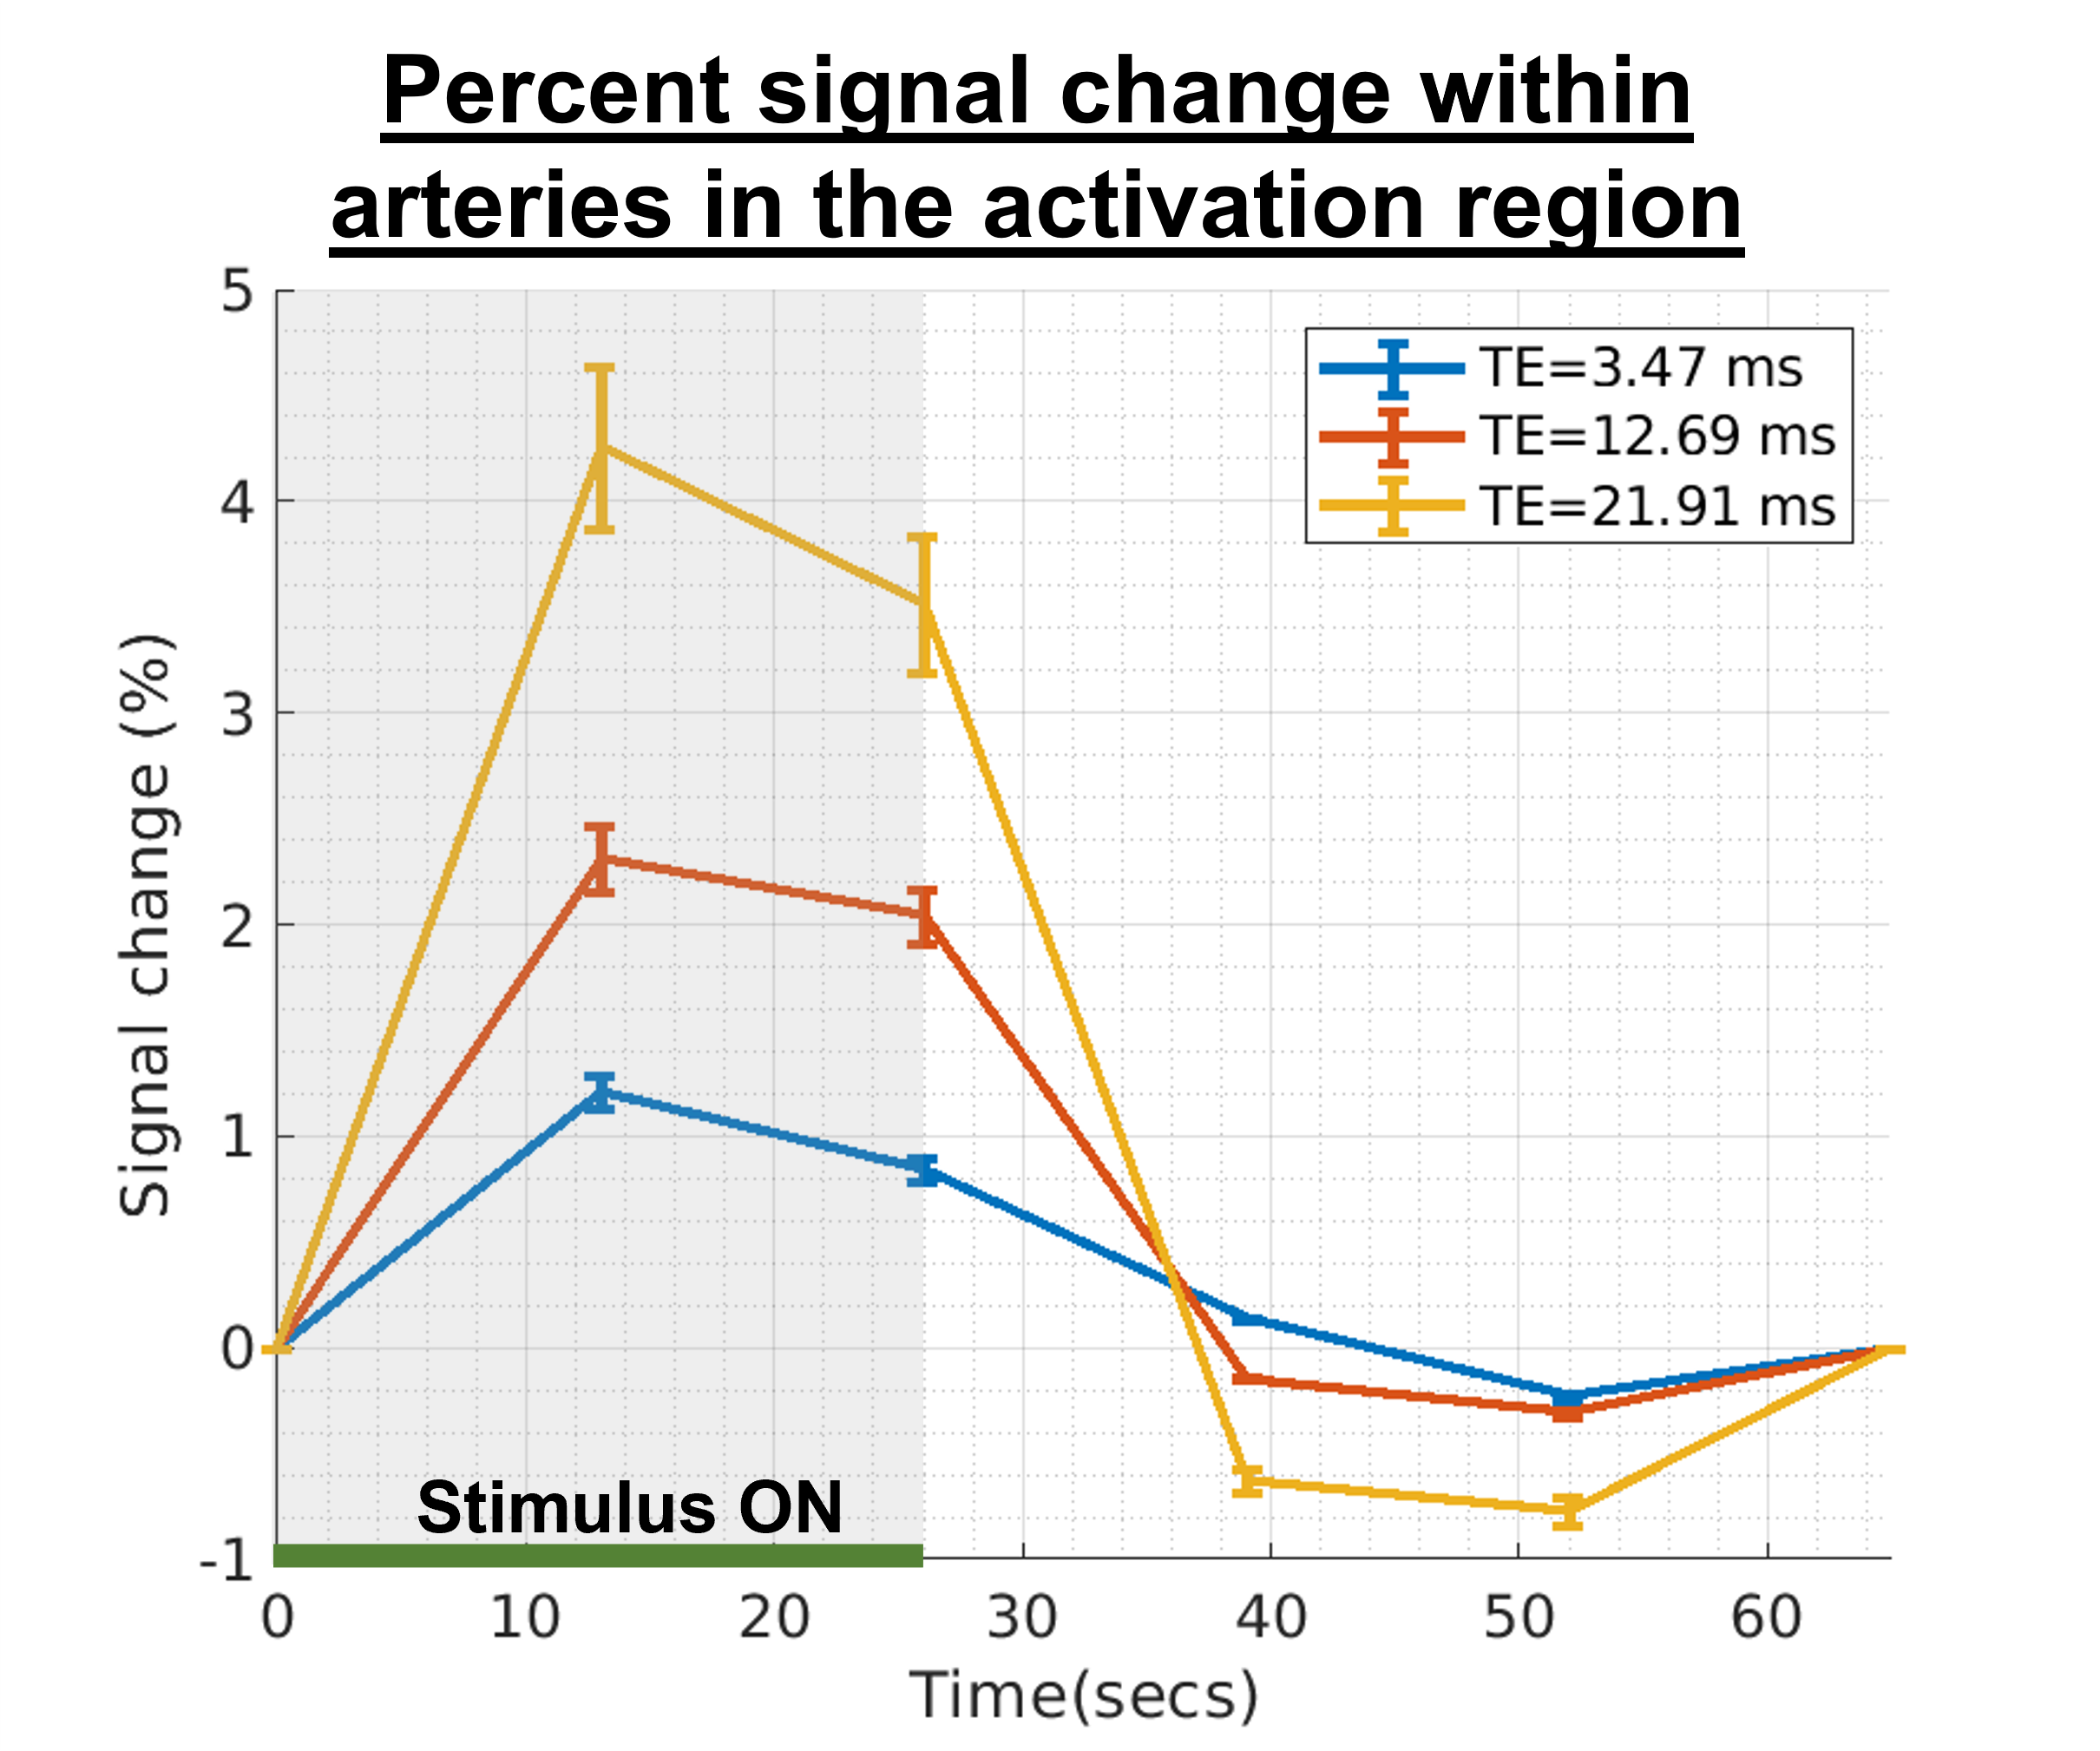
Fig 3: Mean across arteries from all scans that are within the activation region, and the corresponding standard error of the percent sv-fMRI signal change for three echo times. The BOLD effect consistently increases with echo time.
DOI: https://doi.org/10.58530/2023/3663