3662
Utility of Noncontrast-enhanced Turbo-field Echo-planar Imaging-based 4D Flow MRI for Portal Venous System1Department of Diagnostic Imaging, Faculty of Medicine and Graduate School of Medicine, Hokkaido University, Sapporo, Japan, 2Department of Dental Radiology, Hokkaido University Hospital, Sapporo, Japan, Japan, 3Department of Diagnostic and Interventional Radiology, Hokkaido University Hospital, Sapporo, Japan, 4Department of Radiological Technology, Hokkaido University Hospital, Sapporo, Japan, 5Department of Radiology, Faculty of Dental Medicine, Hokkaido University, Sapporo, Japan, 6Global Center for Biomedical Science and Engineering, Faculty of Medicine, Hokkaido University, Sapporo, Japan
Synopsis
Keywords: Vessels, Velocity & Flow
Echo-planer imaging-based three-dimensional cine phase contrast (4D flow) MRI has been reported to achieve good image quality with a short acquisition time in cardiovascular imaging, but its application to the portal venous (PV) system has not been reported. In this study, the turbo-field echo-planar imaging (TFEPI) 4D flow MRI with a turbo-field echo (TFE)-based one in the PV system was compared. The TFEPI sequence showed a better image quality and flow consistency at the splenic and superior mesenteric vein confluence with a shorter acquisition time compared to the conventional TFE-based one.Introduction
Three-dimensional cine phase contrast (4D flow) MRI has recently been applied for the portal venous (PV) system.1,2 Numerous previous reports in this area use contrast agents to achieve an evaluable signal-to-noise ratio.1,2 Echo-planar imaging (EPI)-based sequences rapidly fill k-space with less undersampling and its utility in cardiovascular 4D flow MRI studies has been reported.3,4 However, the EPI-based 4D flow MRI for PV system application has not been reported. EPI‑based sequence was hypothesized to achieve a high image quality that enables flow evaluation even under a noncontrast-enhanced situation. In this study, the TFEPI-based 4D flow MRI was compared with the conventional TFE sequence in the PV system.Material and Methods
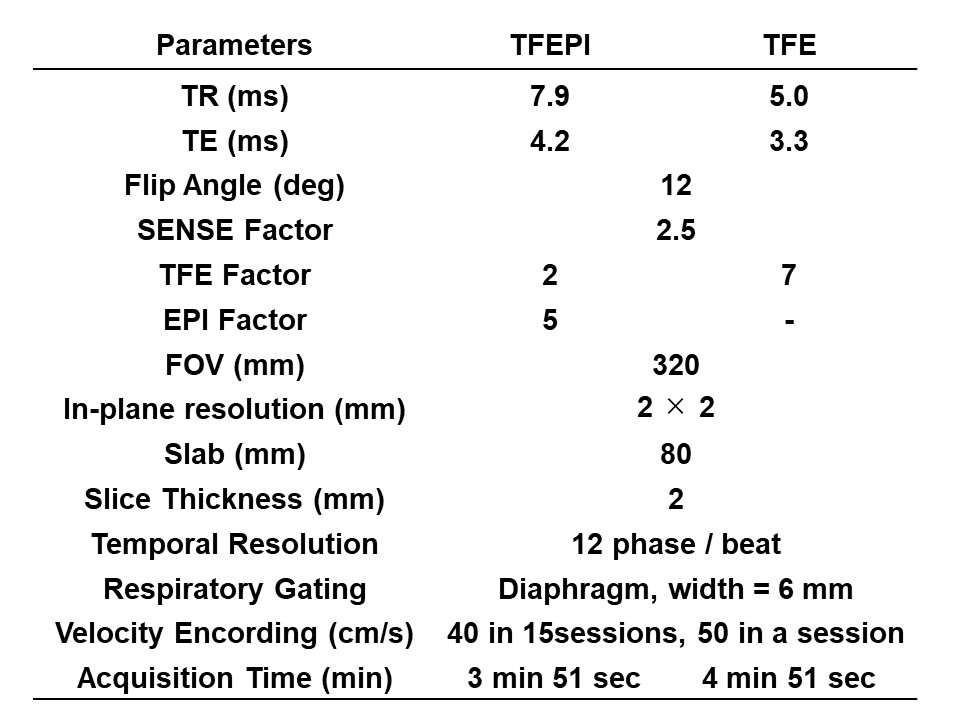
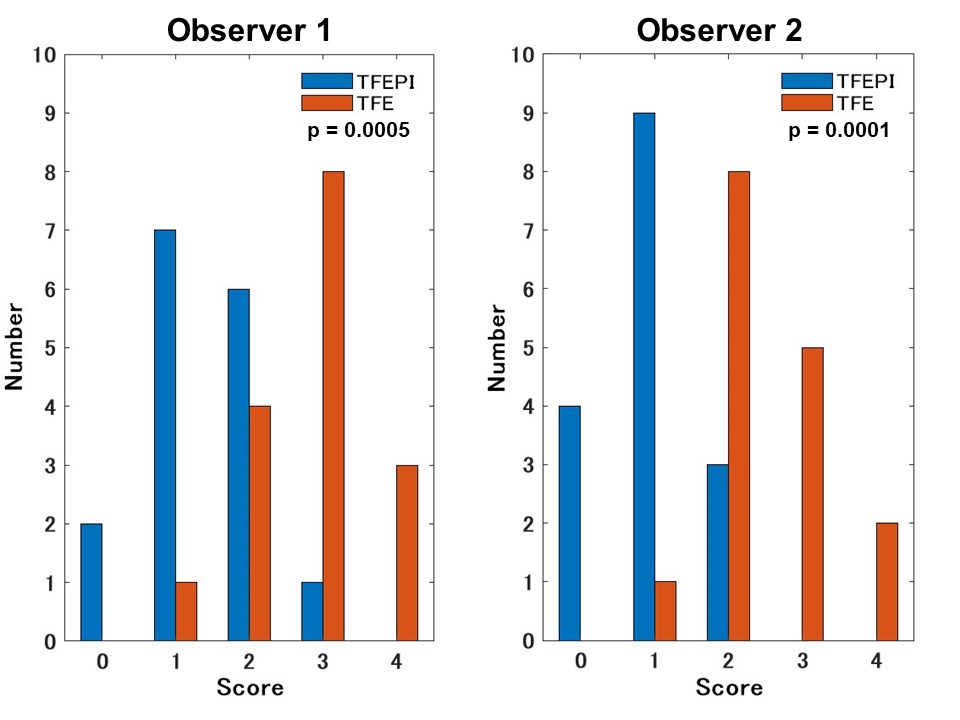
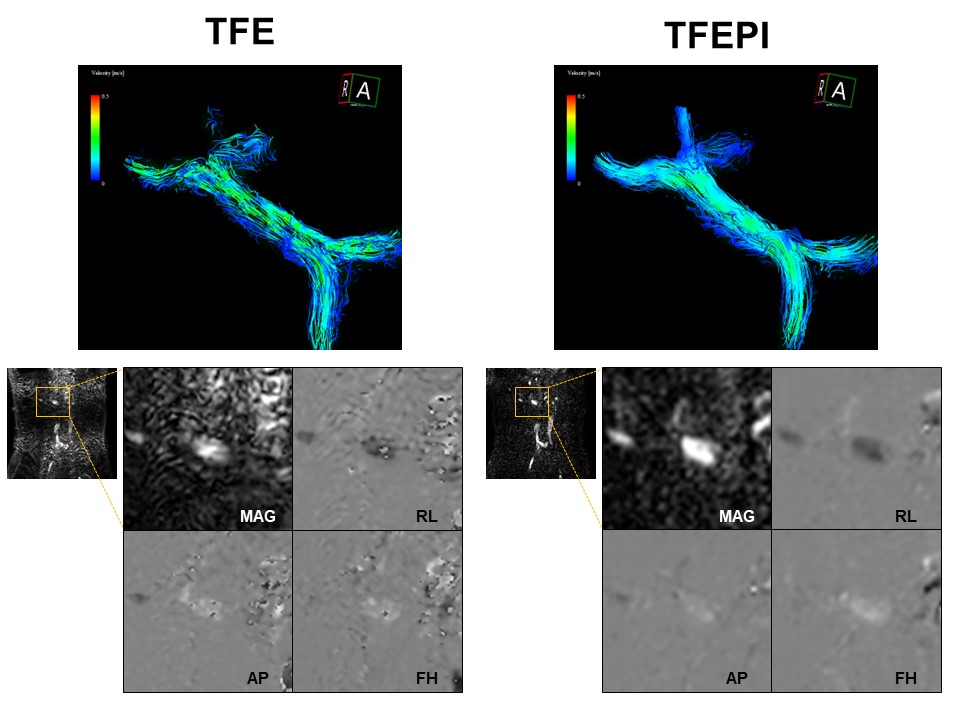
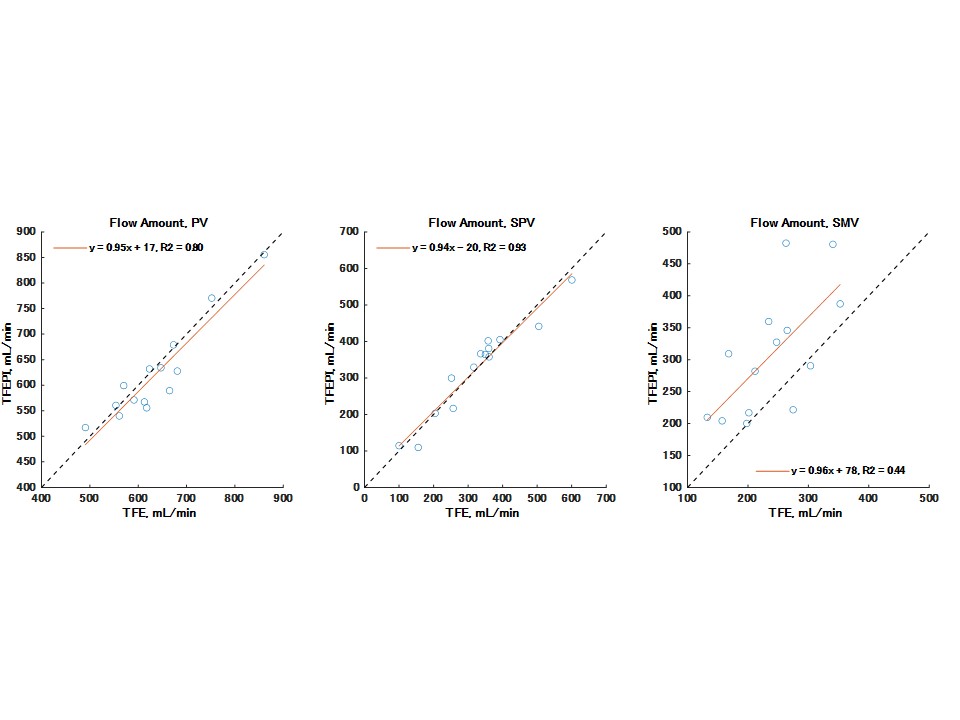
This study included 16 MRI sessions (13 sessions from clinical patients and 3 sessions from normal volunteers) conducted in a 3.0-T scanner (Ingenia Elition, Philips Healthcare, Netherlands). The 4D flow MRI using TFEPI and TFE sequences were sequentially acquired in all sessions with the same 2 × 2 × 2 mm acquisition resolution, 12 phases/beat temporal resolution, and the same velocity encoding (Figure 1). The acquition time was 3 min 51 sec for the TFEPI sequence and 4 min 51 sec for the TFE sequence. The PV trunk image quality from the splenic vein (SV) and superior mesenteric vein (SMV) confluence to the right and left PV bifurcation was visually scored by two radiologists using a five-point scale (0, no artifact; 4, poor and unfeasible two-dimensional flow analysis). After excluding sessions that both observers scored 4, flow amount quantification and comparison were conducted at three points around the flow confluence by creating two-dimensional sections: SV downstream, SMV downstream, and PV trunk proximal portion. The flow amount correlation between the sequences at each point was compared. Flow consistency around the confluence was evaluated by comparing the PV versus SV + SMV flow amount.Results
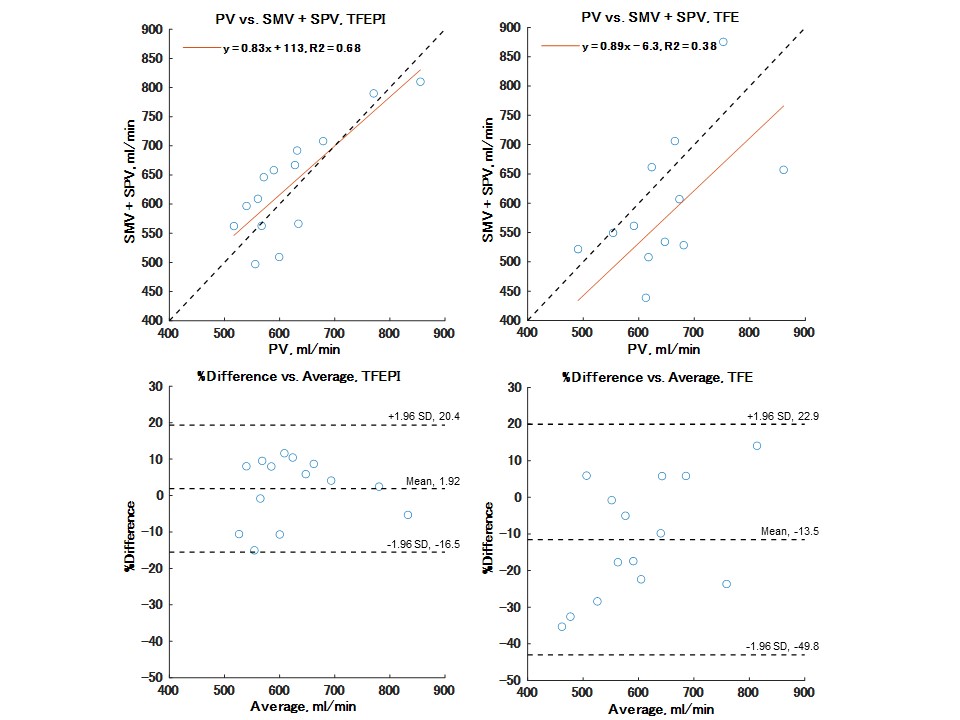
Visual scores for the TFEPI sequence for both observers were better with a moderate interobserver agreement (p = 0.0005 for observer 1 and p = 0.0001 for observer 2 in signed-rank tests, weighted Cohen’s kappa = 0.51 and 0.44 for TFEPI and TFE) (Figures 2 and 3). Because two TFE series were scored as 4 by both observers, these two sessions were excluded. Flow analyses were then conducted on the remaining 14 sessions. Flow amount showed a good correlation at PV and SV between sequences (r = 0.89 and 0.96, respectively) However, the SMV correlation was lower (r = 0.66), and the estimated flow amount was smaller in the TFE series (Figure 4). Flow consistency around the confluence showed a higher correlation in the TFEPI series (r = 0.82) than in the TFE series (r = 0.61) (Figure 5).Discussion
Recent reports have described the usefulness of PV 4D flow MRI in clinical settings, such as identifying high risk varices or abdominal angina diagnosis.5,6 However, 4D flow MRI utility in PV system has generally been limited to flow quantification and has yet to prove kinetic analysis utility like cardiovascular imaging. Furthermore, the majority of previous reports use contrast agents to achieve signal-to-noise ratio improvement, but an identical examination without a contrast agent if achievable is needed because patients with advanced cirrhosis or end-stage liver diseases can develop renal failure due to hepatorenal syndrome. The TFEPI 4D flow MRI presented in this study will allow more stable flow quantification with better flow consistency than the conventional TFE sequence, and its high image quality might allow further advanced analysis, including kinetic analysis or flow simulation even under a noncontract-enhanced situation.Conclusion
TFEPI 4D-flow MRI in PV system achieved a higher image quality and better flow consistency with a shorter acquisition time than the conventional TFE sequence under the noncontrast-enhanced situation.Acknowledgements
No acknowledgement found.References
1. Oechtering TH, Roberts GS, Panagiotopoulos N, et al. Clinical Applications of 4D Flow MRI in the Portal Venous System. Magn Reson Med Sci. 2022;21(2):340-353.
2. Hyodo R, Takehara Y, Naganawa S. 4D Flow MRI in the portal venous system: imaging and analysis methods, and clinical applications. Radiol Med. 2022;127(11):1181-1198.
3. Garg P, Westenberg JJM, van den Boogaard PJ, et al. J Magn Reson Imaging. 2018;47(1):272-281.
4. Shiina Y, Inai K, Nagao M. Non-physiological Aortic Flow and Aortopathy in Adult Patients with Transposition of the Great Arteries after the Jatene Procedure: A Pilot Study Using Echo Planar 4D Flow MRI. Magn Reson Med Sci. 2021;20(4):439-449.
5. Motosugi U, Roldán-Alzate A, Bannas P, et al. Four-dimensional Flow MRI as a Marker for Risk Stratification of Gastroesophageal Varices in Patients with Liver Cirrhosis. Radiology. 2019;290(1):101-107.
6. Roberts GS, François CJ, Starekova J, et al. Non-invasive assessment of mesenteric hemodynamics in patients with suspected chronic mesenteric ischemia using 4D flow MRI. Abdom Radiol (NY). 2022 May;47(5):1684-1698.
Figures