3661
Validation of real-time phase contrast MRI with online compressed sensing reconstruction in phantom and patients1Clinical Physiology, Department of Clinical Sciences Lund, Skåne University Hospital, Lund University, Lund, Sweden, 2Department of Clinical Sciences Lund, Pediatric Heart Center, Skåne University Hospital, Lund University, Lund, Sweden, 3Department of Biomedical Engineering, Lund University, Lund, Sweden, 4Magnetic Resonance, Siemens Healthcare GmbH, Erlangen, Germany, 5Institute of Radiology, University Hospital Erlangen, Friedrich-Alexander-Universität Erlangen-Nürnberg, Erlangen, Germany
Synopsis
Keywords: Flow, Velocity & Flow
Real-time Phase Contrast MRI with Compressed Sensing reconstruction is a promising method to image cardiac flow in patients with arrhythmia, where cardiac-gated sequences fail. In this study, we compared it against the gated standard clinical flow MRI using a phantom model and in patients. The phantom underwent pulsatile periodic and non-periodic flow. For in vivo validation, non-arrhythmic patient data (N=10) and data from patient with atrial fibrillation (N=1) were collected from the ascending aorta. Non-periodic flow was captured both in the phantom and in vivo. Real-time MRI showed good accuracy in net flow quantification and underestimated peak flow.Background
Phase Contrast (PC) MRI is a widely used clinical tool to quantify cardiac and vessel blood flow. However, standard cardiac-gated methods fail to capture flow during arrhythmias1. Real-Time (RT) PC MRI enables fast, free-breathing, arrhythmia-robust acquisitions, but may suffer from degraded temporal and spatial resolution compared to gated flow imaging2 or require offline reconstruction schemes3–5. By using compressed sensing (CS), it is possible to achieve high acceleration factors with maintained spatial and temporal resolution while keeping a fast, inline reconstruction6. We hypothesized that RT PC MRI combined with CS could be a clinically relevant method for flow imaging during arrhythmias.Therefore, the aim of this study was to validate the performance of a research Real-Time PC sequence with CS reconstruction in a phantom and in non-arrhythmic patients against the standard cardiac-gated clinical flow sequence, for future use in arrhythmic patients.
Methods
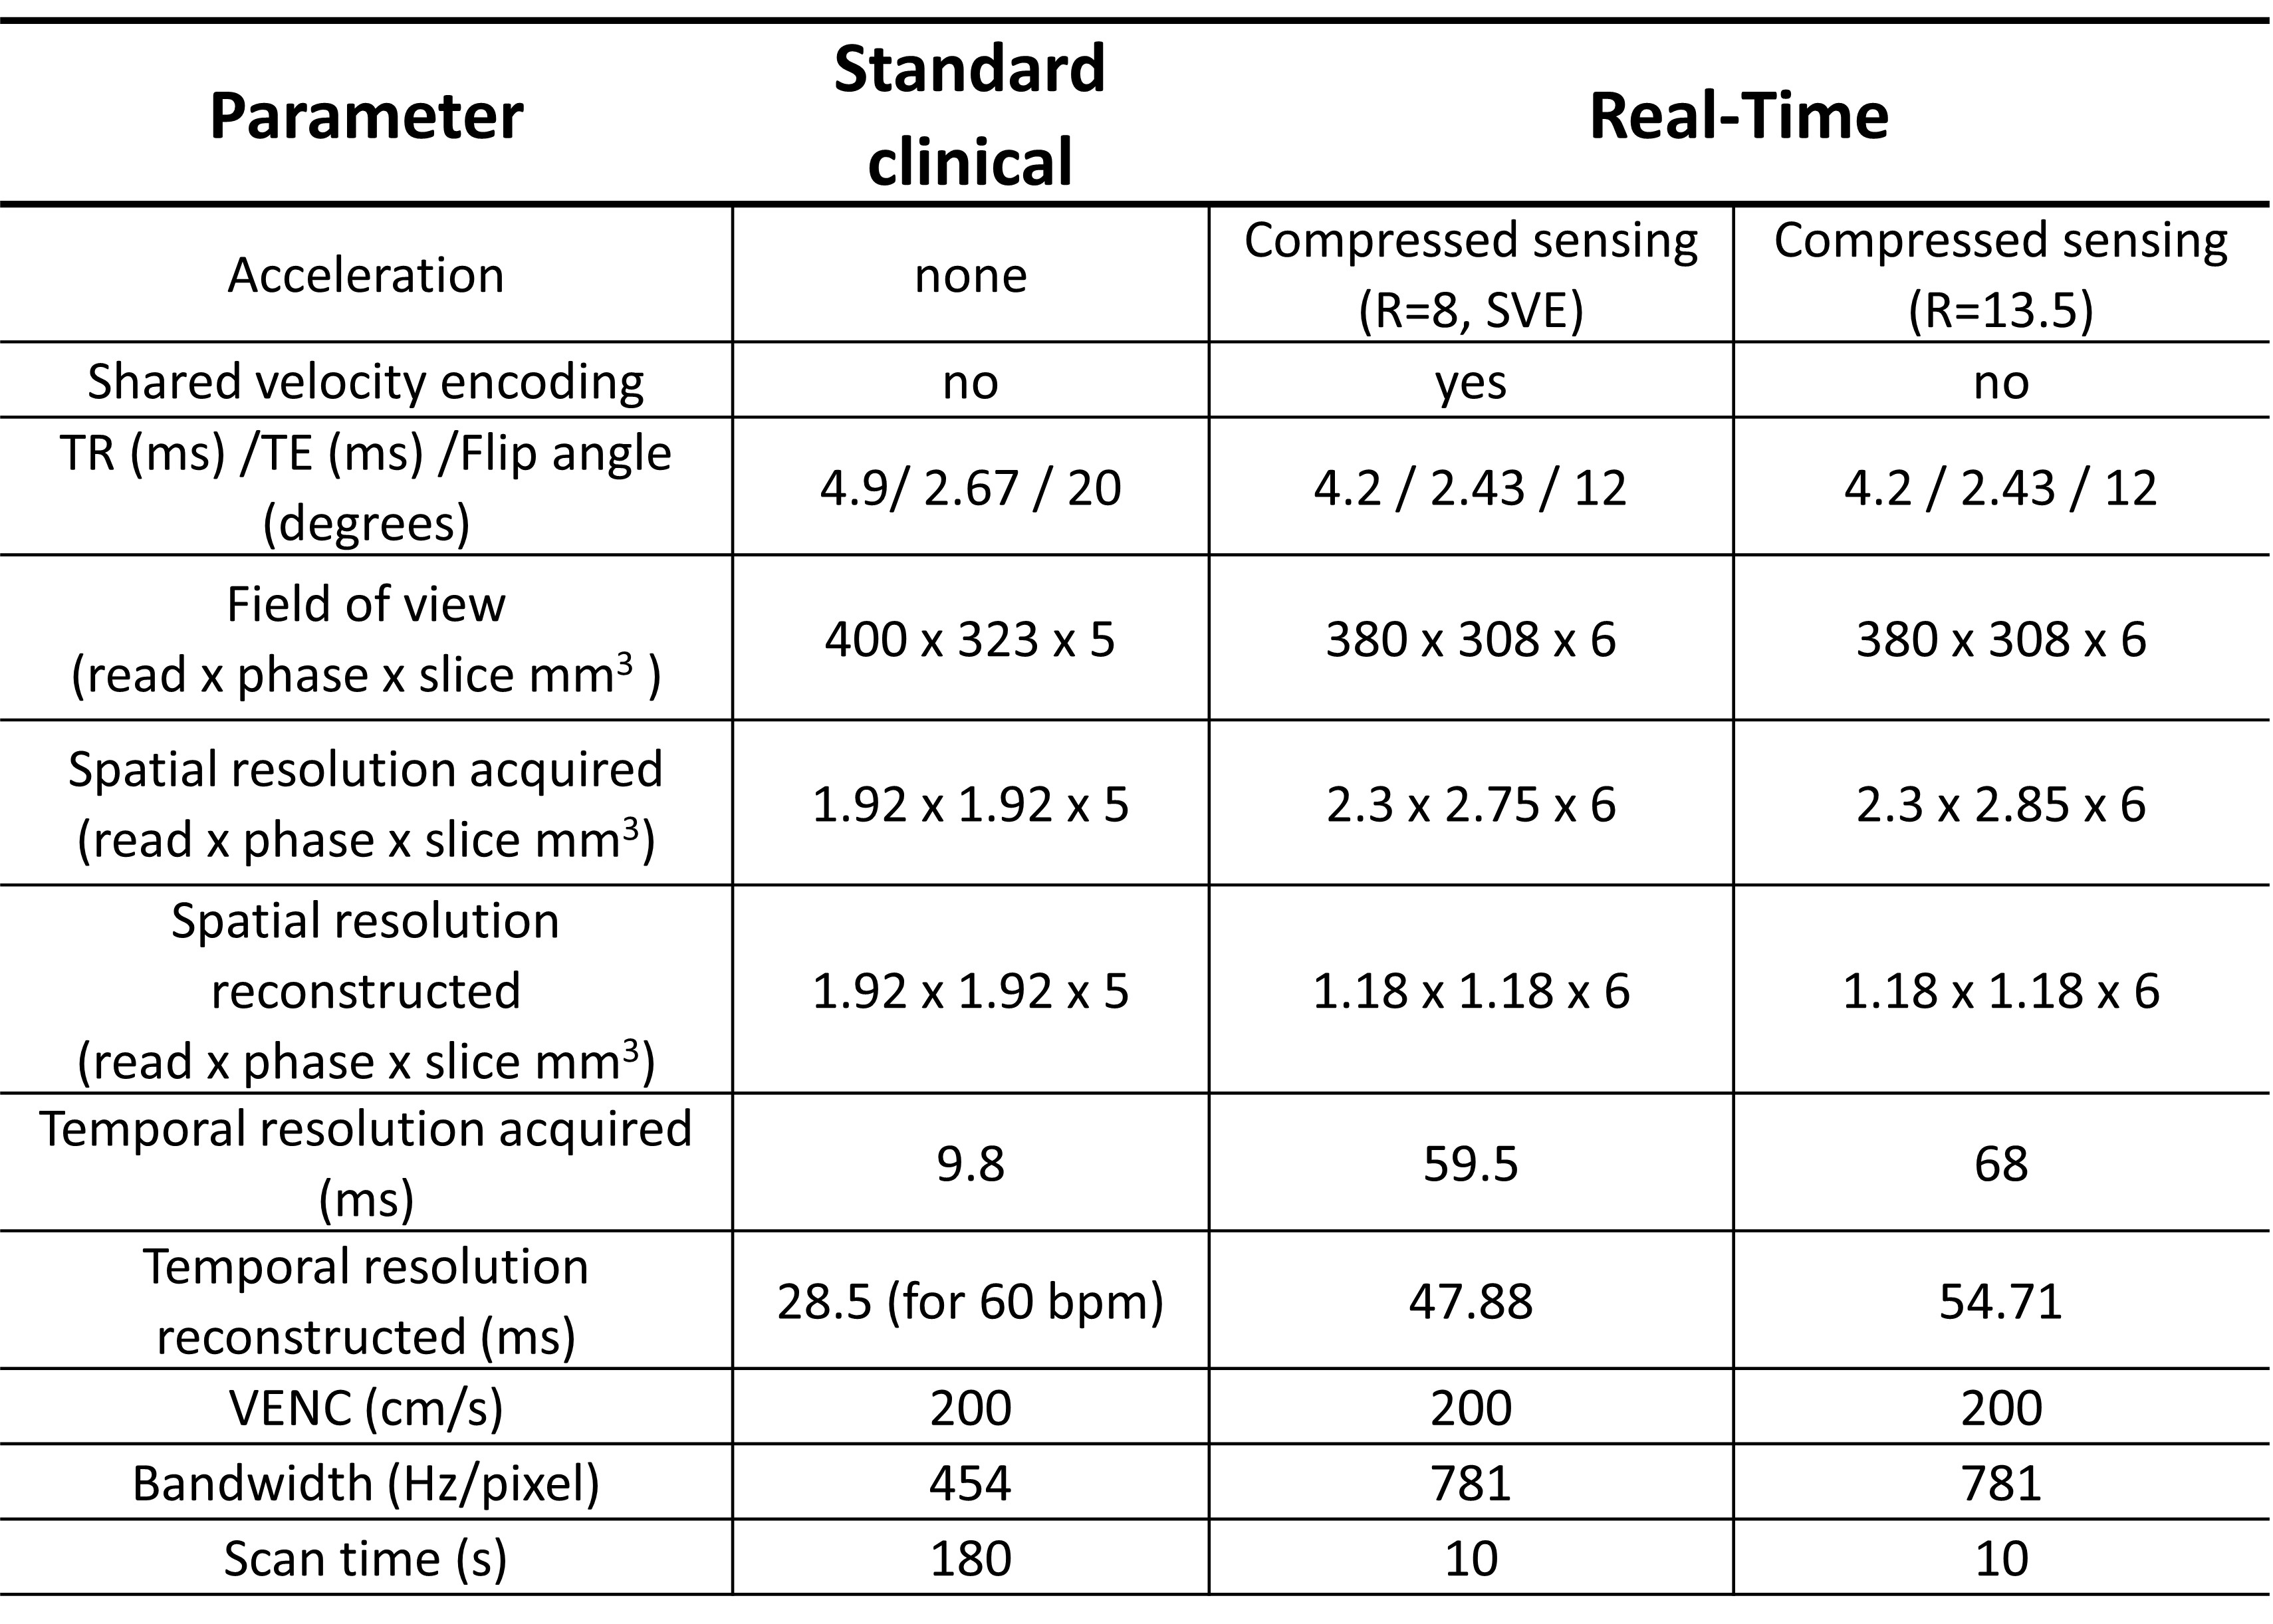
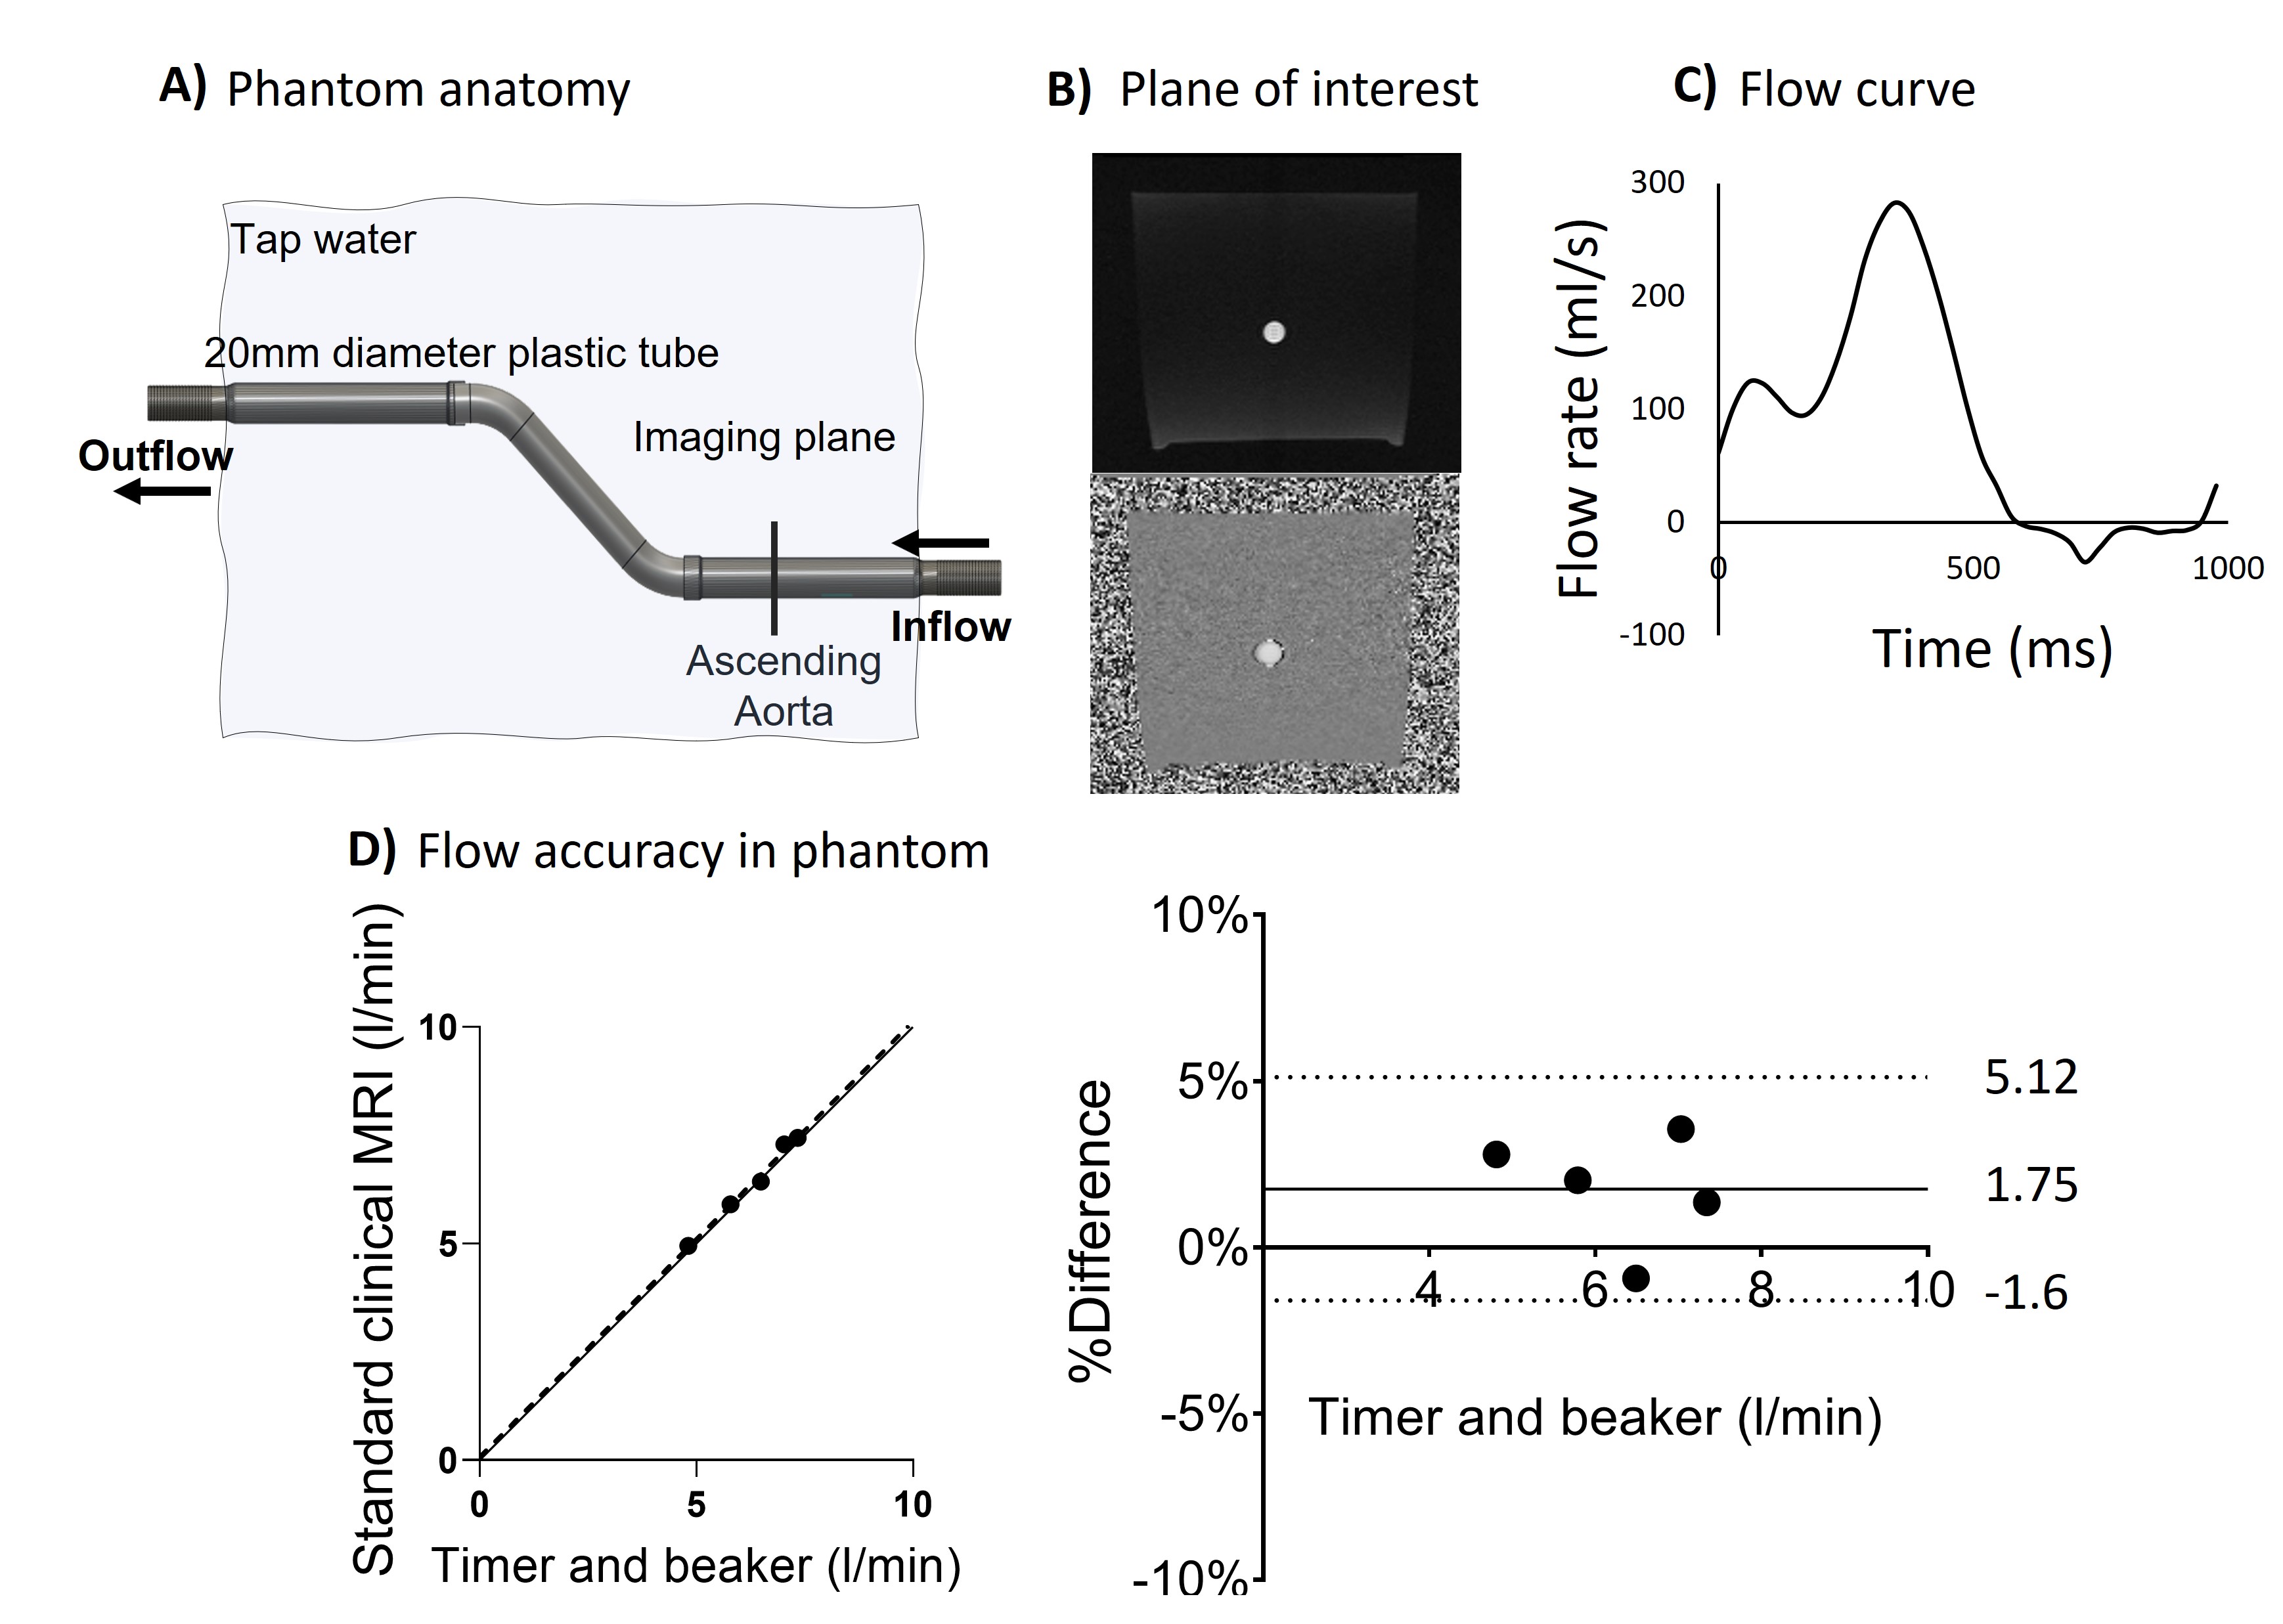
Phantom and patient scans were performed using a 1.5T clinical scanner (MAGNETOM Sola, Siemens Healthcare, Erlangen, Germany). The research RT CS sequence was tested with two accelerations: 1) with acceleration factor R=8 and shared velocity encoding7 (SVE) and 2) with R=13.5. The pulse sequence parameters of the research RT CS and standard clinical sequences are summarized in Figure 1.The phantom included a straight tube (20 mm inner diameter) in the feet-head direction to simulate the ascending aorta (Figure 2, panel A). The phantom was connected to a pulsatile pump driven by a programmable motor set to generate flow rates in five steps between 3 and 8 l/min, with pulsation frequency set to 60 beats per minute (N=5 experiments).
The experimental protocol included timer and beaker measurements followed by through-plane MRI at a plane representing the ascending aorta with the clinical and RT sequences, followed by a second timer and beaker measurement to assess experiment stability. The clinical sequence was gated by a signal generated by the motor at the start of each cycle. Timer and beaker measurements were compared to the clinical sequence for validation of the set up (Figure 2, Panels B, C, D).
Real-time net flow (in liters/minute as calculated from the real-time flow curves) was compared to timer and beaker measurements, and peak flow rate (mean peak flow rate over all cycles) was compared to the clinical sequence. To investigate performance in arrhythmias, two sequential flow curves with different stroke volumes were programmed to occur periodically. The clinical sequence was gated according to the periodicity. The resulting flow curve was compared to what RT CS captured.
The same MRI protocol was used in patients (N=10) without arrhythmias for in vivo validation and a patient (N=1) with atrial fibrillation to test feasibility in arrhythmia. Through-plane measurements were performed at the ascending aorta and net flow and peak flow rate were calculated, comparing RT to the clinical sequence. Written, informed consent was obtained from all patients.
Image analysis was performed using the software Segment8 version 3.3 (Medviso AB, Lund, Sweden). Phase background correction was performed in all PC images using static ROIs9. Linear regression and modified Bland-Altman analyses were done in GraphPad Prism version 9.4.1 (GraphPad Software, San Diego, California, USA), and used to compare RT flow with clinical MRI flow and timer-beaker flow.
Results
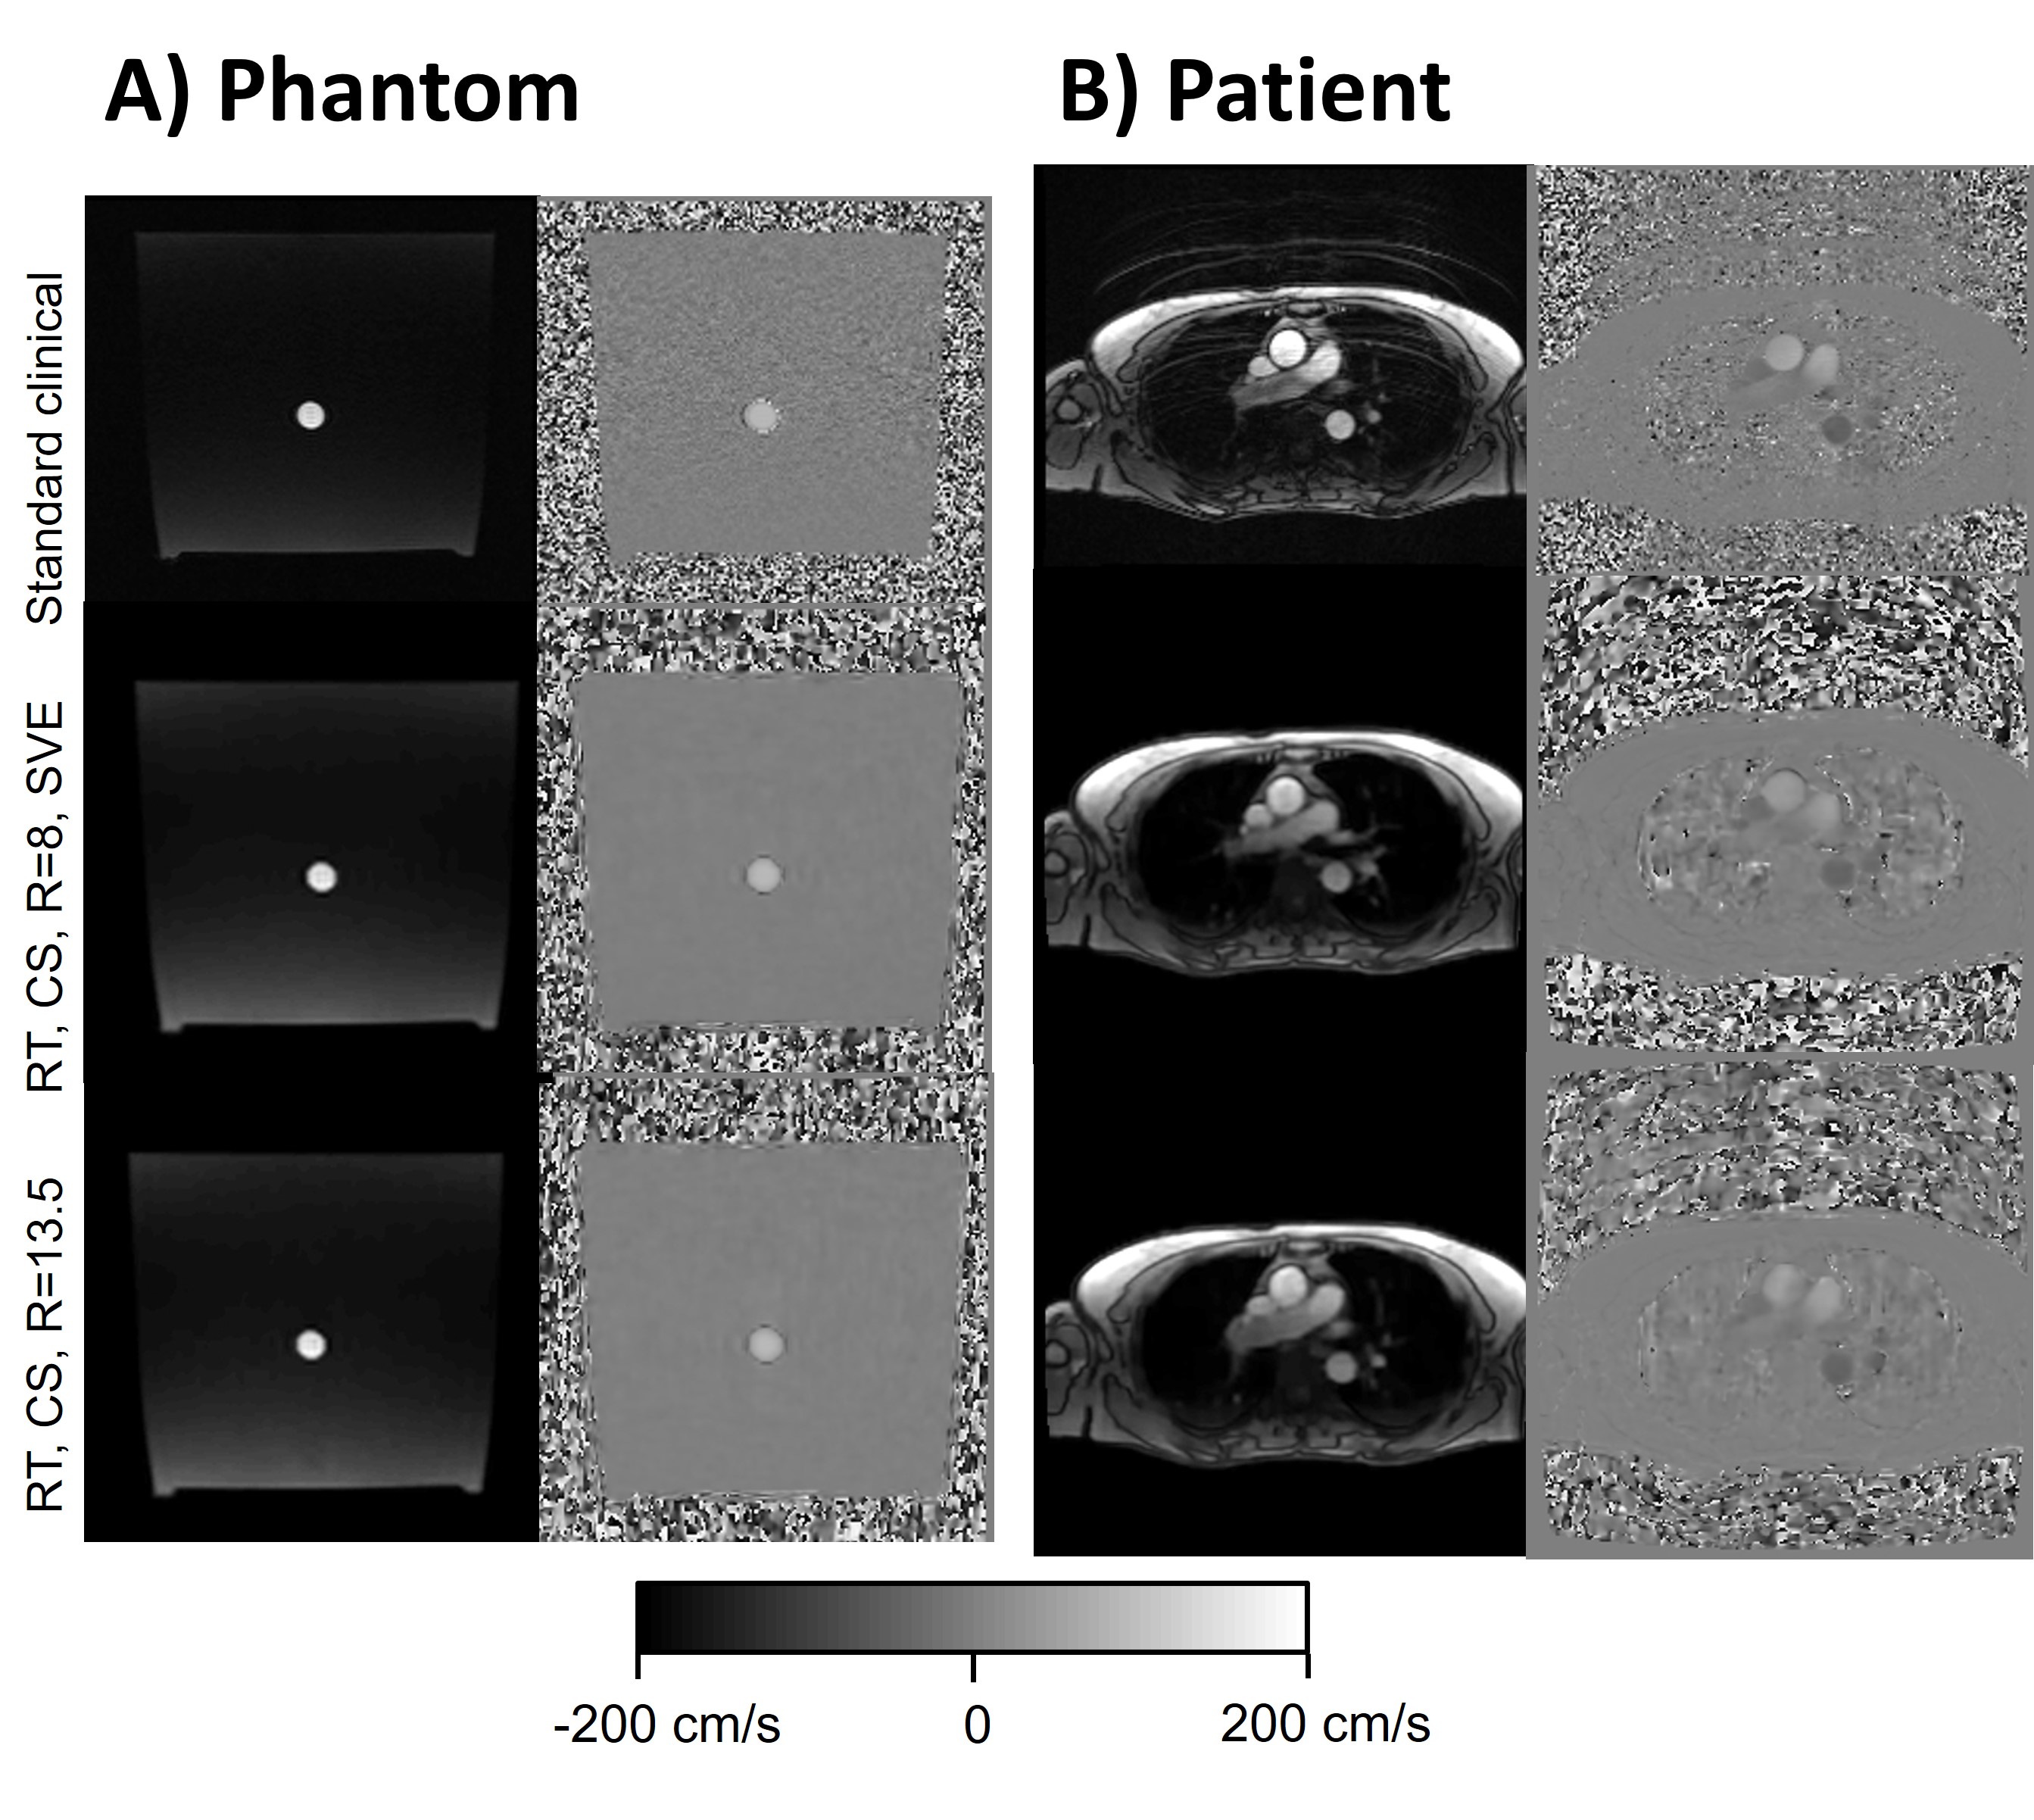
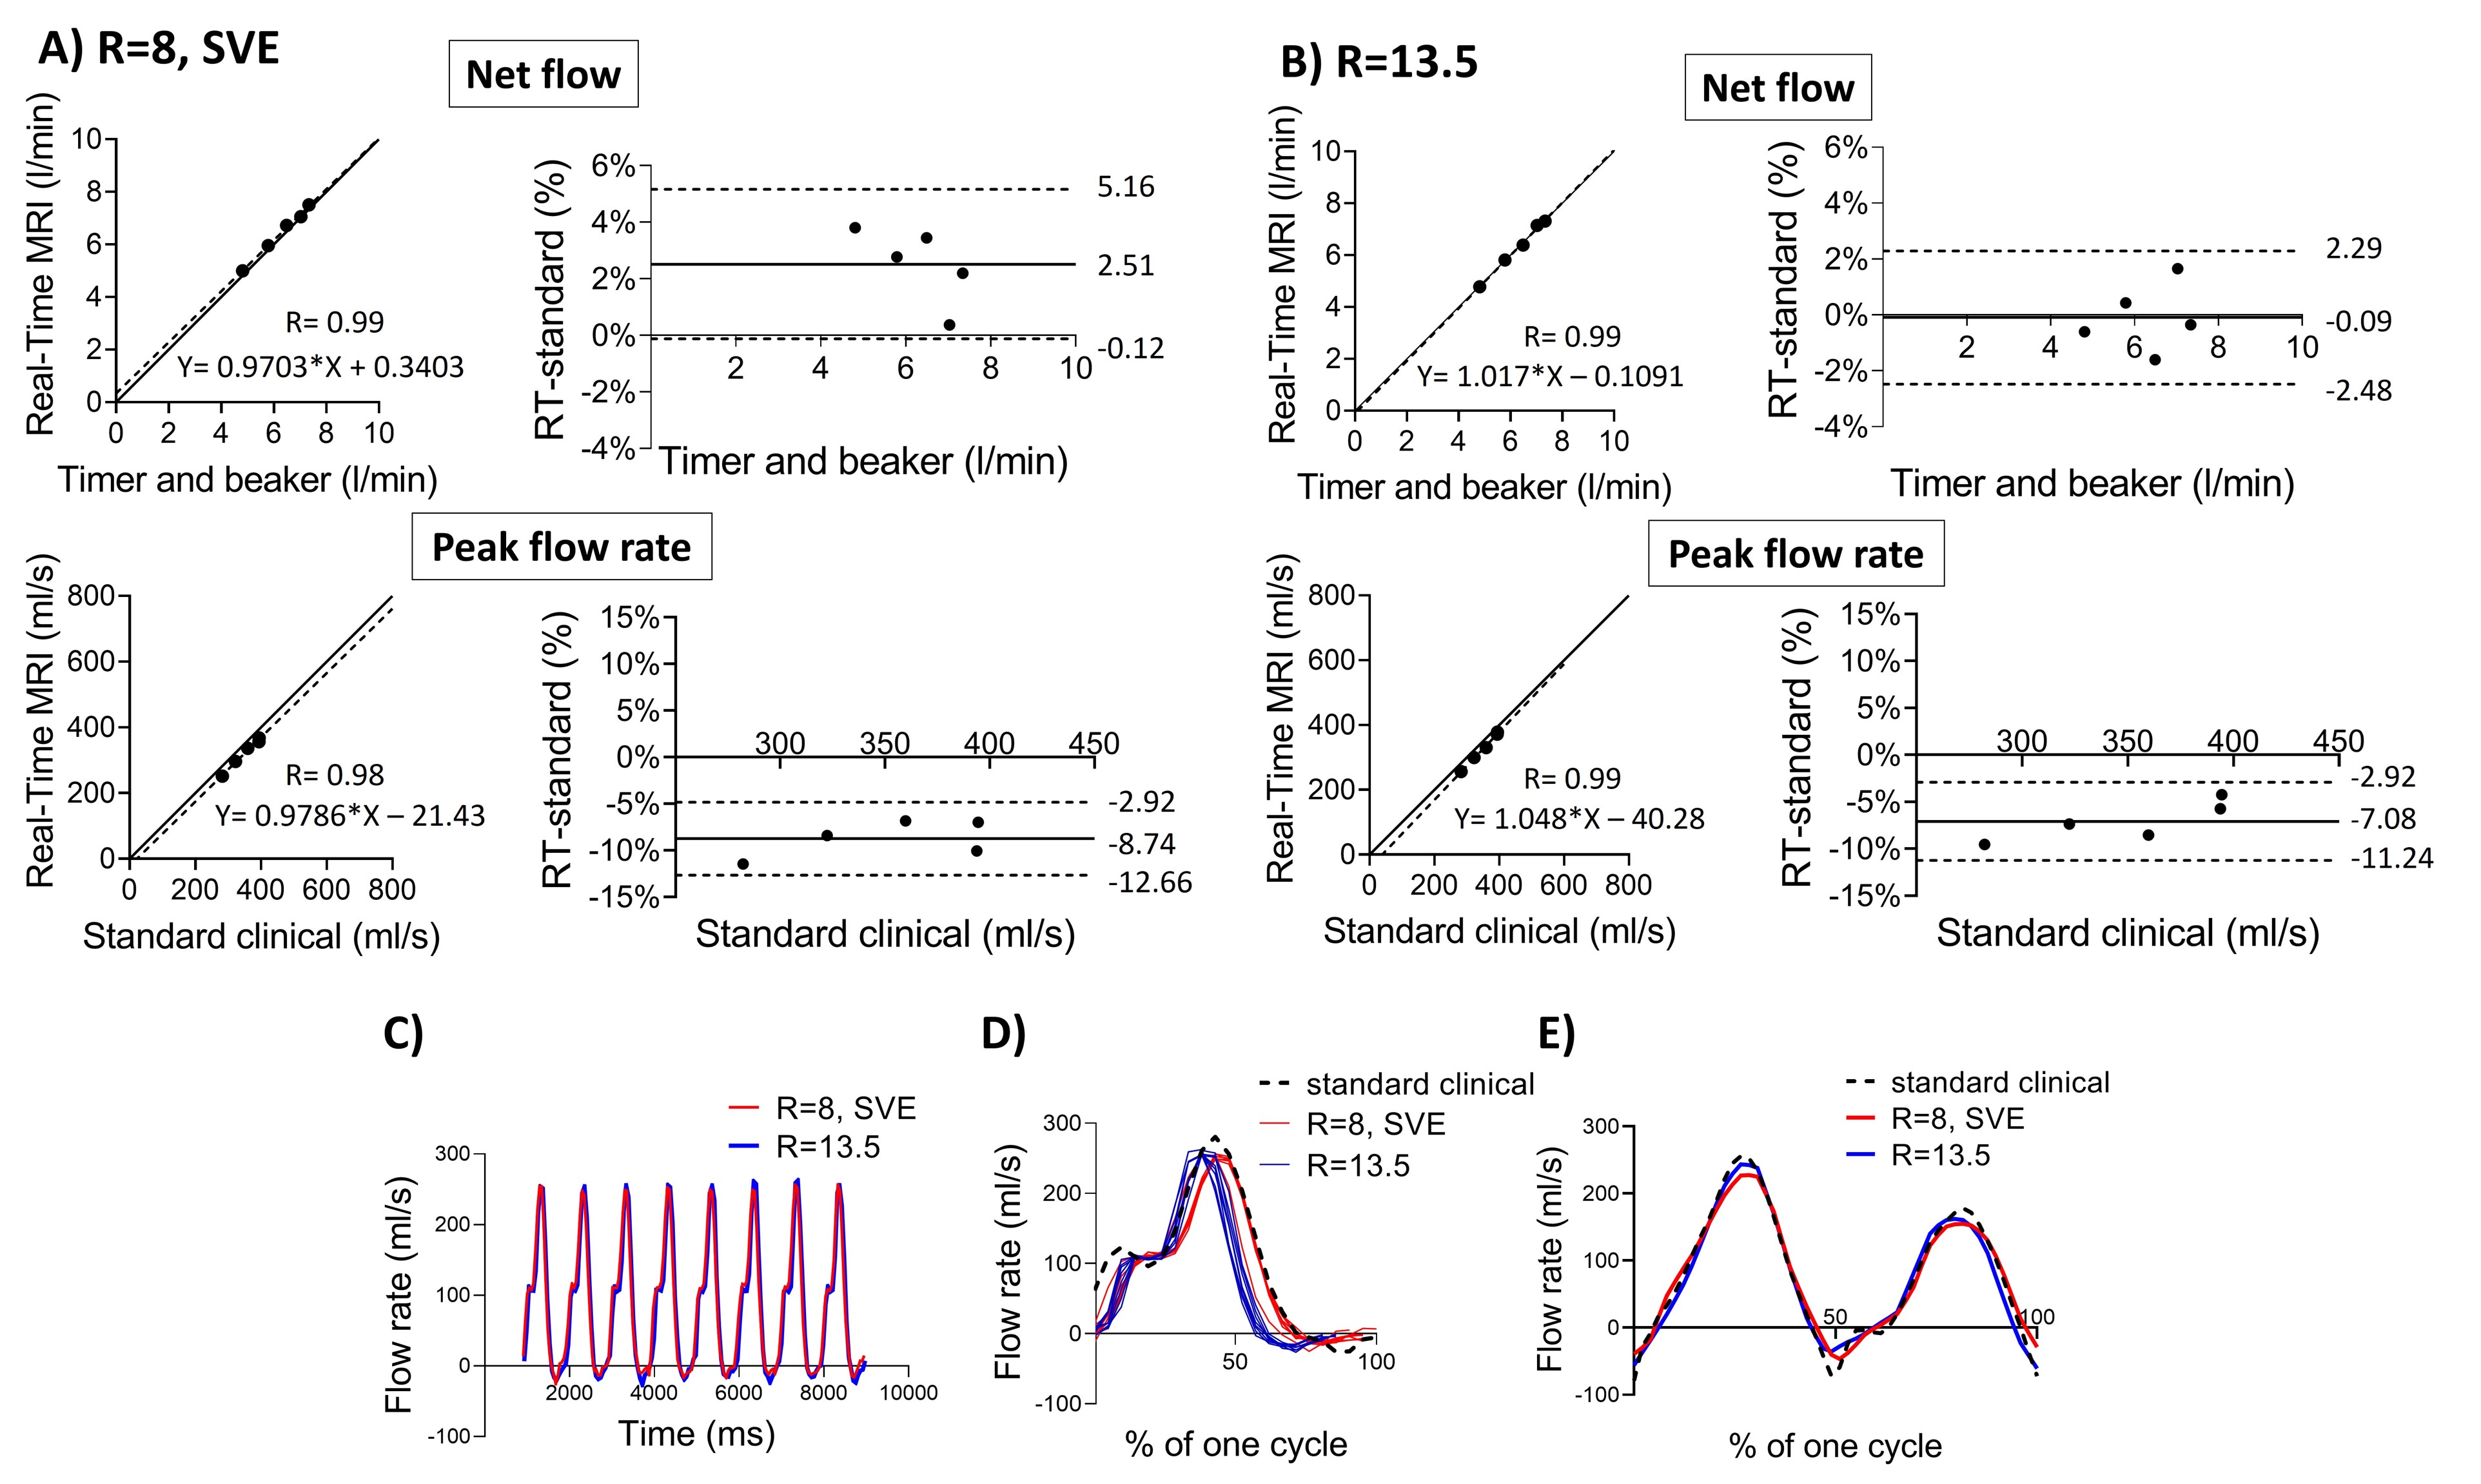
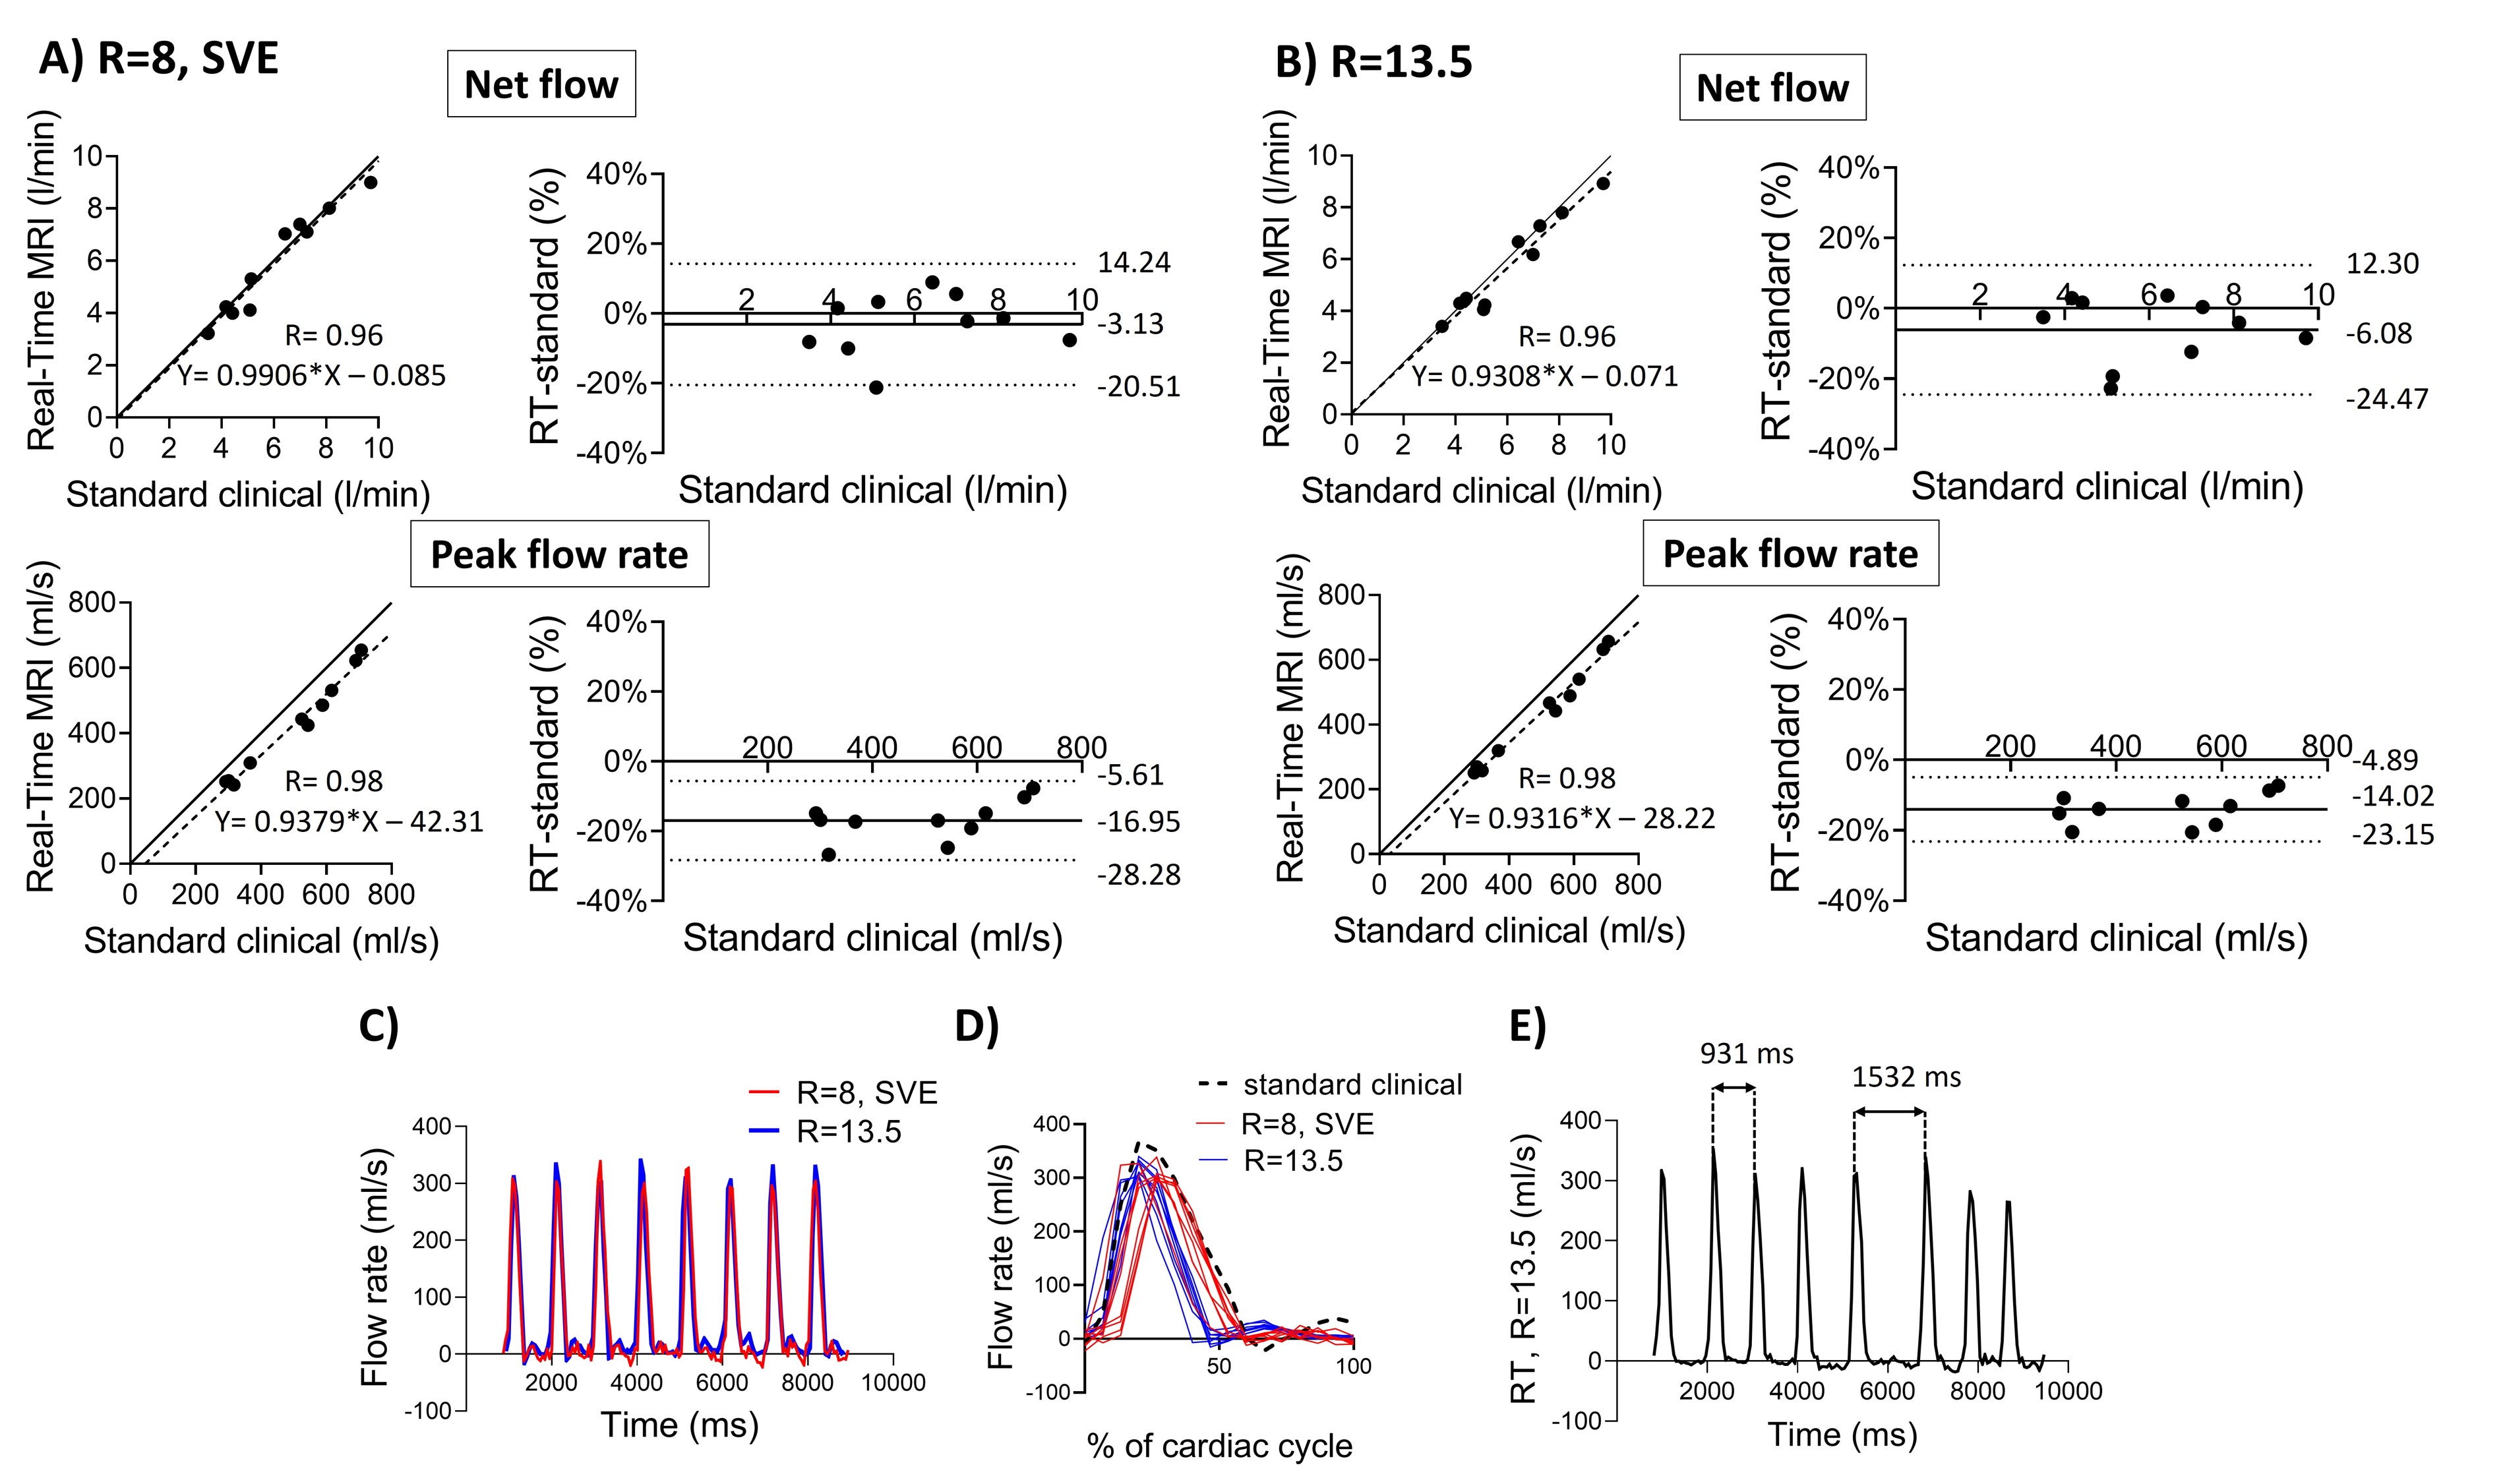
Images from the phantom scans are shown in Figure 3, Panel A. Timer and beaker before and after MRI differed less than 2% for all pump settings. Linear regression and modified Bland-Altman analysis of net and peak flow quantification are shown in Figure 4, Panel A for RT CS with R=8, SVE (net flow bias: 2.5±1.3%, peak flow rate bias: -8.7±1.9%) and Panel B for RT CS with R=13.5 (net flow bias -0.1%±1.2%, peak flow rate bias -7.1±2.1%). Figure 4, Panel C shows an example of an RT CS periodic flow curve in the phantom and in Panel D each cycle of this example is compared to the curve by the standard clinical sequence. Figure 4, Panel C shows how the sequences captured phantom non-periodic flow.Figure 3, Panel B shows images from one patient. Linear regression and modified Bland Altman analysis plots are shown in Figure 5, Panel A for RT CS with R=8, SVE (net flow bias=-3.1±8.9%, peak flow bias= -17.0±5.78%) and Panel B for RT CS with R=13.5 (net flow bias= -6.1±9.4%, peak flow bias=-14.0±4.7%). Figure 5, panel C shows an example of periodic flow in one of the non-arrhythmic patients where each cycle was compared to the corresponding curve as assessed by the standard clinical sequence (Panel D). Finally, Panel E shows how arrhythmic flow was captured in the atrial fibrillation patient with the RT (R=13.5) sequence.
Conclusion
Real-time PC MRI with online compressed sensing reconstruction can quantify net flow accurately but underestimates peak flow measurements. This is in line with previous studies using offline reconstructions2,3. Moreover, RT CS was feasible in a patient with arrhythmia, where gated flow imaging would fail.Acknowledgements
No acknowledgement found.References
1.Gatehouse PD, Keegan J, Crowe LA, et al. Applications of phase-contrast flow and velocity imaging in cardiovascular MRI. Eur Radiol. 2005;15(10):2172-2184.
2.Traber J, Wurche L, Dieringer MA, et al. Real-time phase contrast magnetic resonance imaging for assessment of haemodynamics: from phantom to patients. Eur Radiol. 2016;26(4):986-996.
3.Haji‐Valizadeh H, Guo R, Kucukseymen S, et al. Highly accelerated free‐breathing real‐time phase contrast cardiovascular MRI via complex‐difference deep learning. Magn Reson Med. 2021;86(2):804-819.
4.Sun A, Zhao B, Li Y, He Q, Li R, Yuan C. Real-time phase-contrast flow cardiovascular magnetic resonance with low-rank modeling and parallel imaging. J Cardiovasc Magn Reson. 2017;19(1):19.
5.Haji‐Valizadeh H, Feng L, Ma LE, et al. Highly accelerated, real‐time phase‐contrast MRI using radial k ‐space sampling and GROG‐GRASP reconstruction: a feasibility study in pediatric patients with congenital heart disease. NMR in Biomedicine. 2020;33(5). doi:10.1002/nbm.4240
6.Xiong Fei, et al. Highly Accelerated Free-Breathing Real-Time 2D Flow Imaging using Compressed Sensing and Shared Velocity Encoding. SCMR 25th annual scientific sessions (2022)
7.Lin HY, Bender JA, Ding Y, et al. Shared velocity encoding: A method to improve the temporal resolution of phase-contrast velocity measurements. Magnetic Resonance Medicine. 2012;68(3):703-710.
8.Heiberg E, Sjögren J, Ugander M, Carlsson M, Engblom H, Arheden H. Design and validation of Segment - freely available software for cardiovascular image analysis. BMC Med Imaging. 2010;10(1):1.
9.Lankhaar JW, Hofman MBM, Marcus JT, Zwanenburg JJM, Faes TJC, Vonk-Noordegraaf A. Correction of phase offset errors in main pulmonary artery flow quantification. J Magn Reson Imaging. 2005;22(1):73-79.
Figures