3656
Digital Twinning of Aortae from 2D+time MRI1Institute for Biomedical Engineering, University and ETH Zurich, Zurich, Switzerland
Synopsis
Keywords: Flow, Data Analysis, Aorta; Shape modelling; Shape reconstruction; Image-based shape reconstruction; Aortic shape reconstruction
We propose an automatic pipeline to generate digital twin aortae from 2D+time MRI slices. First, a statistical shape model is fitted to the segmentation of 2D slices over time and then local refinements are applied to closely match dynamics over time. The approach is exemplified on a dataset of 10 aortic stenosis patients on which we quantify the impact of the number of available slices on the reconstructed anatomy.
Introduction
4D Flow MRI offers time-resolved volumetric mapping of aortic anatomy and velocity vector fields1. Spatial resolution is typically (2.5 mm)3 and vessel-to-background contrast is often limited, compromising accurate segmentation of vessel cross-sections unless dedicated contrast agents are used2. To address corresponding segmentation challenges of native 4D Flow MRI scans, additional 2D+t slices can be acquired to augment or improve segmentations. Resulting vessel shapes could be used to expand existing datasets, to address particular data imbalances and to provide models for flow simulations3.Previous approaches of automated segmentation pipelines have been proposed, focusing either on segmentation4 or on shape modelling for static meshes from 4D Flow MRI data5. In this study we propose to build digital twin aortae of aortic stenosis patients by augmenting patient-specific 2D+time MRI slices with an anatomical prior based on a statistical shape model. Therefore, the question arises as to how many slices are actually necessary to sufficiently reconstruct patient-specific aortae. To this end, a varying number of 2D+time MRI slices of a cohort of 10 patients are used as input together with a statistical shape model to calculate the shape accuracy as a function of the number of slices.
Methods
Computer tomography (CT) datasets of aortae from two different sources were used to train the statistical shape model (SM). First, data of 20 patients (16 male and 4 female between 63 ± 18 years) were manually labelled using ITK-SNAP6. Second, to increase diversity, 12 pre-segmented subjects were included7. Principal component analysis (PCA) was used on the dataset after the registration of a reference surface to all cases. The SM was defined from the first 6 PCA bases, which allowed to capture 88% of the total variation seen in the dataset.2D cine balanced steady-state free precession slices with a temporal resolution of 40 frames per cardiac cycle acquired during a breath hold and with a spatial resolution of $$$1\times1\times5 \; \text{mm}^3$$$ were acquired in 10 patients with aortic stenosis on a 1.5 T MR system (Philips Healthcare, Best, The Netherlands). A total of 8 2D+t slices were distributed uniformly and orthogonally to the vessel centreline, covering the ascending and descending aortic arch, with each measurement covering 1-2 intersections with the aorta. Each slice evolution over time was segmented using 3D paintbrush mode in ITK-SNAP6.
For each patient, the SM was fitted to the segmented slices of the first time point and the shape was further adjusted to match the segmented contours. As previously proposed8, a patient-specific shape was obtained by optimizing the initial SM weights, as well as by smoothly deforming the mesh to match control points using a gradient descent algorithm. Given spatiotemporal correlations of aortic shapes, fitting of subsequent cardiac phases required only little adjustment to the original mesh.
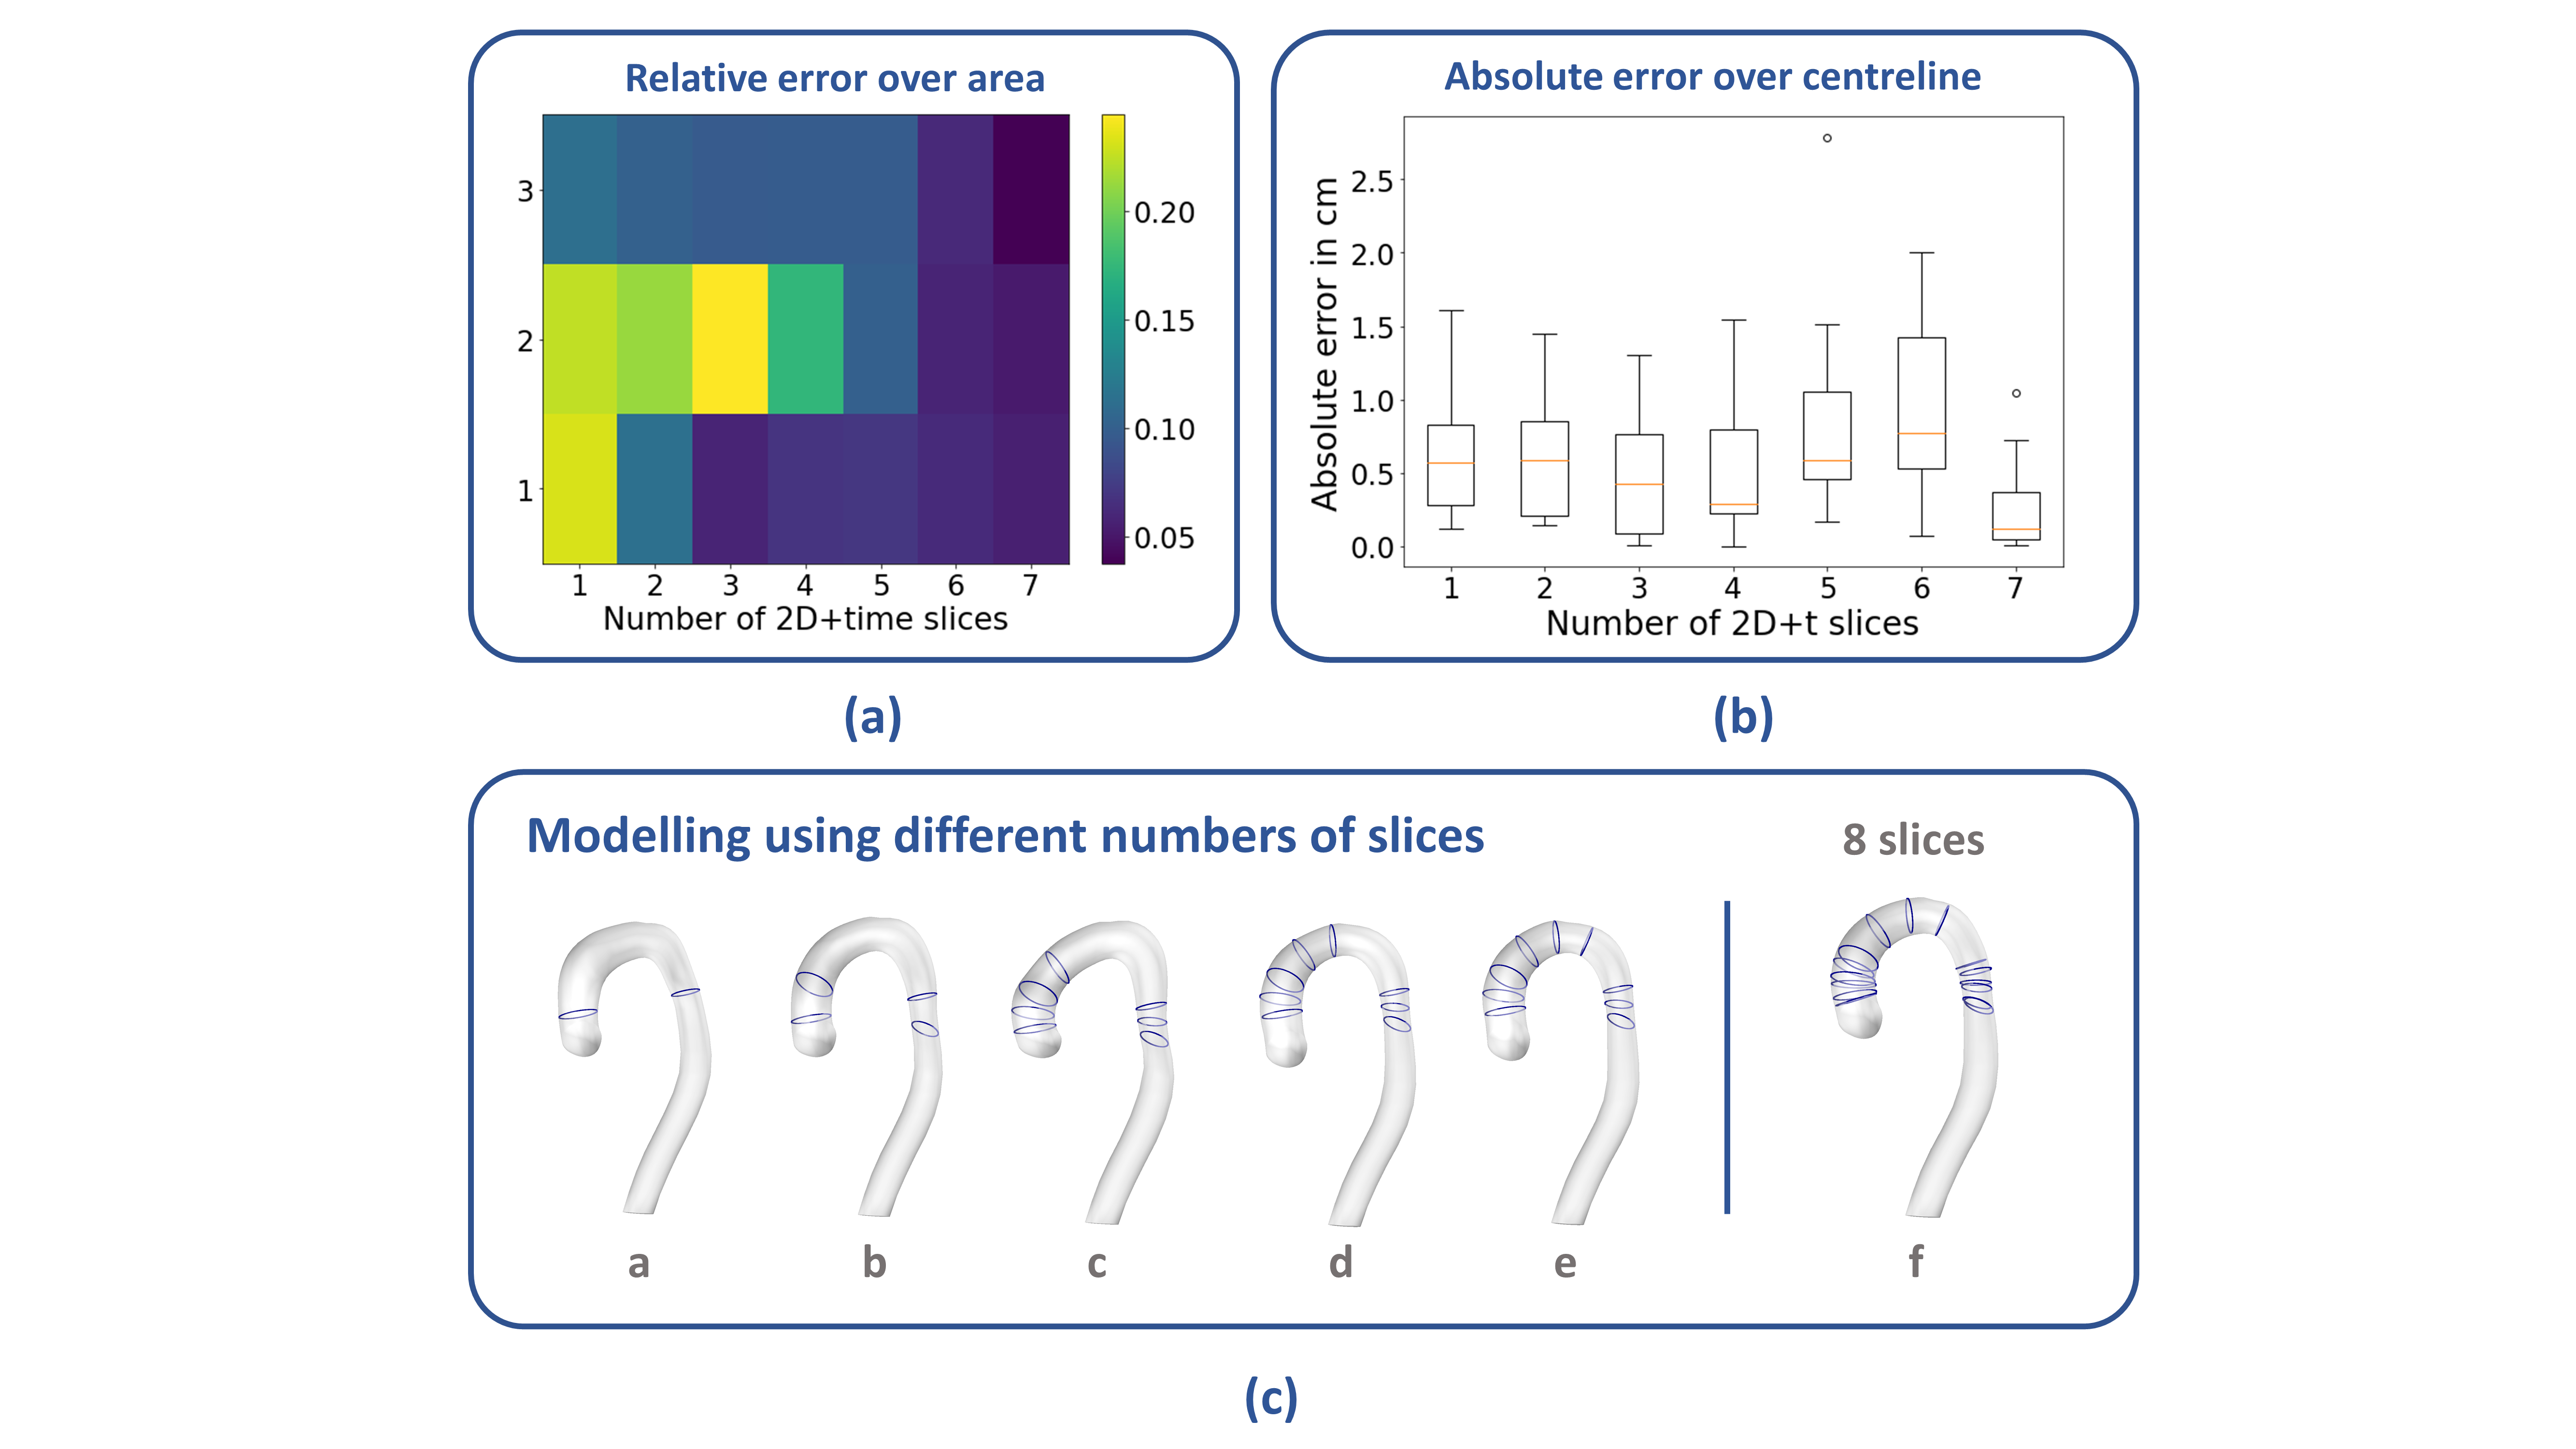
We analyse the effect of using varying numbers of 2D+t slices for the reconstruction, by iteratively including 1 up to 7 slices and comparing them to the case using all 8 slices, which is assumed to be the reference (Figure 2 (c)). We evaluate the performance of the method by computing: i) the relative error of the area of sections along the aortic arch (Figure 2 (a)) and ii) the absolute error between the centreline lengths (Figure 2 (b)), from comparing varying numbers of slices for the reconstruction and the complete dataset. We omit the descending aorta below the last intersection for calculations.
Results
Figure 2 (a) shows the relative error in area variation in the ascending arch as a function of the number of slices used for reconstruction with rows 1-3 corresponding to ascending, top and descending sections of the aortic arch. Figure 2 (a) shows, that the use of 5 slices for reconstruction gives a mean relative error of 0.089, compared to the reference data. Figure 2 (b) shows the absolute error in the centreline calculation as a function of number of slices. Figure 2 (c) shows the reconstruction of the aortic shape of a patient for varying number of slices (from 2, panel a, to 8, panel f).Discussion
We have presented a pipeline for generating time-resolved digital twin aortae from 2D+time MRI data, demonstrating that the total length of the arch as well as the cross-sectional area over the arch, can be captured by the shape model in combination with as few as 5 slices. This can potentially save valuable time in image acquisition and may simplify protocols.Acknowledgements
No acknowledgement found.References
1. Dyverfeldt P, Bissell M, Barker AJ, Bolger AF, Carlhäll CJ, Ebbers T, Francios CJ, Frydrychowicz A, Geiger J, Giese D, Hope MD, Kilner PJ, Kozerke S, Myerson S, Neubauer S, Wieben O, Markl M. 4D flow cardiovascular magnetic resonance consensus statement. J Cardiovasc Magn Reson. 2015 Aug 10;17(1):72. doi: 10.1186/s12968-015-0174-5. PMID: 26257141; PMCID: PMC4530492.
2. Hanneman
K, Kino A, Cheng JY, Alley MT, Vasanawala SS. Assessment of the precision and
reproducibility of ventricular volume, function, and mass measurements with
ferumoxytol-enhanced 4D flow MRI. J Magn Reson Imaging. 2016 Aug;44(2):383-92.
doi: 10.1002/jmri.25180. Epub 2016 Feb 12. PMID: 26871420; PMCID: PMC4947013.
3. Dirix P, Buoso S, Peper ES, Kozerke S, Zurich E, Zurich S. Synthesis of patient-specific multipoint 4D flow MRI data of turbulent aortic flow downstream of stenotic valves. Sci Reports |. 123AD;12:16004. doi:10.1038/s41598-022-20121-x
4. Berhane H, Scott | Michael, Mohammed Elbaz |, et al. Fully automated 3D aortic segmentation of 4D flow MRI for hemodynamic analysis using deep learning. Published online 2020. doi:10.1002/mrm.282572.
5. Romero P, Lozano M, Martínez-Gil F, Serra D, Sebastián R, Lamata P. Clinically-Driven Virtual Patient Cohorts Generation: An Application to Aorta. Front Physiol | www.frontiersin.org. 2021;12. doi:10.3389/fphys.2021.713118
6. Yushkevich PA, Piven J, Hazlett HC, et al. User-guided 3D active contour segmentation of anatomical structures: Significantly improved efficiency and reliability. Neuroimage. 2006;31(3):1116-1128. doi:10.1016/J.NEUROIMAGE.2006.01.015
7. Radl L, Jin Y, Pepe A, et al. Aortic Vessel Tree (AVT) CTA Datasets and Segmentations. January 2022. doi:10.6084/m9.figshare.14806362.v1
8. Joyce T, Buoso S, Stoeck CT, Kozerke S. Rapid inference of personalised left-ventricular meshes by deformation-based differentiable mesh voxelization. Med Image Anal. 2022;79:102445. doi:10.1016/J.MEDIA.2022.102445
Figures
Figure 1: Digital twinning pipeline: 2D+time MRI slices of aortic stenosis patients (lower left) are taken as input to generate the vessel shapes over time. The segmentation masks of the 2D MRI data are augmented with a statistical shape model (upper left) based on principal component analysis. During reconstruction, the shape model defines the initial anatomy, which is then adjusted to match the segmentation target at t=0 (lower centre). The initial mesh is then deformed over time, matching the segmentation targets over the cardiac cycle (right).