3652
Supervised automation of “whole-chest” 4D flow MRI analysis from original DICOM files to quantification of aortic pulse wave velocity1Department of Radiology, Northwestern University, Chicago, IL, United States
Synopsis
Keywords: Flow, Data Processing
Analysis of pulse wave velocity by 4D flow MRI usually involves a manual processing pipeline with multiple steps of active use. We set out to automate the entire pipeline from original DICOMs to parameter quantification for evaluation of “whole-chest” 4D flow MRI. A deep learning algorithm trained on aortic acquisitions was used to facilitate segmentation. The supervised automation pipeline allowed for shorter analysis times and less user interaction, enabling the user to focus on refining aortic segmentations generated by deep learning. Results were comparable, but additional work including adjustment of preprocessing settings and retraining of CNN is warranted for optimization.INTRODUCTION
Pulse wave velocity (PWV) is a key clinical parameter for the assessment of aortic stiffness. 4D flow MRI has demonstrated promising utility for the quantification of aortic PWV 1-4. However, analysis can be time-consuming and usually involves multiple active steps and software platforms, which can be limiting for clinical translation (Figure 1: left). Preprocessing—including eddy current correction, velocity aliasing unwrapping, noise masking, and calculation of a phase contrast MR angiogram (PC-MRA)—is performed manually using an in-house MATLAB GUI taking about 15 min. Segmentation is performed manually based on the PC-MRA using a dedicated segmentation software (Mimics, Materialise, Belgium) taking about 15 min. Postprocessing, including data reformatting and quantification of PWV, is performed as batch using an in-house MATLAB code taking about 5 min. Thus, in total the analysis pipeline usually takes about 35 min per participant with 30 min (86%) of active analysis time and only 5 min (14%) of unattended time. Recently, our group has developed deep learning algorithms for processing of aortic 4D flow MRI acquired in the sagittal oblique orientation 5. The goal of this work was to develop an automated workflow that enables batch processing of “whole-chest” 4D flow MRI from original DICOMs to quantification of aortic PWV.METHODS
Whole-chest 4D flow MRI was acquired in 17 healthy participants (age = 53.5 ± 16.3 [25-76] years) at 3T (MAGNETOM Prisma, Siemens Healthcare, Erlangen, Germany) using a prototype free-breathing 4D flow MRI sequence (venc = 120-150 cm/s, compressed sensing R = 10.2, 2.5×2.5×2.5 mm3, temporal resolution = 41.3 ms, imaging time = 6-8 min) with coronal orientation and spatial coverage of the entire chest. This sequence requires minimal preparation (e.g., minimal spatial adjustments, retrospective cardiac gating, and no respiratory navigator setting). Our semi-automated pipeline (Figure 1: right) included: 1) Preprocessing performed as batch using a uniform set of typical threshold values for eddy current, noise masking and anti-aliasing corrections. 2) Segmentation facilitated by our recently developed convolutional neural network (CNN), i.e., trained on manual segmentations generated from sagittal-oblique acquired 4D flow MRI as ground truth (N = 499 training, N = 101 validation, N = 418 testing)5. To reduce islands, automatic erosion, area opening, and dilation of segmentations was performed. Also, each segmentation was assessed by the user and edited if needed. 3) Postprocessing of data including automated quantification of PWV. Results were compared to those from our standard manual analysis processing pipeline that includes an established workflow 1, i.e., preprocessing using in-house MATLAB GUI, segmentation using dedicated software, and automated postprocessing of PWV.RESULTS
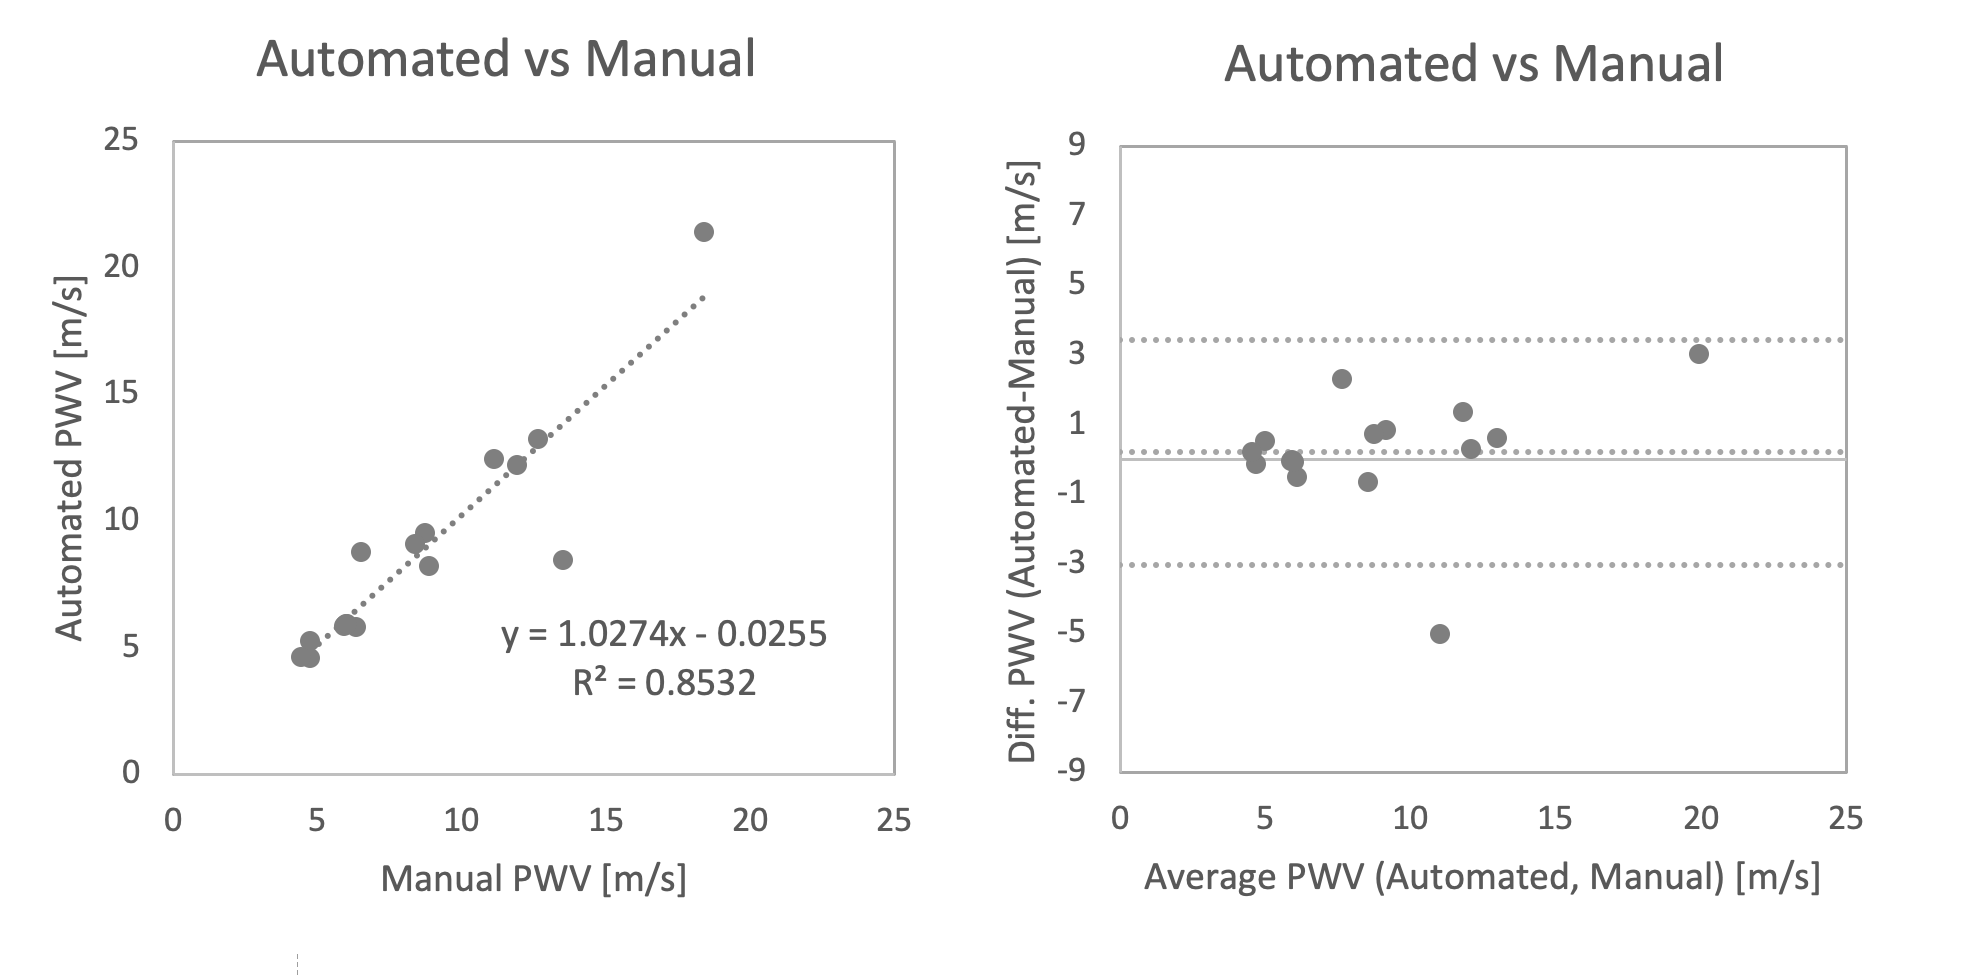
Our new supervised automation analysis pipeline required approximately 26 min per participant with 11 min +/- 2 min (42% +/- 8%) of active or “supervised” analysis time: 1) Preprocessing times were approximately 10 min per participant and were performed as batch. 2) Every segmentation required at least 5 min of active analysis time to view the CNN segmentations in dedicated software and assess whether edits were needed. Edits were performed for all segmentations and took an additional 6 min on average. Typical edits involved adding or removing portions of the aortic root and ascending aorta (Figures 2-3, respectively). Like the manual pipeline, truncation of the descending aorta at the level of the diaphragm was performed to address noise due to free breathing. 3) Postprocessing of data required approximately 5 min per participant and was performed as batch. See examples in Figure 4. ICC was 0.92 (p<.001), indicating excellent reliability, with bias +/- LOA = 0.2 m/s (2%) +/- 3.2 m/s (38%). See Figure 5. Average absolute percent difference was 10%.DISCUSSION
The proposed supervised automated analysis pipeline proved feasible with comparable results to standard manual analysis. Typical analysis times were reduced by approximately 9 min, and the pipeline went from mostly active to mostly unattended time. This enabled the user to focus their active time on adjusting segmentations in key areas such as the aortic root and ascending aorta. Some variation in PWV values were observed and warrant further study. Preprocessing was fully automated but relied on hard-coded values. Future work will evaluate the effects of systematic variation of those values and potential use of a CNN 6 for setting them. The automatically generated CNN segmentation provided a helpful starting point but care still needed to be taken to assess and manually refine. Considering the CNN was not trained on whole-chest data, these results are encouraging. We think this is a promising application for deep learning and plan to retrain the CNN to include whole-chest, coronal data once more has been collected.CONCLUSION
Supervised automated processing of whole-chest 4D flow MRI resulted in shorter analysis times and user interaction only for key decision-making steps (e.g., refining segmentations) while still producing comparable PWV results. This is a promising update to the 4D flow MRI pipeline because users can focus on refining segmentations instead of repetitive tasks that can be automated. These automation efforts are critical for the application of 4D flow MRI in large-scale research studies and clinical use. Future steps include systematic adjustment of preprocessing settings and retraining of CNN using whole-chest 4D flow MRI.Acknowledgements
Grant Support: NIH NIA P30AG059988References
1. Jarvis, K., et al. Aortic Pulse Wave Velocity Evaluated by 4D Flow MRI Across the Adult Lifespan. J Magn Reson Imaging (2022).
2. Harloff, A., et al. Determination of aortic stiffness using 4D flow cardiovascular magnetic resonance - a population-based study. Journal of cardiovascular magnetic resonance : official journal of the Society for Cardiovascular Magnetic Resonance 20, 43 (2018).
3. Soulat, G., et al. Changes in segmental pulse wave velocity of the thoracic aorta with age and left ventricular remodelling. An MRI 4D flow study. Journal of hypertension 38, 118-126 (2020).
4. Johnson, E.M.I., et al. Global Aortic Pulse Wave Velocity is Unchanged in Bicuspid Aortopathy With Normal Valve Function but Elevated in Patients With Aortic Valve Stenosis: Insights From a 4D Flow MRI Study of 597 Subjects. J Magn Reson Imaging (2022).
5. Berhane, H., et al. Fully automated 3D aortic segmentation of 4D flow MRI for hemodynamic analysis using deep learning. Magn Reson Med (2020).
6. Berhane, H., et al. Deep learning-based velocity antialiasing of 4D-flow MRI. Magn Reson Med 88, 449-463 (2022).
Figures