3650
Deep learning-based prediction of aortic hemodynamics obtained by 4D flow MRI using seismocardiography of chest vibrations1Radiology, Northwestern University, Chicago, IL, United States, 2Ann & Robert H. Lurie Children’s Hospital, Chicago, IL, United States, 3Northwestern University, Chicago, IL, United States
Synopsis
Keywords: Flow, Heart
We pursued a deep learning approach to investigate the utilization of a wearable seismocardiography (SCG) device to predict measures of flow similar to those obtained using 4D flow MRI. SCG can measure the chest vibrations caused by cardiac mechanical activities such as valve closures and changes of pulsatile flow. We hypothesized that deep learning can be used to infer the pathological changes in blood flow, such as a higher systolic peak velocity (Vmax) in patients with aortic valve diseases, from the SCG signals.Introduction
Phase-contrast MRI (PC-MRI) has become a vital tool for functional assessment of blood flow within heart and its associated vessels. Among different PC-MRI techniques, 4D flow MRI provides the most comprehensive assessment of cardiovascular hemodynamics such as changes in pulsatile blood flow in patients with heart valve disease [1]. However, despite advances in developing efficient 4D flow protocols [2], this technique is considered to be costly and relatively time-consuming. Therefore, developing surrogate techniques to obtain a quick and cost-effective preliminary evaluation of flow metrics prior to prescribing a comprehensive 4D flow MRI is highly valuable. In a study of 77 subjects, we pursued a deep learning approach to investigate the utilization of a wearable seismocardiography (SCG) device to predict measures of flow similar to those obtained using 4D flow MRI. SCG can measure the chest vibrations caused by cardiac mechanical activities such as valve closures and changes of pulsatile flow [3]. We hypothesized that deep learning can be used to infer the pathological changes in blood flow, such as a higher systolic peak velocity (Vmax) in patients with aortic valve diseases, from the SCG signals.Methods
This study was approved by our IRB, and informed consent was provided by all study participants to undergo research CMR assessment and a two-minute SCG measurement on the same day. We recruited 46 healthy control subjects (20 females, age: 45.9 ± 17.2 years) and 31 patients with aortic valve disease (6 females, age: 32.6 ± 20.9 years). Within patients, 1 subject had a tricuspid aortic valve (TAV), 21 had bicuspid aortic valve (BAV), and 9 had mechanical valve implants. In addition, 2, 6, and 4 patients were diagnosed with mild, moderate, and severe aortic stenosis (AS), respectively.4D flow MRI (spatial resolution: 1-3 mm3, temporal resolution: 30-40 ms, venc = 150-375 cm/s, 1.5T or 3T) was performed during free breathing with navigator respiration control and full volumetric coverage of the thoracic aorta. 4D flow data analysis included preprocessing (eddy current correction, velocity anti-aliasing) and application of a previously-developed deep learning tool to automatically derive a 3D segmentation of the thoracic aorta [4]. The 3D aorta segmentation was used to mask the 4D flow velocity data and the ascending aorta (AAo) was manually delineated from root to branching vessels. A custom code in MATLAB was used to derive a peak systolic velocity Vmax map in the AAo (Fig. 1(a)).
We used a wearable SCG sensor incorporating a MEMS accelerometer to acquire the SCG signals [5]. All SCG pulses were preprocessed (high-pass filtering and wavelet hard thresholding), and Signal Quality Index (SQI) based on dynamic time warping was used to identify and remove the outliers for each subject (Fig. 1(b-d)) [6]. The continuous wavelet transform (CWT) was used to obtain the time-frequency representation of the remaining SCGs. The absolute CWT coefficients resulted in the SCG scalograms (Fig. 2(a-b)), which were used as the input to a convolutional neural network (CNN) to predict Vmax in the AAo. The 4D flow MRI-derived Vmax served as the ground truth. To incorporate the patient demographic information, a multi-layer perceptron (MLP) was added to create a mixture deep neural network (DNN) model (Fig. 2(c)). The CNN architecture comprised 6 convolutional units, while the MLP was composed of 2 Dense layers. The outputs of MLP and CNN were concatenated and fed to a linear activation unit to generate Vmax. To investigate the model performance, 80% of all SCG pulses (total number = 6249) were used for training and the remaining 20% were reserved for testing over five random trials. To compare the results obtained using deep learning and 4D flow MRI, we statistically investigated the linear correlation coefficient and Bland-Altman limits of agreement between two techniques.
Results
The Vmax predicted by DNN were in good agreement with 4D flow derived Vmax, as demonstrated by a low MSE of 0.2 m/s between two methods over the five random trials. Figure 3(a) shows the DNN-predicted Vmax versus the velocities obtained by 4D flow MRI averaged over the five iterations. The y-axis gives the average of all Vmax values obtained using all scalograms of each subject in the test set. There was a strong linear correlation between estimated and measured Vmax (y = 0.89x, r = 0.76, p<0.01). Furthermore, Fig. 2(b) provides the Bland-Altman plot of Vmax for DNN vs. 4D flow MRI, indicating low, non-significant bias (-0.08 m/s, p = 0.18) and moderate limits of agreement (±0.86 m/s).Concolusion
We demonstrated that the scalograms of the chest SCG recordings can predict the aortic Vmax using a DNN. A key limitation of this study is the unbalanced distribution of subjects. Because most subjects were healthy, only a small fraction of training set samples had a velocity greater than 2 m/s, which made the accurate prediction of higher peak velocities more challenging, Future direction involves recruiting more patients with aortic valve diseases. Overall, this study suggests that cardiac SCG obtained using low-cost wearable electronics may be utilized as a supplement to CMR exams to stratify aortic-valve disease severity or as a screening tool when advanced imaging such as 4D flow MRI is not available.Acknowledgements
No acknowledgement found.References
[1] Soulat et al. Annu. Rev. Biomed. Eng. 2020; 22: 103-26
[2] Taebi et al. Vibration 2019; 2:64-86
[3] Tariq et al. J. Magn. Reson. Imaging 2013; 37: 1419–26
[4] Berhane et al. Magn. Reason. Med. 2020; 84: 2204-18
[5] Johnson et al. Ann Biomed. Eng. 2020; 48: 1779–92
[6] Zai et al. IEEE. Trans. Biomed. Eng. 2021; 68(6): 1759-67Figures
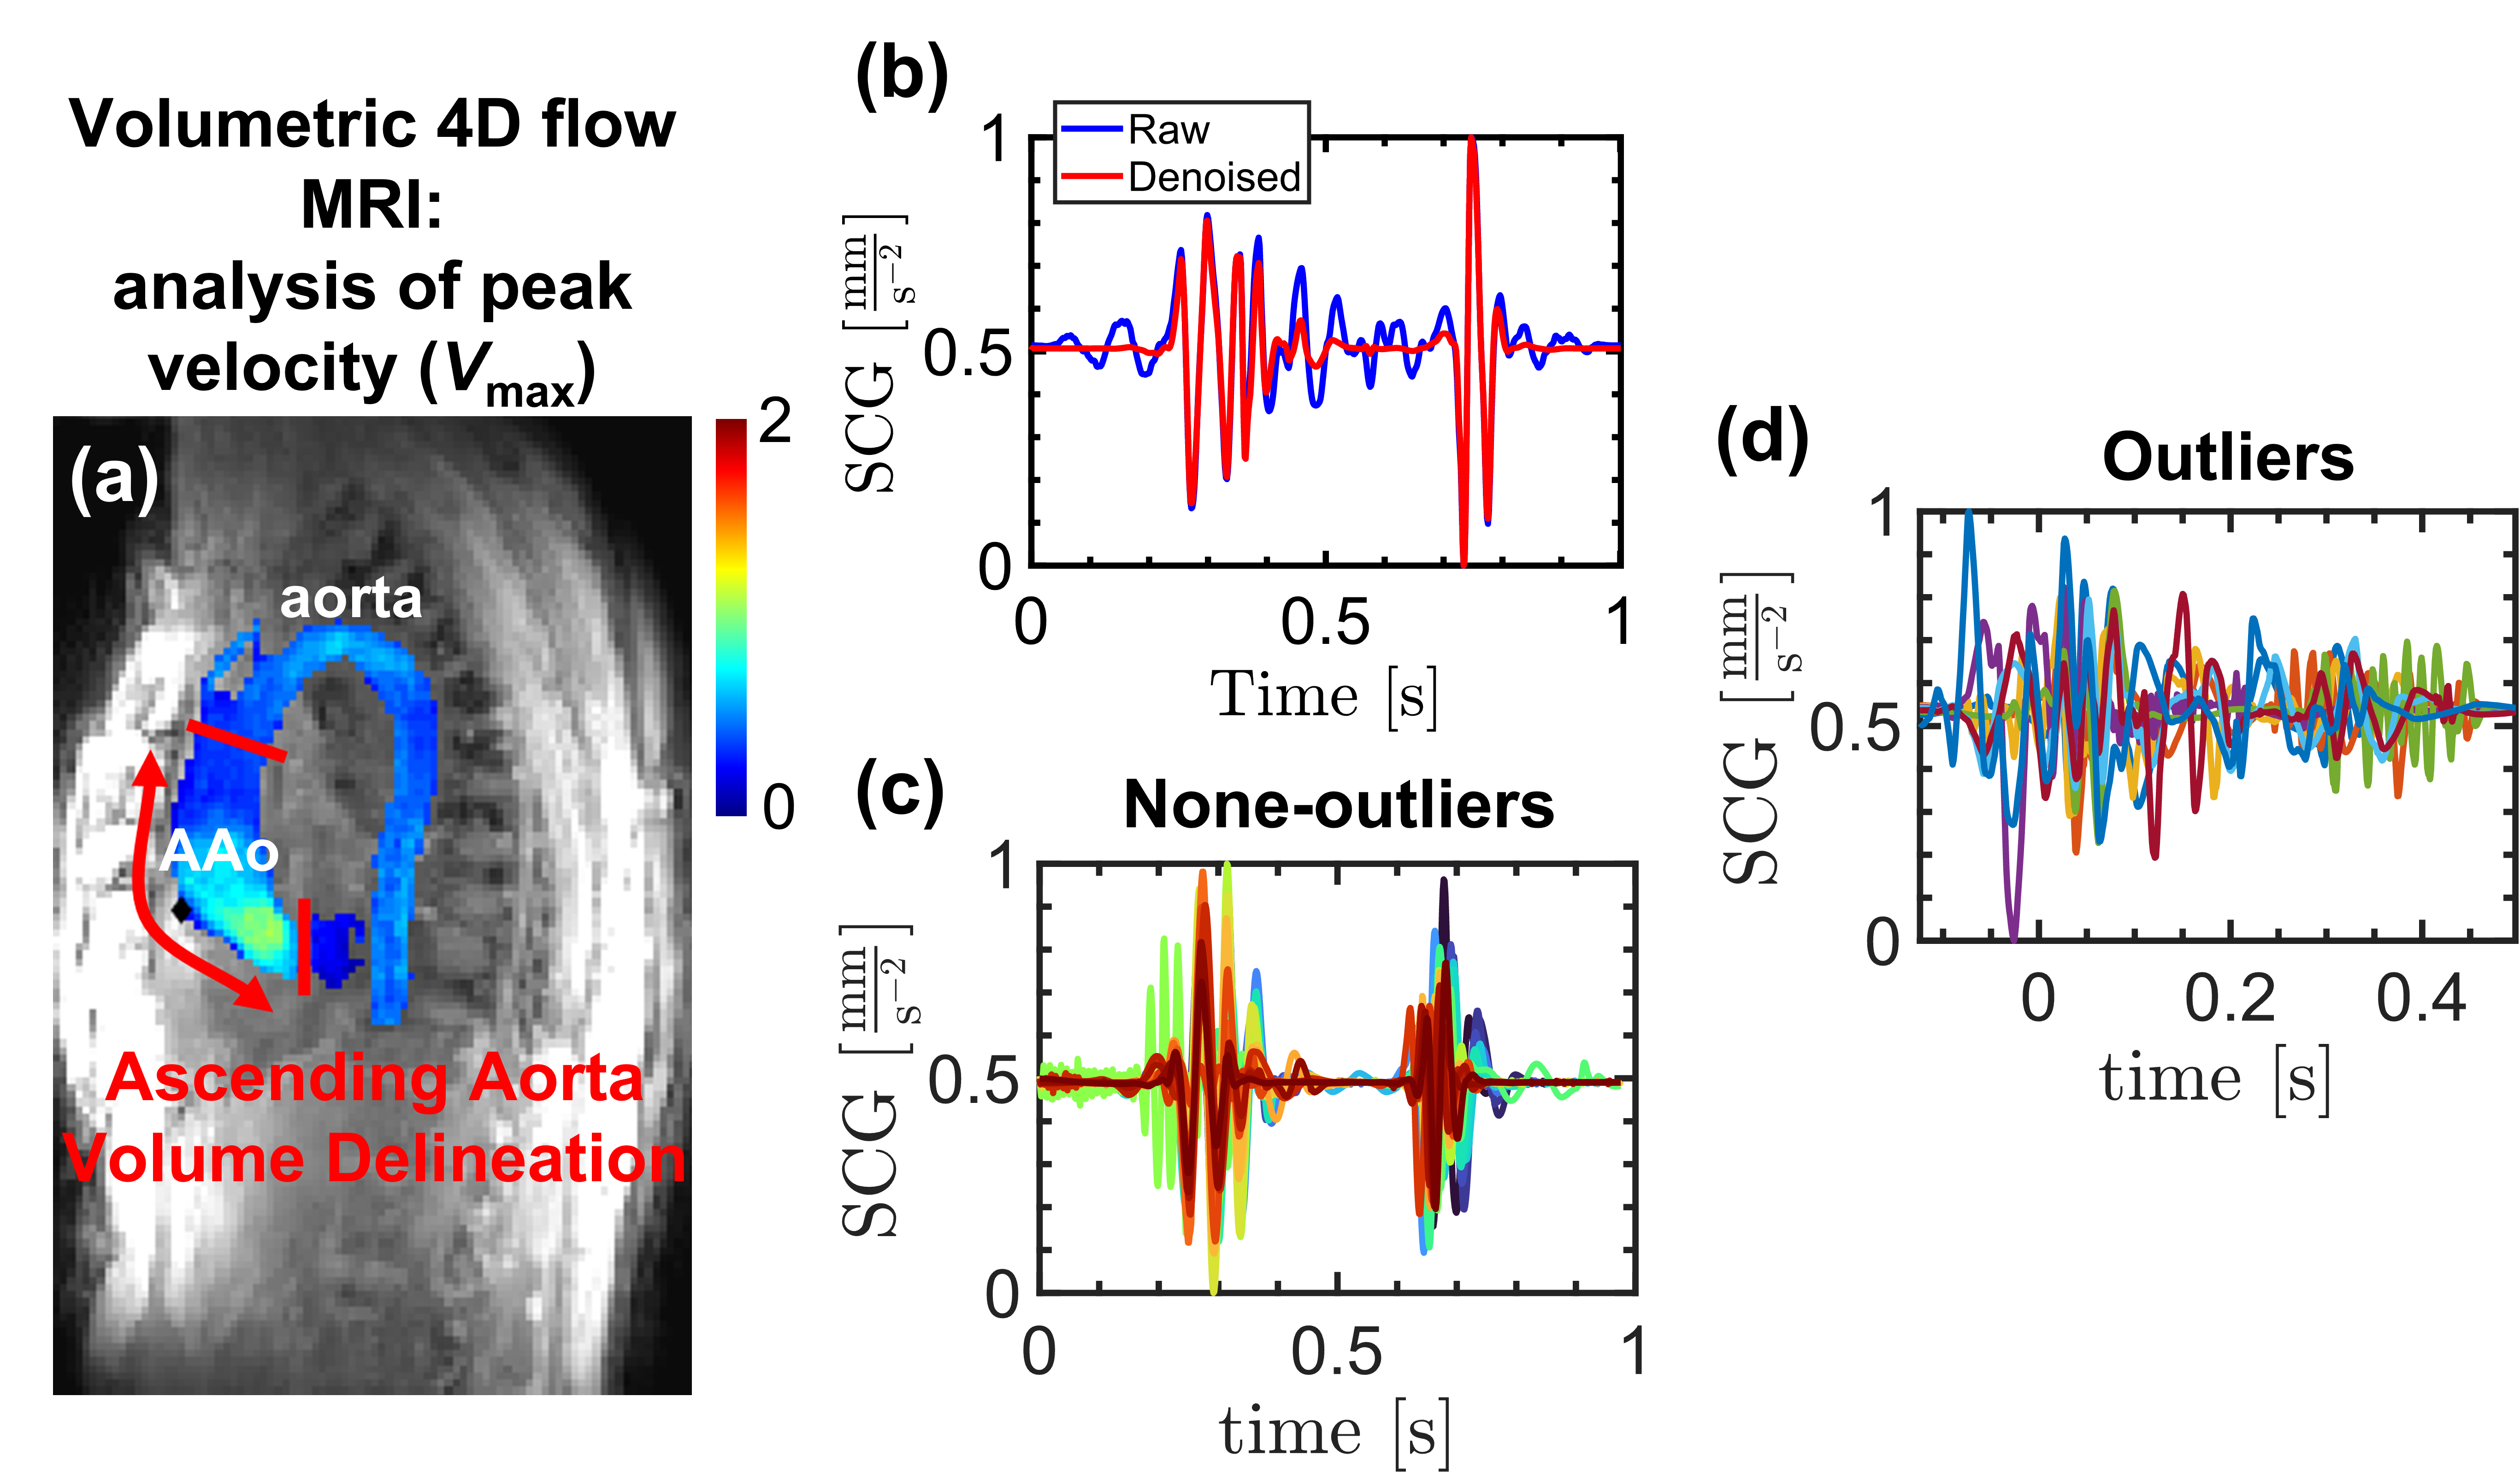
Fig. 1. (a) derivation of Vmax using 3D-segmentation of the aorta in 4D flow MRI measurements, (b) comparison of a raw and denoised SCG pulse, (c), (d) the none-outlier and outlier pulses identified based on SQI for a control subject.
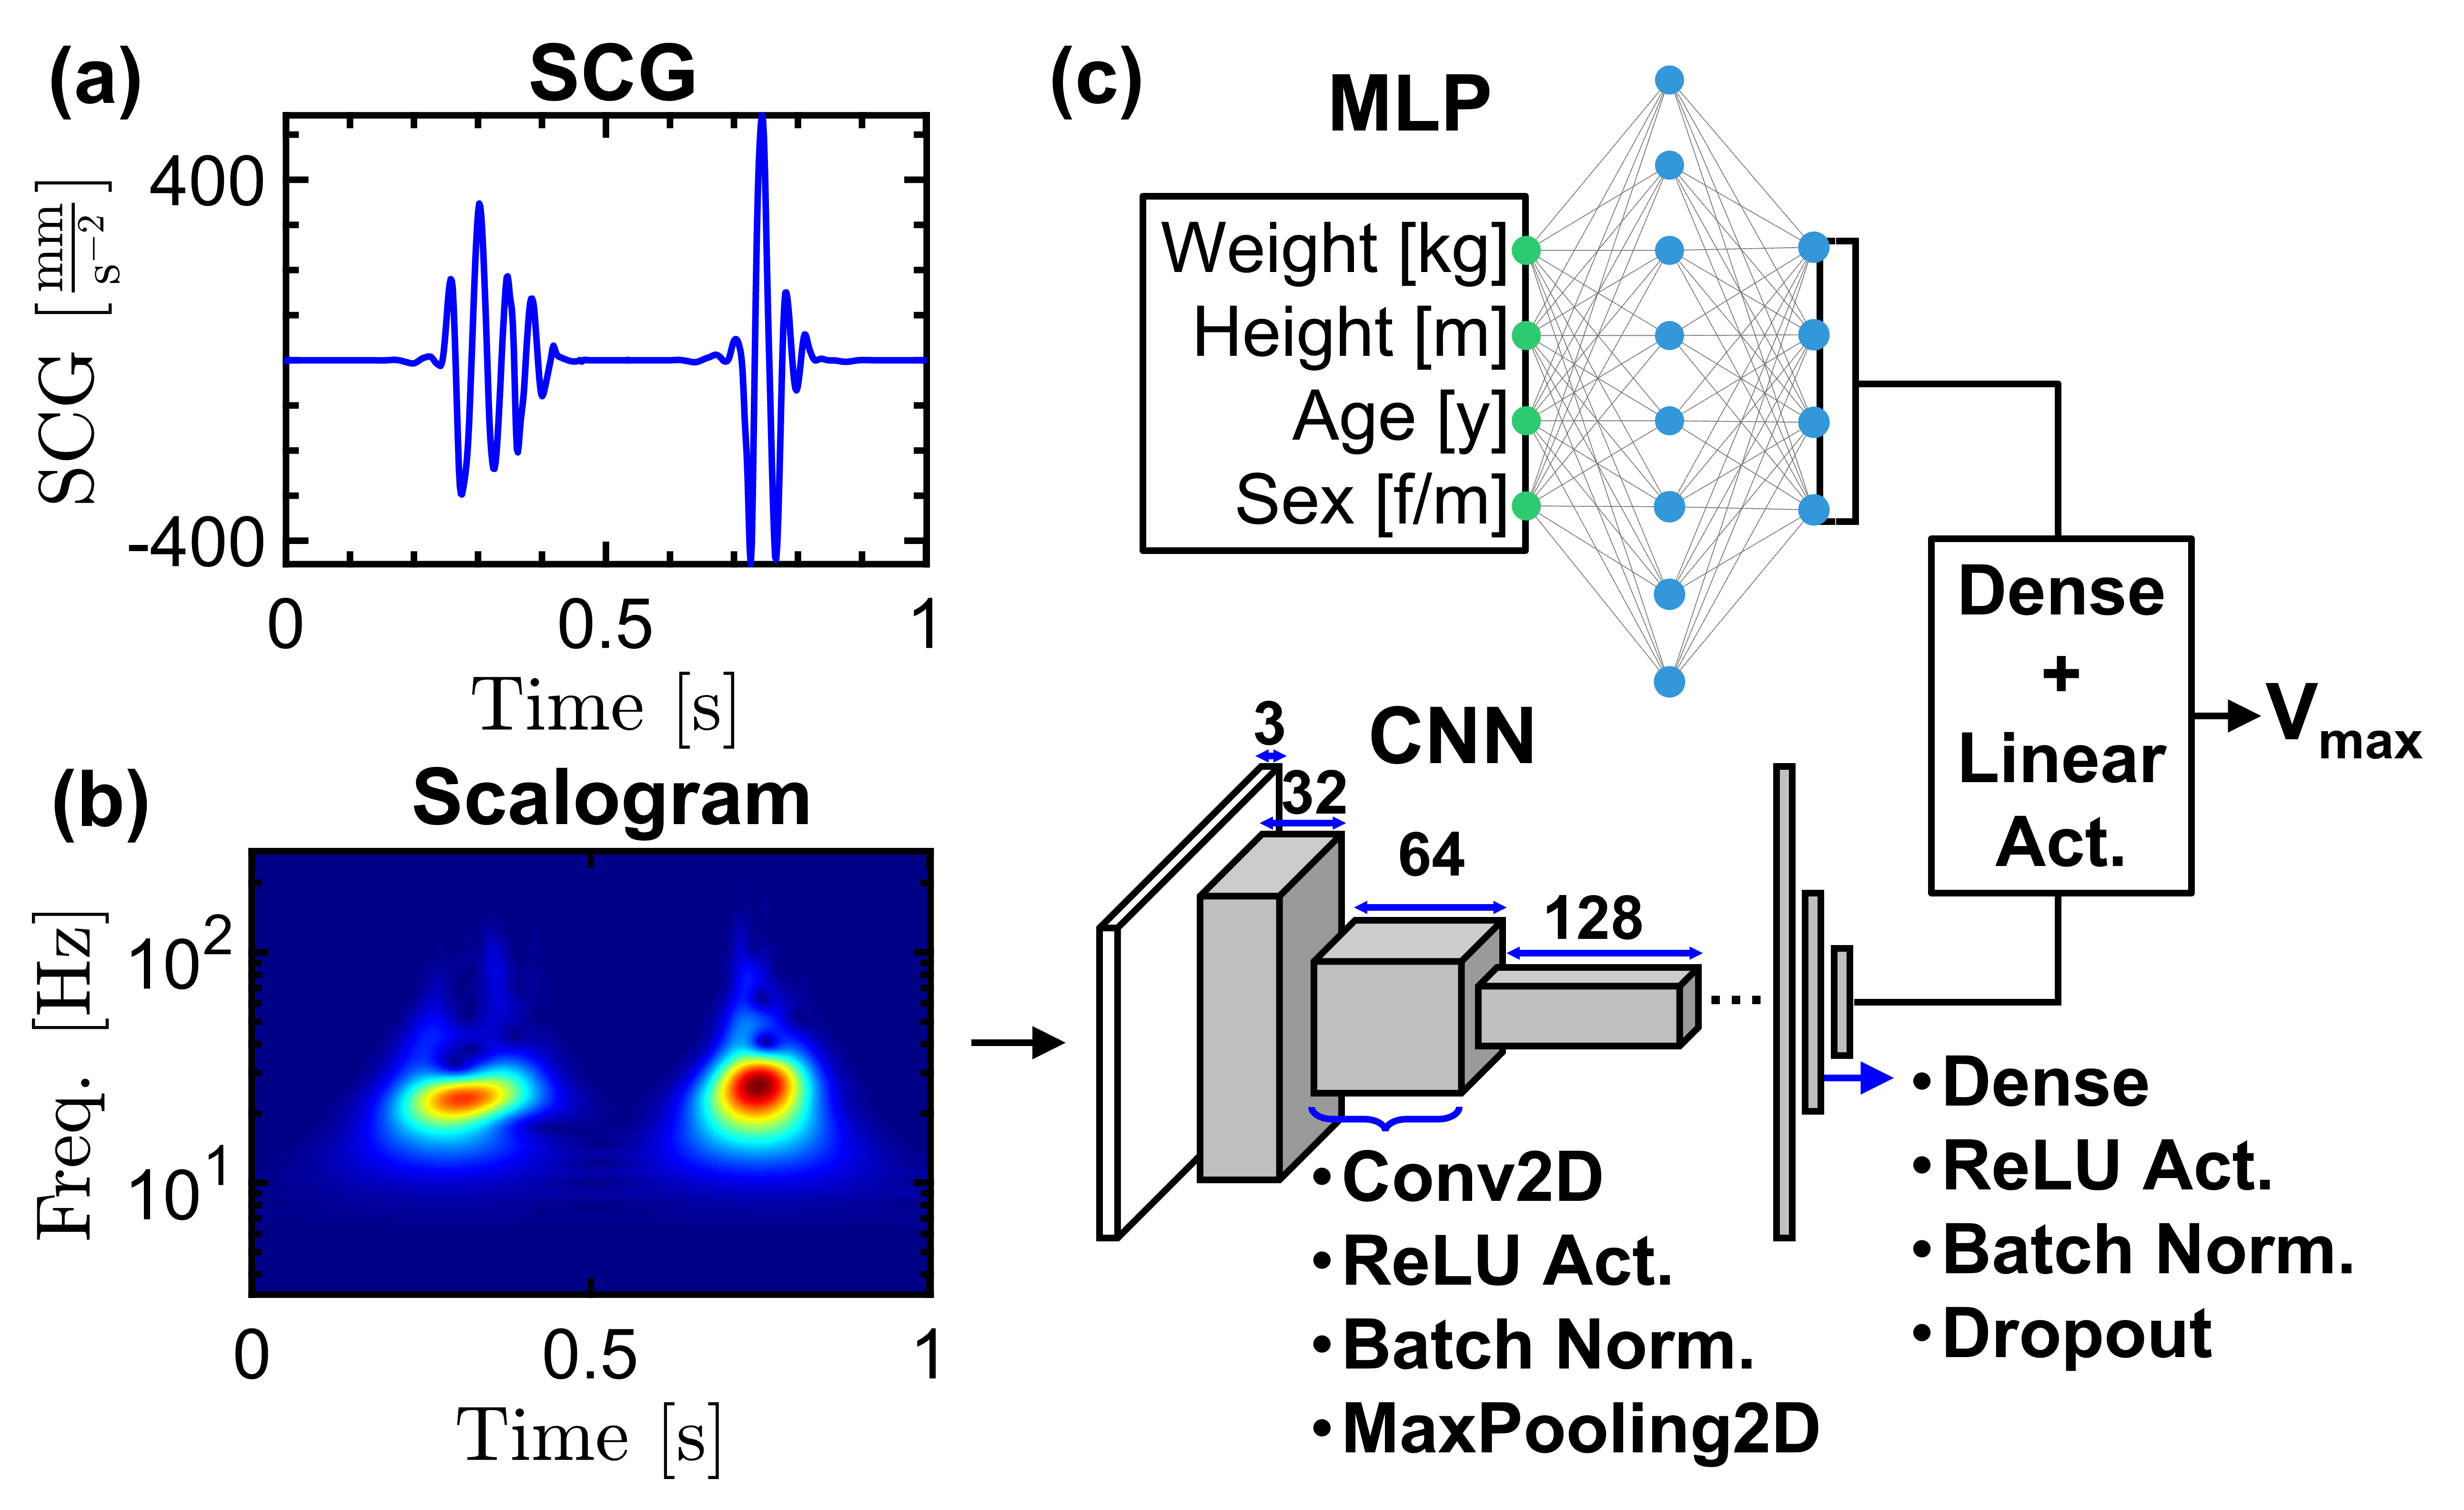
Fig 2. (a) an example SCG pulse, (b) the scalogram of the signal shown in (a), (c) a mixture DNN model composed of a MLP and a CCN to predict the aortic Vmax based on the demographic information of the subjects and scalograms of the SCG signals.
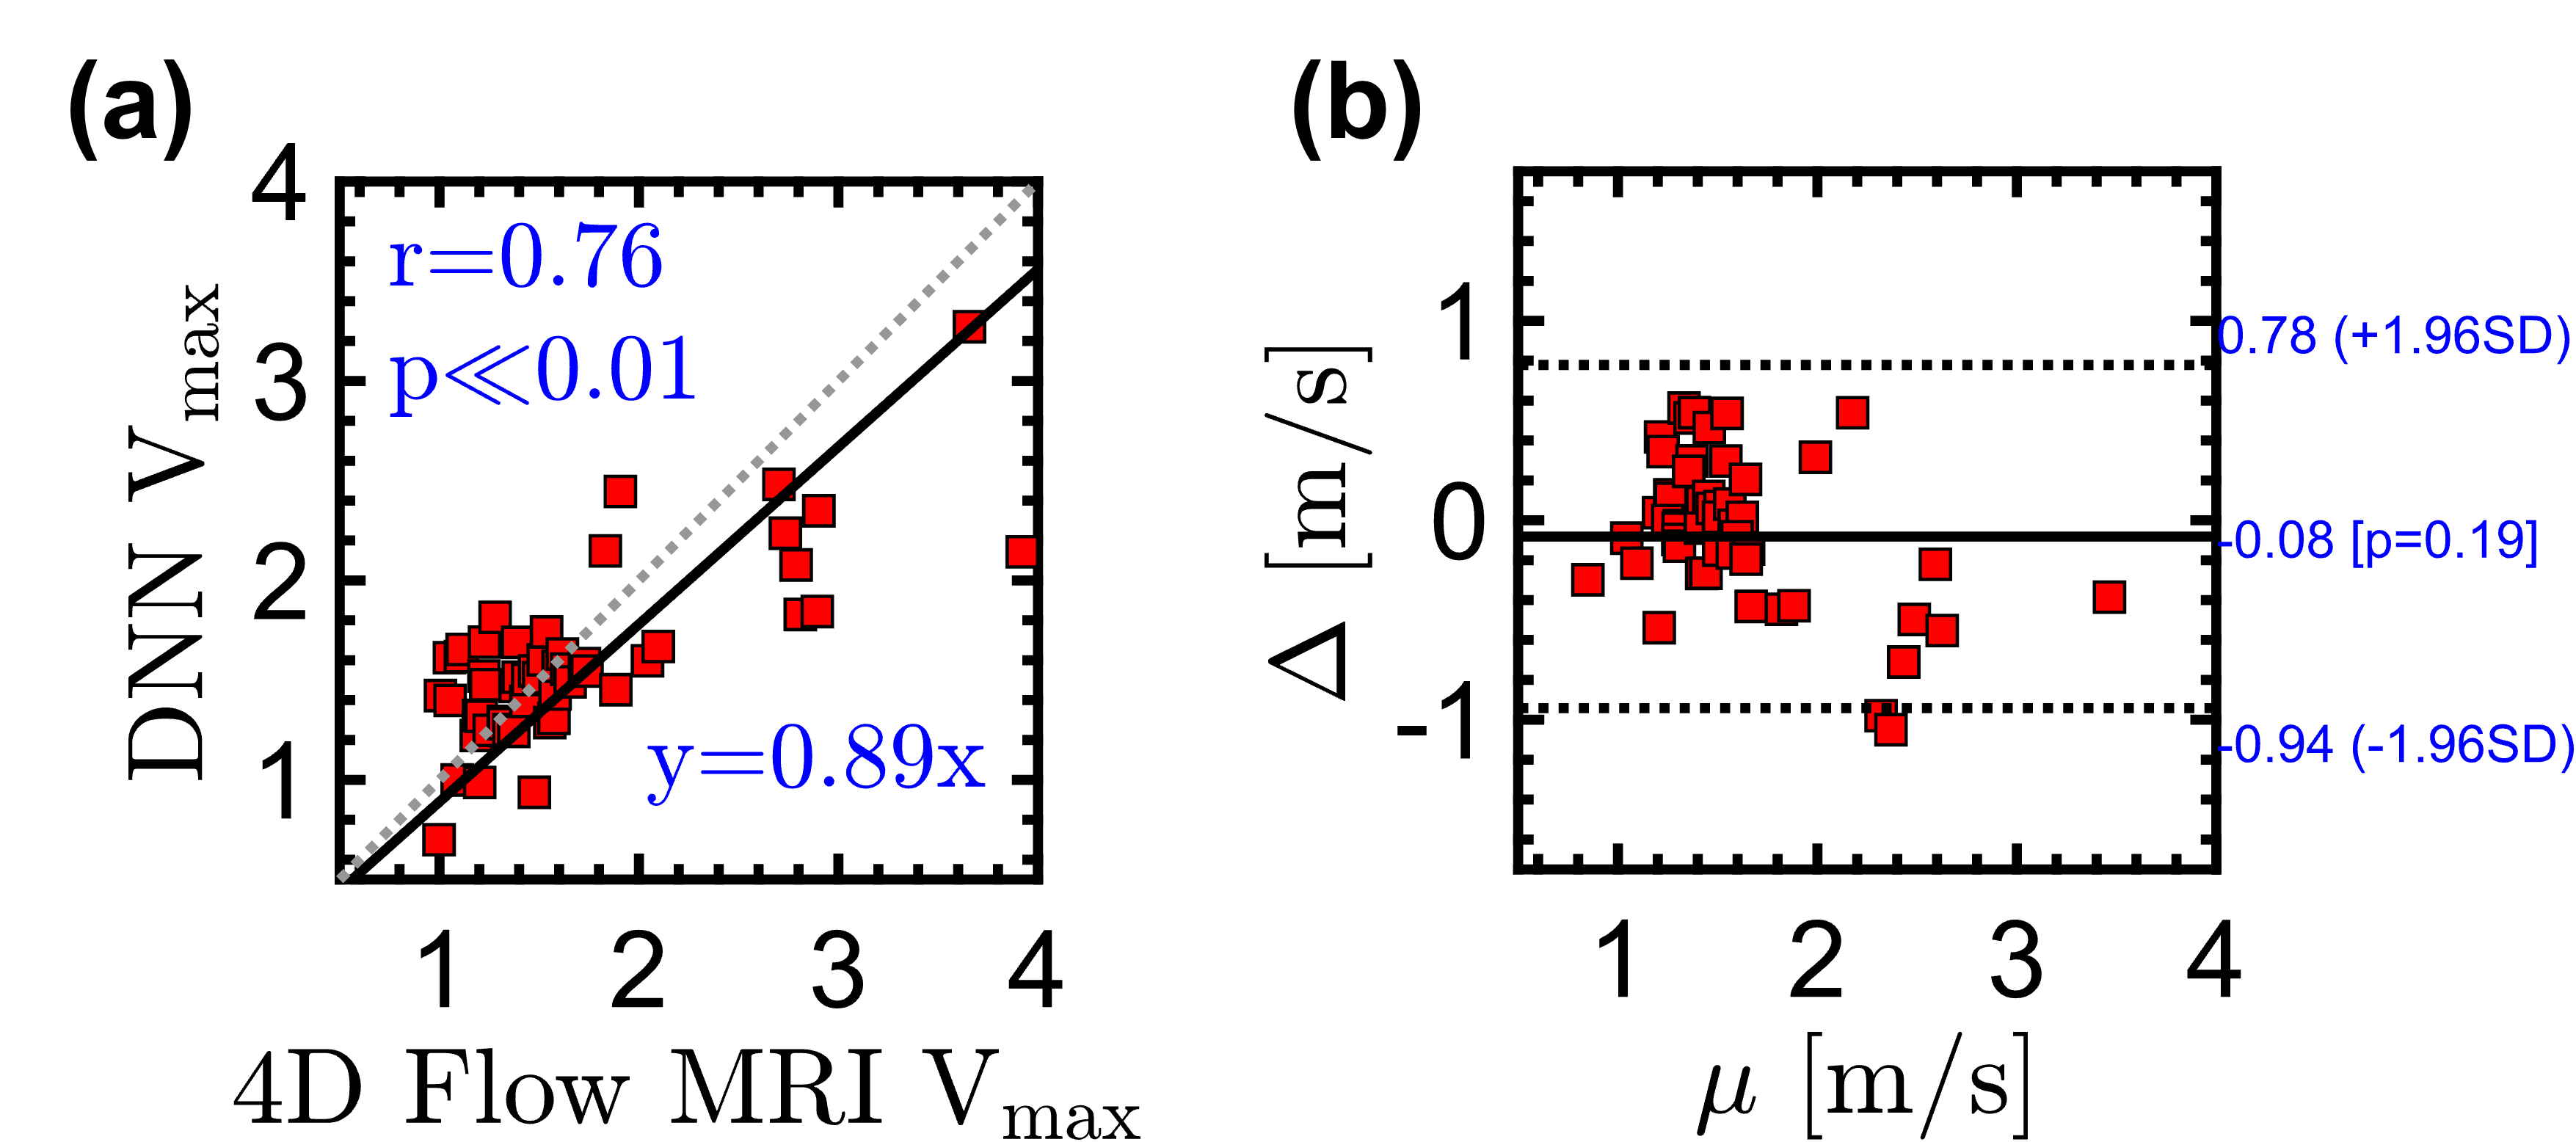
Fig 3. Statistical comparison between the Vmax values derived by 4D flow MRI and predicted by DNN and scalograms based on (a) correlation and (b) Bland-Altman analysis.