3648
Denoising Vastly Undersampled Radial Portal Venous 4D Flow Data via Deep Learning
Tarun Naren1, Oliver Wieben1,2, Thekla H Oechtering2,3, Scott B Reeder1,2, and Kevin M Johnson1,2
1Department of Medical Physics, University of Wisconsin - Madison, Madison, WI, United States, 2Department of Radiology, University of Wisconsin - Madison, Madison, WI, United States, 3Department of Radiology, Universität zu Lübeck, Lübeck, Germany
1Department of Medical Physics, University of Wisconsin - Madison, Madison, WI, United States, 2Department of Radiology, University of Wisconsin - Madison, Madison, WI, United States, 3Department of Radiology, Universität zu Lübeck, Lübeck, Germany
Synopsis
Keywords: Flow, Liver
Radially undersampled 4D flow MRI is a promising method for non-invasive mapping of blood flow in the portal venous system. However, collecting sufficient projections to produce clinically viable images can lead to long scan times (10+ minutes) as fewer projections cause undersampling artifacts that appear as structured noise. In this study, we propose a data-driven, deep learning method to denoise vastly undersampled (<10% of full Nyquist sampling) radial 4D flow MRI data in the portal vein. We train a network on a heterogeneous, time-averaged dataset with two levels of undersampling and perform a quantitative hemodynamic analysis to compare results.
Introduction
Evaluation of portal venous hemodynamics can identify pathologies such as cirrhosis and congestive heart failure1. 4D flow MRI has emerged as a technique to non-invasively quantify portal venous blood flow, providing comprehensive hemodynamic characterization2. However, even with modern acceleration techniques, 4D flow often requires long scan times (10+ minutes) to fully characterize cardiac pulsatility, account for respiratory motion, and cover large imaging volumes. In this work, we describe a novel strategy to denoise vastly undersampled (<10% of full Nyquist sampling) radial hepatic 4D flow reconstructions using a data-driven, deep learning approach. We harness a heterogeneous set of 4D flow acquisitions to train a network to predict velocity properties from undersampled velocity data with the goal of reducing the amount of data required to reconstruct a clinically viable image, thereby shortening scan time.Methods
A heterogeneous training dataset was curated using 4D flow data acquired from three prior human subject studies in the portal venous system. Data were acquired on two 3T clinical MRI systems (MR750, GE Healthcare, WI, USA) with a 32-channel phased array chest coil and a variety of scan parameters (TR/TE=6.5-7.6/2.1-2.4ms;flip=6-14˚;VENC=60-142cm/s;scan-time=597-732s;projections=10,000-17,500; resolution=1.25mm,isotropic). A total of 157 scans from 41 subjects were utilized with 16 scans from 6 subjects set aside for validation. In addition to the standard slab selective excitation acquisitions, 30 scans used intermittent fat-saturation acquisitions and 28 used inner volume excitation acquisitions, both designed to reduce artifacts in obese patients3.For each scan, three time-averaged reconstructions were performed: once using all acquired projections to serve as pseudo-ground truth (GT), and twice more with additional random undersampling (AUS) of projections by factors of 2x and 8x. The GT images are already highly undersampled compared to the theoretical max sampling (10-18% of ~100,000 projections needed to meet Nyquist criteria) so the true undersampling ratio for 2x and 8x AUS images would range from 5-9% and 1-2% respectively.
A 3D UNet was constructed with AUS images as input and denoised images as output (Figure 1). Due to GPU and file I/O limitations, the network was trained subject-by-subject and the 4D input was fed into the network in patches of size 5x64x64x64 with the 5 channels corresponding to magnitude, vx, vy, vz, and complex difference (CD) data. For each subject, 64 patches were randomly sampled with overlap to adequately cover the volume and reduce edge artifacts. The velocity channels were normalized by VENC and weighted by the CD image to prevent the network from learning background noise4. The loss function for the network was $$$f_{loss}=\frac{1}{N}\sum^{N}_{i=1} W \left \| x_{i,\text{ground truth}}-x_{i,\text{input}}\right \|^2$$$ where $$$W$$$ represents weights from the CD image. Two separate networks were trained on 2x and 8x AUS respectively.
For assessing network performance, the AUS inputs, denoised outputs, and GT images were imported into GTFlow (Gyrotools, Zurich, Switzerland) to perform flow measurements and visualization. Flow rates were measured at seven planes in the portal venous system according to Figure 3a. Flow interrogation planes were copied to the co-registered 2x and 8x AUS images and denoised outputs and flow data and streamlines were generated for each.
Additionally, normalized root mean square velocity error (RMSVE) between the GT and denoised velocity images was calculated. Vessel masks were generated by roughly segmenting the GT CD image via thresholding operations in MATLAB (MathWorks, MA, USA) and then used to isolate the vessels in GT and denoised outputs. RMSVE was calculated per pixel and normalized by the maximum velocity in each direction.
Results
Figures 2 and 3 qualitatively visualize the outputs of the network. There is a noticeable reduction in undersampling artifacts in the magnitude and CD images and the denoised velocity streamlines demonstrate more laminar flow behavior. Figure 4 illustrates the distribution of the normalized RMSVE in each direction for the AUS and denoised images. Figure 5 shows measures of agreement in calculated conservation of mass at the portal vein confluence.Discussion
The proposed deep learning method produced significant denoising of vastly undersampled magnitude and complex difference data and provided images comparable to the ground truth. However, the differences in denoised velocities compared to the undersampled inputs were only slight as evidenced by RMSVE values being similar between undersampled and denoised images. Additionally, the denoised flows showed less agreement in the portal vein confluence than the undersampled flows. This could indicate the network learned to make only minor adjustments to the velocity while making major changes to the magnitude and CD images, potentially due to the confounding effect of background velocity noise. Optimizing the network further and adjusting the weighting function would likely improve performance. Additionally, utilizing more validation subjects would improve statistical certainty.Lastly, this approach was applied as a pure post-processing method, with image reconstruction performed using simple non-uniform operators. k-space-based DL imaging reconstruction may offer higher performance but is challenging to train for high-dimensional abdominal 4D flow data.
Conclusion
Our proposed deep learning denoising approach greatly improved the quality of magnitude and complex difference images but did not show relevant differences in velocity measures. Future work will involve improving network performance by adjusting the weighting function, determining the optimal undersampling factor for scan time and performance, and extending network capabilities to denoise time-resolved data.Acknowledgements
The authors wish to acknowledge the NIH (R01 DK125783) for supporting this study, as well as GE Healthcare which provides research support to the University of Wisconsin. Dr. Oechtering receives funding from the German Research Foundation (OE 746/1-1). Dr. Reeder is a Fred Lee Sr. Endowed Chair of Radiology.References
- Oechtering TH, Roberts GS, Panagiotopoulos N, Wieben O, Reeder SB, Roldán-Alzate A. Clinical Applications of 4D Flow MRI in the Portal Venous System. Magn Reason Med Sci. 2022 Mar 1; 21(2):340-353. Doi: 10.2463/mrms.rev.2021-0105. Epub 2022 Jan 25. PMID: 35082218
- Motosugi U, Roldán-Alzate A, Bannas P, Said A, Kelly S, Zea R, Wieben O, Reeder SB. Four-dimensional Flow MRI as a Marker for Risk Stratification of Gastroesophageal Varices in Patients with Liver Cirrhosis. Radiology 2019 290:1, 101-107.
- Oechtering TH, Shamim AMKM, Spahic A, Panagiotopoulos N, Wieben O, Roldán-Alzate A, Reeder SB, Johnson KM. Fat mitigation strategies to improve image quality of radial 4D flow MRI in obese subjects [abstract]. International Society of Magnetic Resonance in Medicine. London, United Kingdom, 2022. Abstract nr. 0081
- Kim D, Jen ML, Eisenmenger LB, Johnson KM. Accelerated 4D-flow MRI with 3-point encoding enabled by machine learning. Magn Reson Med. 2022 Oct 5. Doi: 10.1002/mrm.29469. Epub ahead of print. PMID: 36198027.
Figures
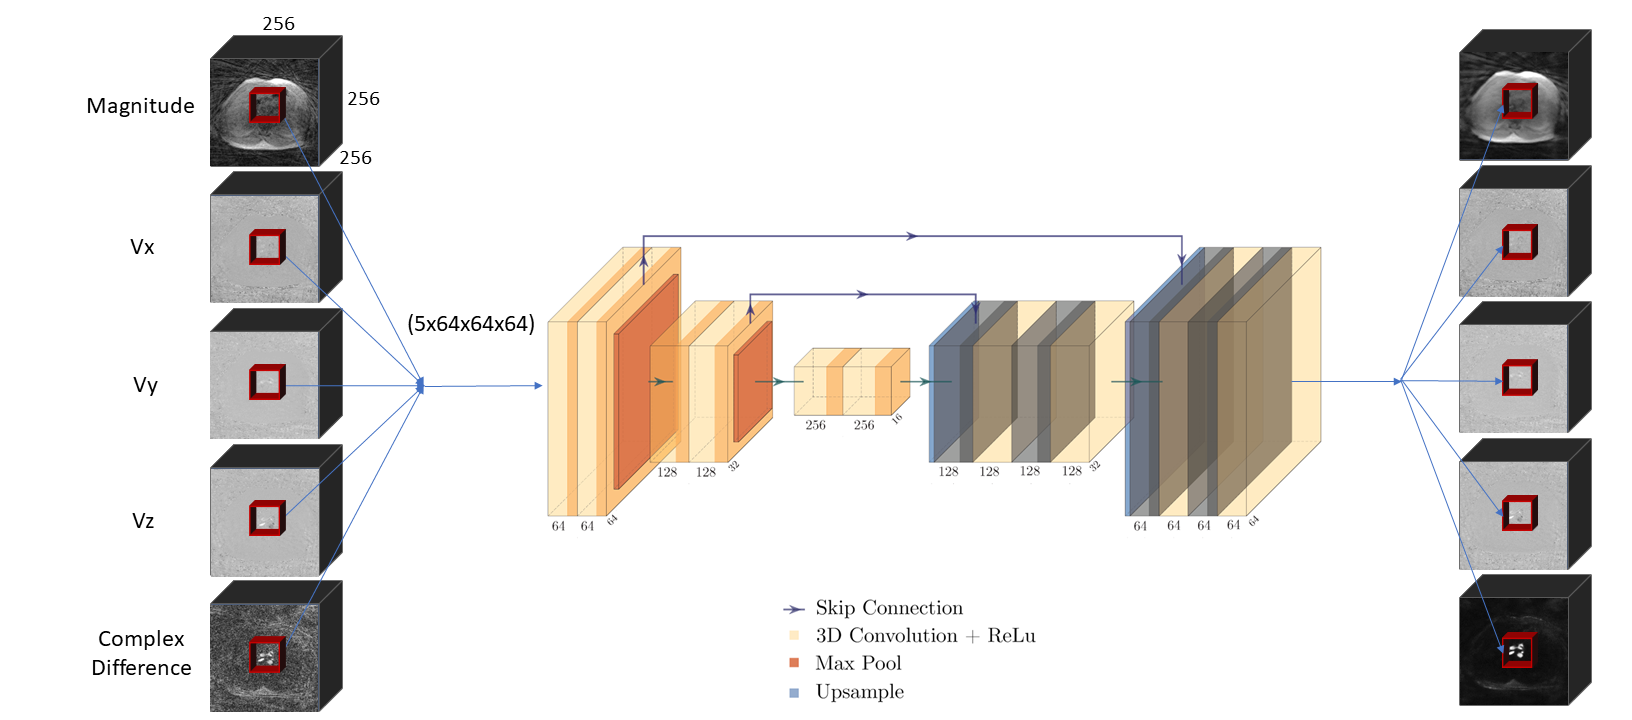
The training pipeline for this network. Network consists of a two-level encoder/decoder structure with each block containing a 3D convolution and ReLU layer and residual skip connections at each level. Input data is in the form of a 4D matrix with 3 spatial dimensions (256x256x256) and 5 channels (magnitude, vx, vy, vz, complex difference). The data was fed in as patches of size 5x64x64x64 randomly sampled from the volume.
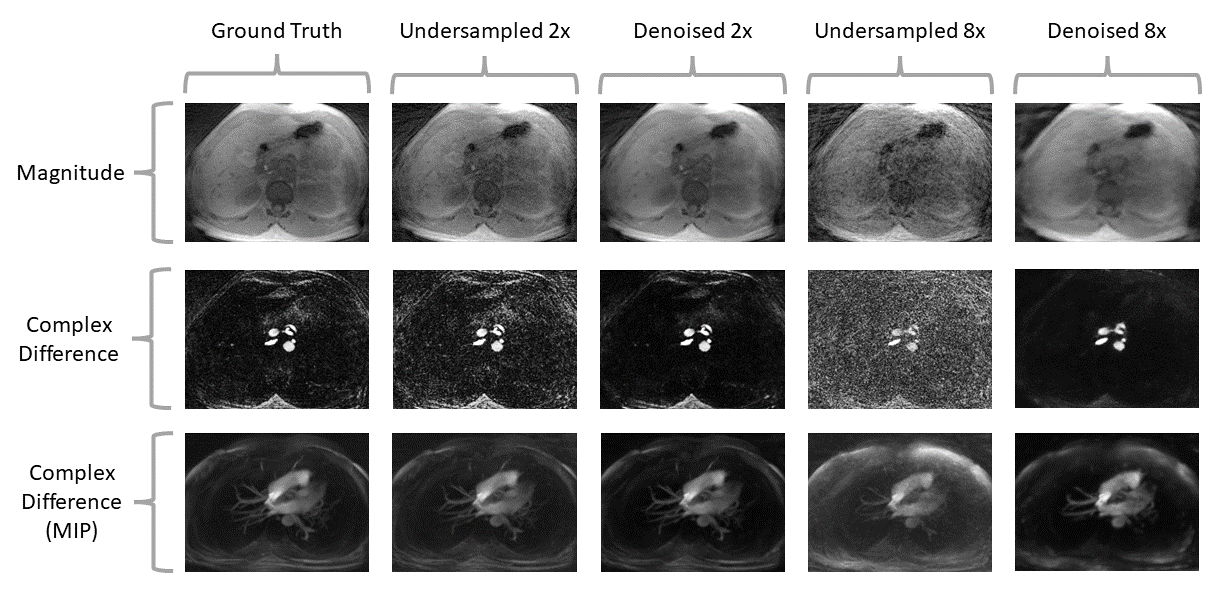
Axial slice from a representative subject comparing magnitude (top), complex difference (middle), and maximum intensity projections (bottom) for the ground truth, additionally undersampled inputs with 50% (undersampled 2x) and 12.5% (undersampled 8x) of the acquired projections, and denoised outputs for each (denoised 2x and denoised 8x).
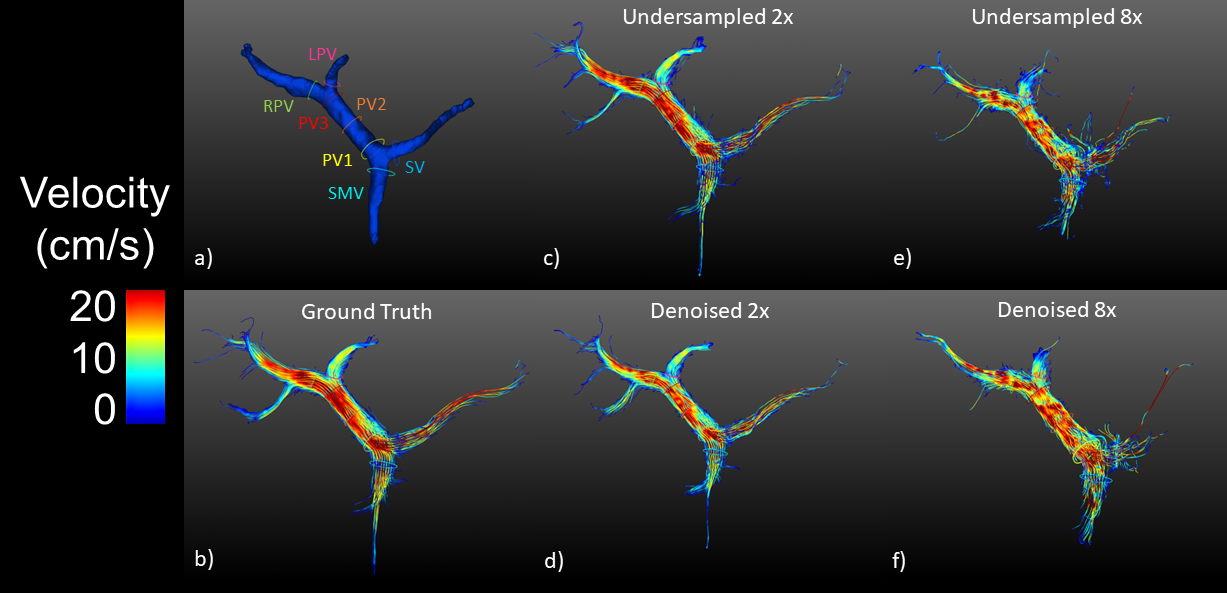
Streamline visualization to demonstrate velocity errors in denoised vs undersampled images. Seven planes were placed in the portal venous system according to a) where SMV=superior mesenteric vein, SV=splenic vein, PV1,2,3=portal vein, LPV=left portal vein, and RPV=right portal vein. b) is the ground truth using all projections, c) and e) use 50% and 12.5% of the acquired projections respectively, d) and f) are the denoised outputs.
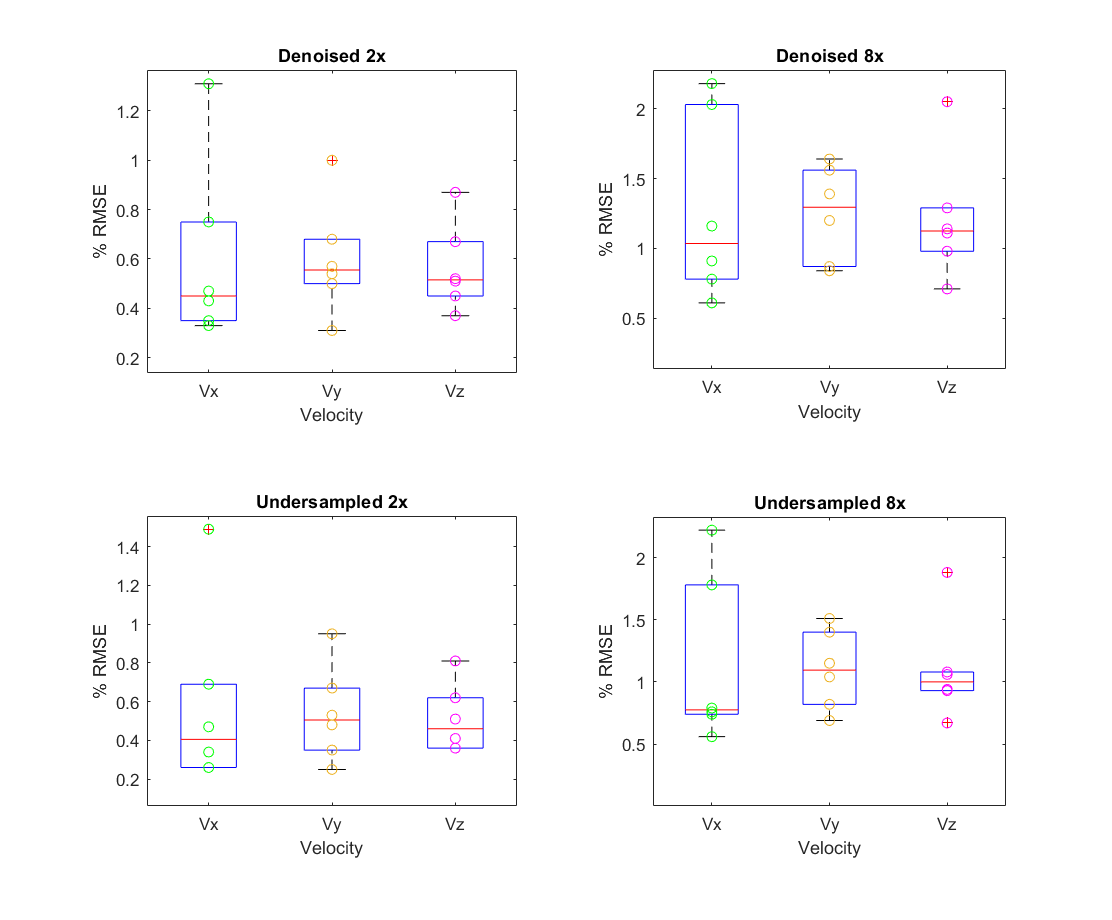
Root mean square velocity error (RMSE) calculated per direction in validation subjects for denoised 2x undersampled images (top left) and denoised 8x undersampled images (top right) compared to 2x undersampled images (bottom left) and 8x undersampled images (bottom right). Each point corresponds to a different subject (n=6). Error is normalized to the maximum velocity in the vessel to reduce dependence on direction
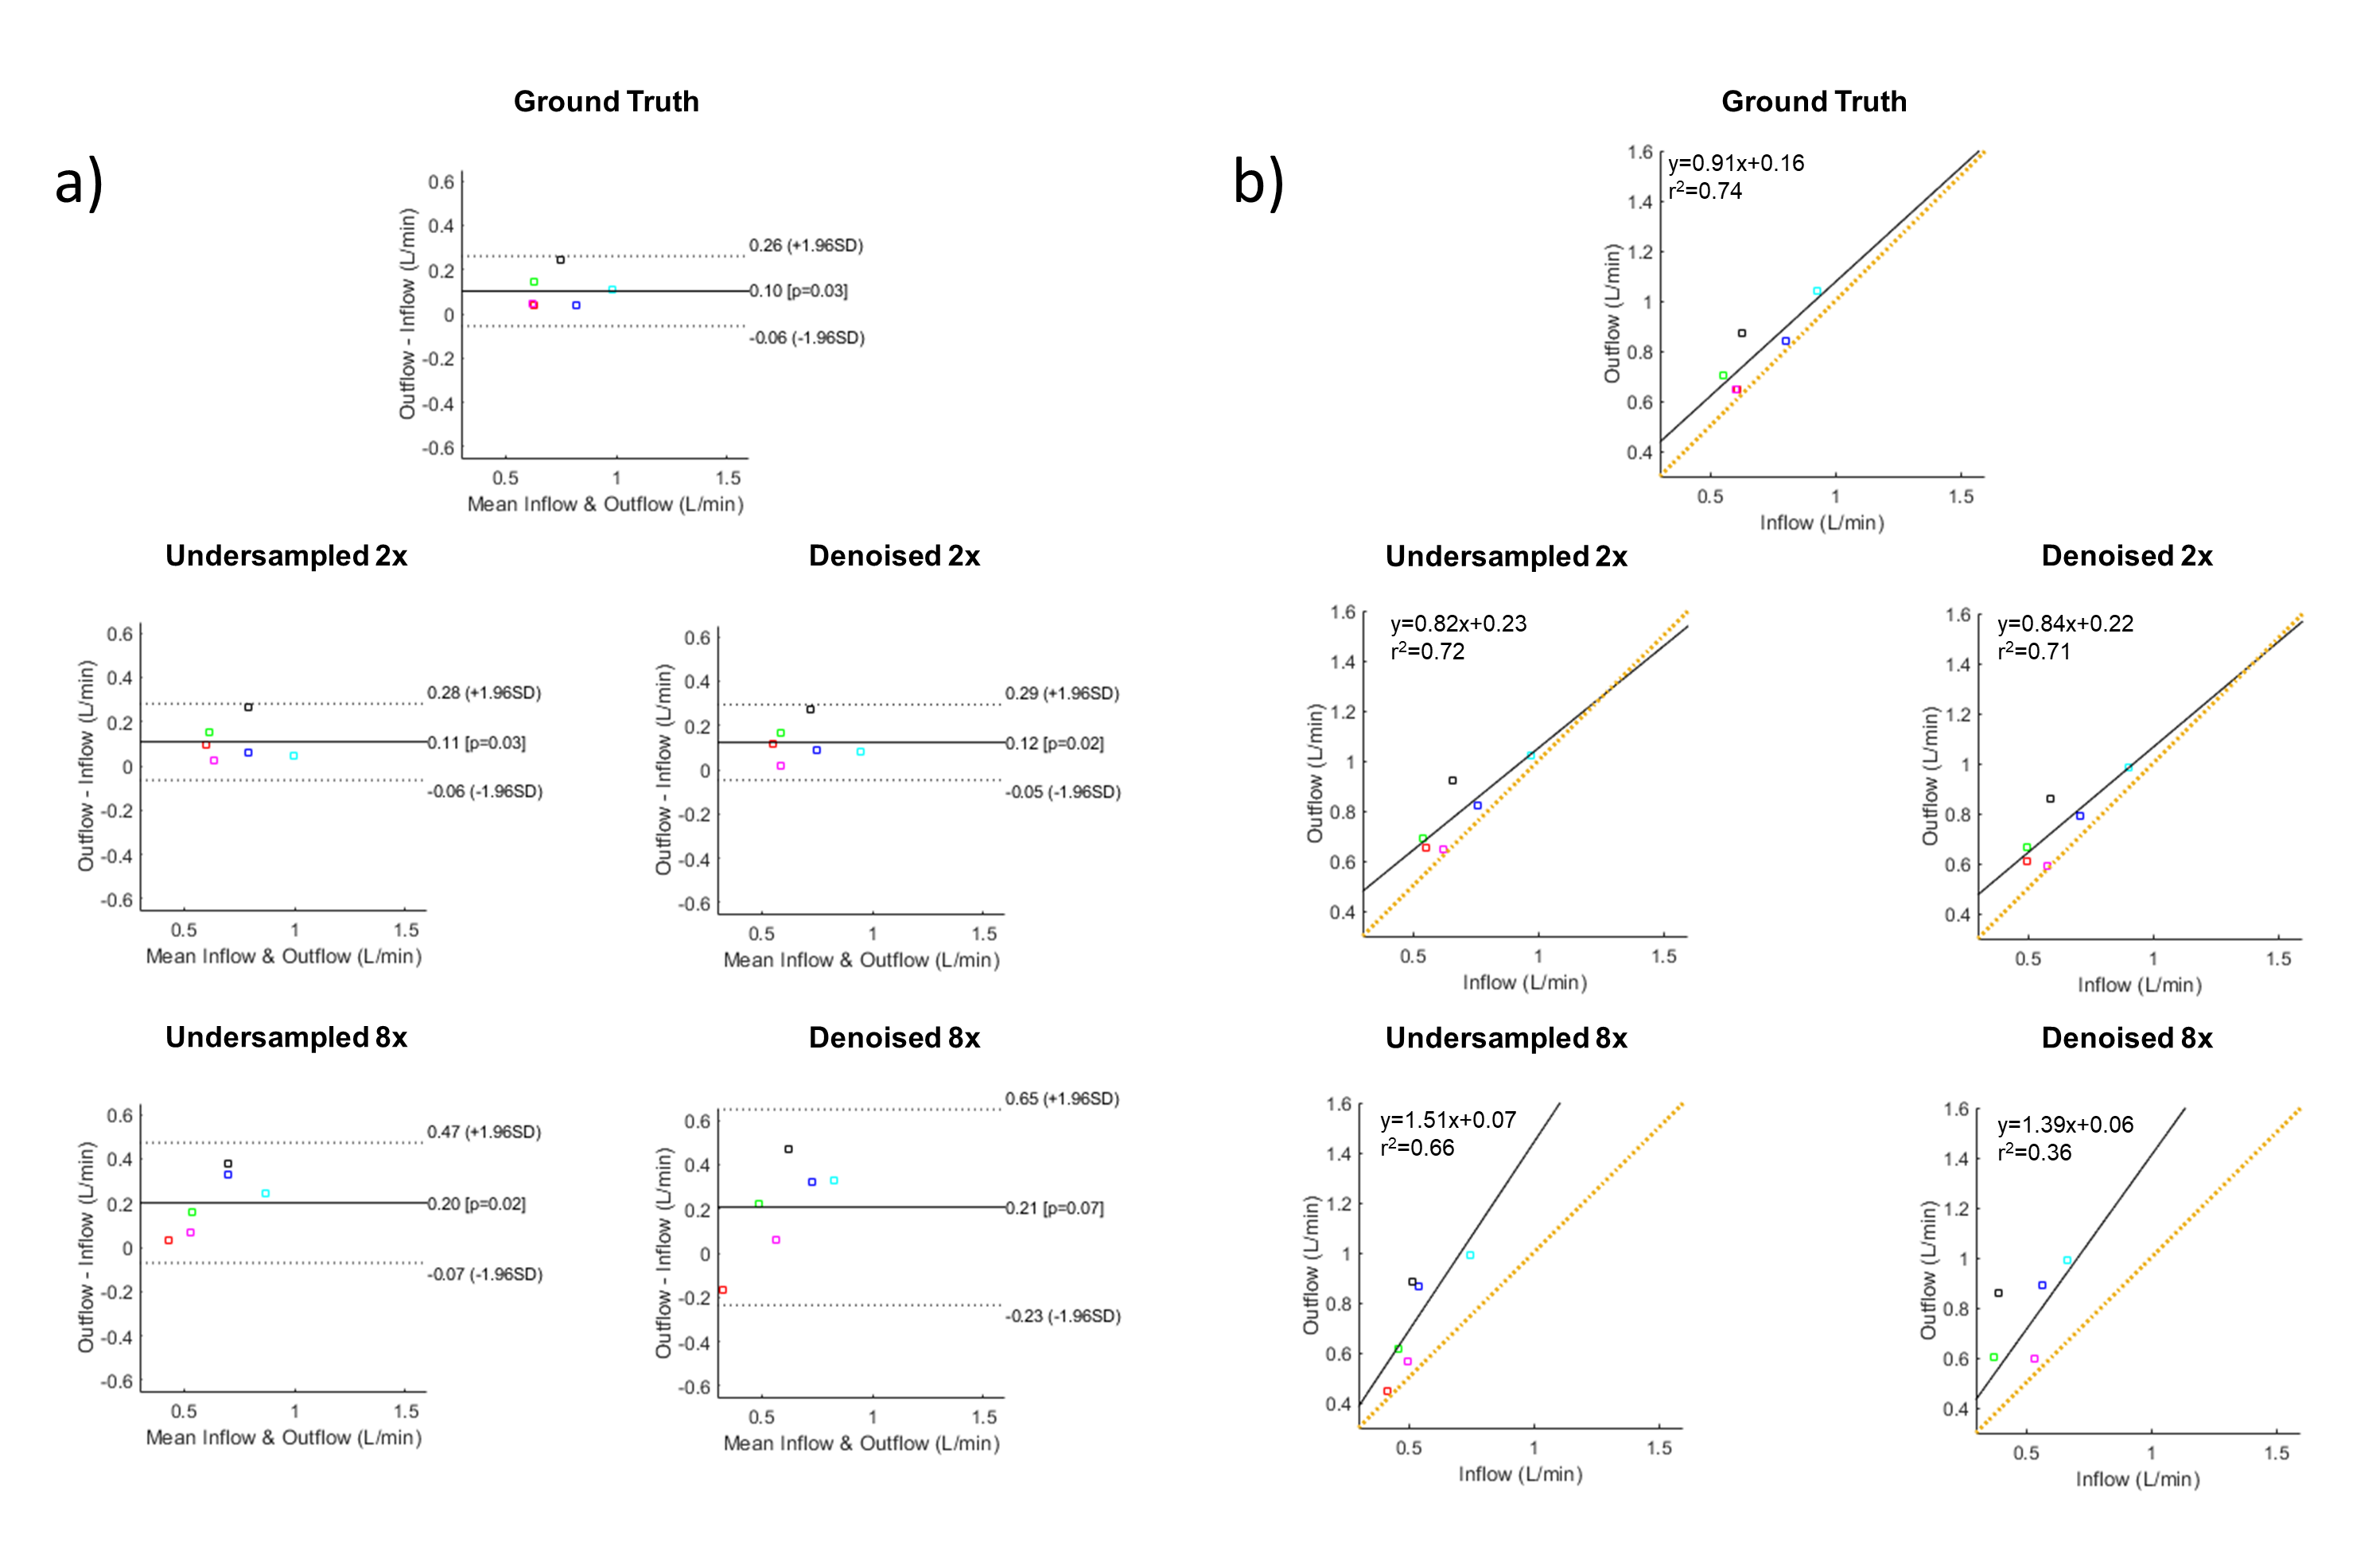
Bland-Altman a) and correlation plots b) measuring agreement in conservation of mass in the portal vein confluence for ground truths, undersampled inputs, and denoised outputs. Inflow is the sum of incoming flow from superior mesenteric vein (SMV) and splenic vein (SV), and outflow is measured in caudal portal vein (PV1). Dashed lines in a) indicate 95% CI and orange line in b) represents the ideal regression line with slope=1. Each point corresponds to a validation subject (n=6).
DOI: https://doi.org/10.58530/2023/3648