3644
Optimal encoding strategies for turbulence quantification of undersampled 4D flow MRI
Pietro Dirix1, Stefano Buoso1, and Sebastian Kozerke1
1University and ETH Zurich, Zürich, Switzerland
1University and ETH Zurich, Zürich, Switzerland
Synopsis
Keywords: Flow, Image Reconstruction
We expand a previously developed pipeline for generation of synthetic 4D flow MRI of turbulent flows to account for realistic k-space filling and add an MR temporal averaging component to the simulations. We show that temporal averaging in typical undersampled 4D flow MRI is imperfect, leading to inherent scan-to-scan variations of measured turbulence fields. We demonstrate how encoding schemes, when designed appropriately, allow to significantly reduce scan-to-scan variability, increasing the confidence on MRI measurements.Introduction
Turbulent aortic flow is characterized by velocity fluctuations that, in phase-contrast (PC) acquisitions with sequential filling of k-space, are responsible for scan-to-scan variance. Since this is expected to affect the estimation of turbulent kinetic energy, we aim at investigating acquisition strategies for which we can best reproduce turbulent flow statistics. Particularly, considering a fixed target scan time budget, suitable for clinical applications, we exploit a synthetic phantom of stenotic aortic flow to investigate the impact of various encoding strategies on the reconstructed turbulent kinetic energy (TKE). We seek the optimal encoding strategy by balancing the number of encoding velocity magnitudes and directions, the number of signal averages and the undersampling factor.Methods
Turbulent flow was simulated using computational fluid dynamics in an idealized stenotic phantom characterized by a 75% area reduction with 5% eccentricity and a stationary inflow resulting in a Reynolds number (Re) of 4000 at the stenotic throat. A total of $$$N=100$$$ instantaneous flow maps were saved every $$$\delta t=25ms$$$ to ensure flow decorrelation. Mean velocity $$$\overline{u}$$$ and the Reynolds stress tensors (RST) $$$R$$$ were computed from these $$$N$$$ realizations (Figure 1a). We used a band-limited projection1 of the averaged quantities projected to a resolution of 2.5x2.5x2.5mm3 to compute the downsampled velocity $$$\overline{u}_{\Delta}$$$ and RST $$$R_{\Delta}$$$ (Figure 1b.1). These were used as reference, fully-sampled ground truth MRI measurements. For each instantaneous flow map, $$$n$$$, the corresponding complex MRI signal, $$$S^{k}(n)$$$ , was generated and augmented with Gaussian noise to obtain a signal-to-noise ratio (SNR) of 30 (Figure 1b.2 and 1e). Undersampled MRI acquisitions, $$$S^{k}_{R}$$$, were simulated by first generating undersampling masks, $$$M$$$, using pseudo-spiral Cartesian k-space filling2. Then, the corresponding non-zero entries of the undersampled k-space, $$$S^{k}_{R}(k_{x} ,k_{y})$$$, were filled by randomly sampling from the $$$N$$$ available realizations $$$S^{k}$$$ such that:$$S_{R}^{k}(k_{x},k_{y})=S^{k}(\xi \sim U(0,N),k_{x},k_{y})\cdot M(k_{x},k_{y})$$
were $$$\xi$$$ is a random integer between 0 and $$$N$$$ (Figure 1f). The BART toolbox3 was used to reconstruct the signal including total variation (TV) regularization with a single value of $$$\lambda$$$ chosen for all undersampling factors (Figure 1g). Finally, Bayesian unfolding was used to combine multi-venc acquisitions (Figure 1h). The scan time budget for synthetic MR simulations was defined as (based on a reference 13-point 4D flow MRI with an undersampling factor $$$R_{u}=4$$$):
$$N_{flow}\cdot N_{avg} \cdot R_{u}^{-1}=3.25$$
were $$$N_{flow}$$$ is the number of flow encoding segments, $$$N_{avg}$$$ is the number of signal averages and $$$R_{u}$$$ is the undersampling factor. The list of encoding schemes investigated in this work is presented in Figure 1i. Signal averages were performed either by averaging k-spaces or by averaging reconstructed images. Turbulent kinetic energy (TKE) and integrated turbulent kinetic energy (iTKE) were computed from the diagonal of the reconstructed RST as:
$$TKE=\frac{1}{2}(R_{xx}+R_{yy}+R_{zz})\;\;[Jm^{-3}]$$$$iTKE=\int_{\Omega}TKE\,dV\;\;[mJ]$$
where $$$\Omega$$$ defines the integration domain. The impact of scan-to-scan variance on TKE estimates is evaluated by repeating each acquisition $$$N_{rep}=30$$$ times and computing the turbulence to noise ratio (TNR) as4:
$$TNR=\overline{TKE} \cdot \sigma_{TKE}$$
where $$$\sigma_{TKE}$$$ is the standard deviation of TKE over 30 realizations.
Results
Errors in iTKE estimates between undersampled acquisitions and the reference data are presented in Figure 2 for both signal averaging in k-space (2.a) and post-reconstruction averaging (2.b). The reference iTKE is 1.95mJ and it is overestimated by up to 34% with undersampled encoding schemes. The minimum error (-0.03±0.05mJ) is obtained for a single 13-point acquisition with six non-collinear encoding directions, $$$V_{ENC}=0.3,0.6ms^{-1}$$$, $$$R_{u}=4$$$ and averaged after reconstruction. Mean values of TNR for each acquisition are presented in Figure 3 for both signal averaging in k-space (3.a) and post-reconstruction averaging (3.b). A maximum mean TNR of 15.73 is obtained for 10 repetitions of a 4-point acquisition with three non-collinear encoding directions, $$$V_{ENC}=0.3ms^{-1}$$$, $$$R_{u}$$$=12.3 and averaged after reconstruction. Figure 4 shows TKE and TNR maps for each encoding scheme with the corresponding number of averages minimizing iTKE errors. TKE maps of a 4-point acquisition using $$$V_{enc}=0.3ms^{-1}$$$ show significant under-estimation of TKE due to low sensitivity to high turbulence. Similarly, TKE and TNR maps of the acquisitions that maximize mean TNR are shown in Figure 5. TNR values in post-reconstruction averaged data consistently outperform k-space averaged data.Discussion
We have investigated the effect of scan-to-scan variance on TKE measured in MRI. Signal averaging consistently increases the estimation of iTKE for both k-space and post-reconstruction averaging. However, k-space averaging significantly underperforms when compared to post-reconstruction averaging for mean TNR. Optimal encoding schemes in terms of estimated iTKE were obtained with a low count of signal averages, leading to low TNR and consequently high scan-to-scan variations. If the interest is in integrated quantities then these encoding schemes are appropriate, however they are less adequate for obtaining good structural fidelity with the ground truth flow, as variations between distinct acquisitions are significant. To generate turbulence maps with low scan-to-scan variance, highly undersampled highly averaged encoding schemes are favorable. The choice of $$$V_{ENC}$$$ has a large impact on TKE quantification, particularly for single-$$$V_{ENC}$$$ encoding schemes, confirming that adequate choice of $$$V_{ENC}$$$ depending on the expected turbulence magnitude is fundamental5.Acknowledgements
No acknowledgement found.References
- Dirix P, Buoso S, Peper ES, Kozerke S. Synthesis of patient-specific multipoint 4D flow MRI data of turbulent aortic flow downstream of stenotic valves. Scientific reports. 2022 Sep 26;12(1):1-1.
- Peper ES, Gottwald LM, Zhang Q, Coolen BF, van Ooij P, Nederveen AJ, Strijkers GJ. Highly accelerated 4D flow cardiovascular magnetic resonance using a pseudo-spiral Cartesian acquisition and compressed sensing reconstruction for carotid flow and wall shear stress. Journal of Cardiovascular Magnetic Resonance. 2020 Dec;22(1):1-5.
- Uecker M, Ong F, Tamir JI, Bahri D, Virtue P, Cheng JY, Zhang T, Lustig M. Berkeley advanced reconstruction toolbox. InProc. Intl. Soc. Mag. Reson. Med 2015 May 30 (Vol. 23, No. 2486).
- Ha H, Park KJ, Dyverfeldt P, Ebbers T, Yang DH. In vitro experiments on ICOSA6 4D flow MRI measurement for the quantification of velocity and turbulence parameters. Magnetic Resonance Imaging. 2020 Oct 1;72:49-60.
- Walheim J, Dillinger H, Gotschy A, Kozerke S. 5D flow tensor MRI to efficiently map Reynolds stresses of aortic blood flow in-vivo. Scientific Reports. 2019 Dec 11;9(1):1-2.
Figures
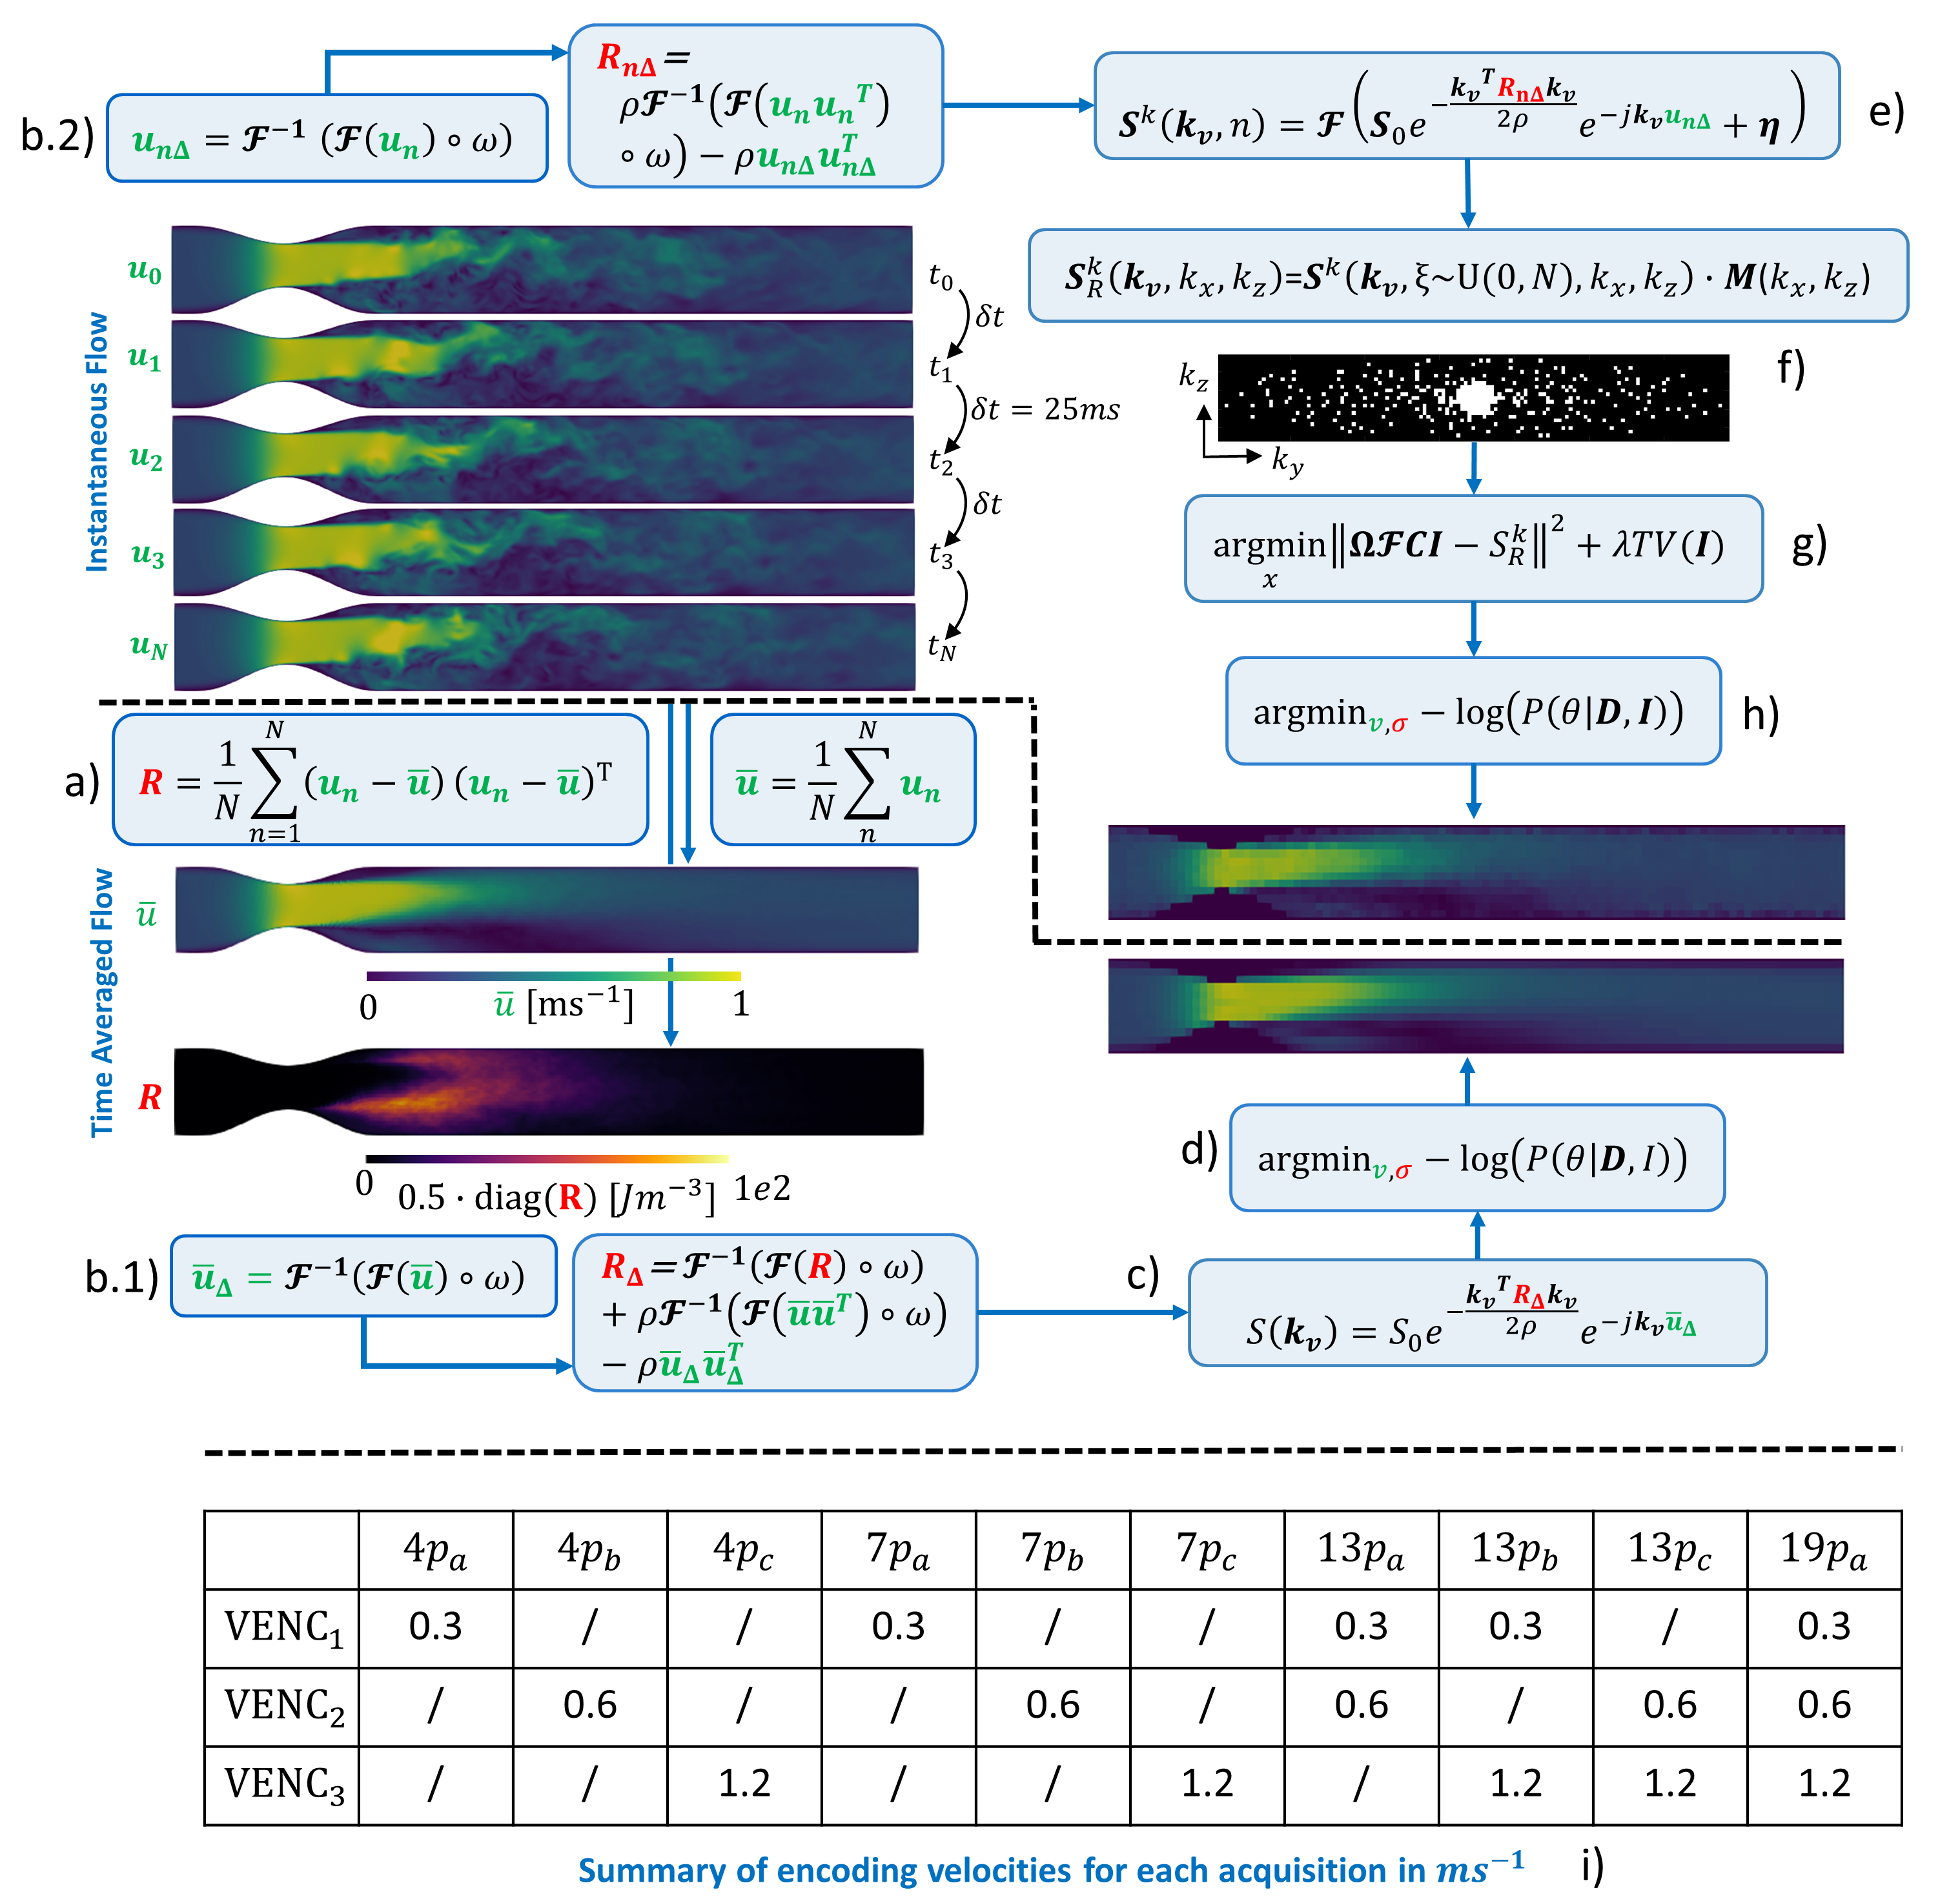
Figure 1: Pipeline to study the impact of scan-to-scan variance on TKE quantification. a) Generation of averaged quantities from instantaneous flow. b) Bandwidth-limited projection of velocity and RST. c) Ideal MR image synthesis and d) Bayesian unfolding. e) Instantaneous k-space signals. f) Generation of randomly undersampled k-space. g) Total variation reconstruction and h) Bayesian unfolding. i) $$$V_{ENC}$$$ values used for the simulations.
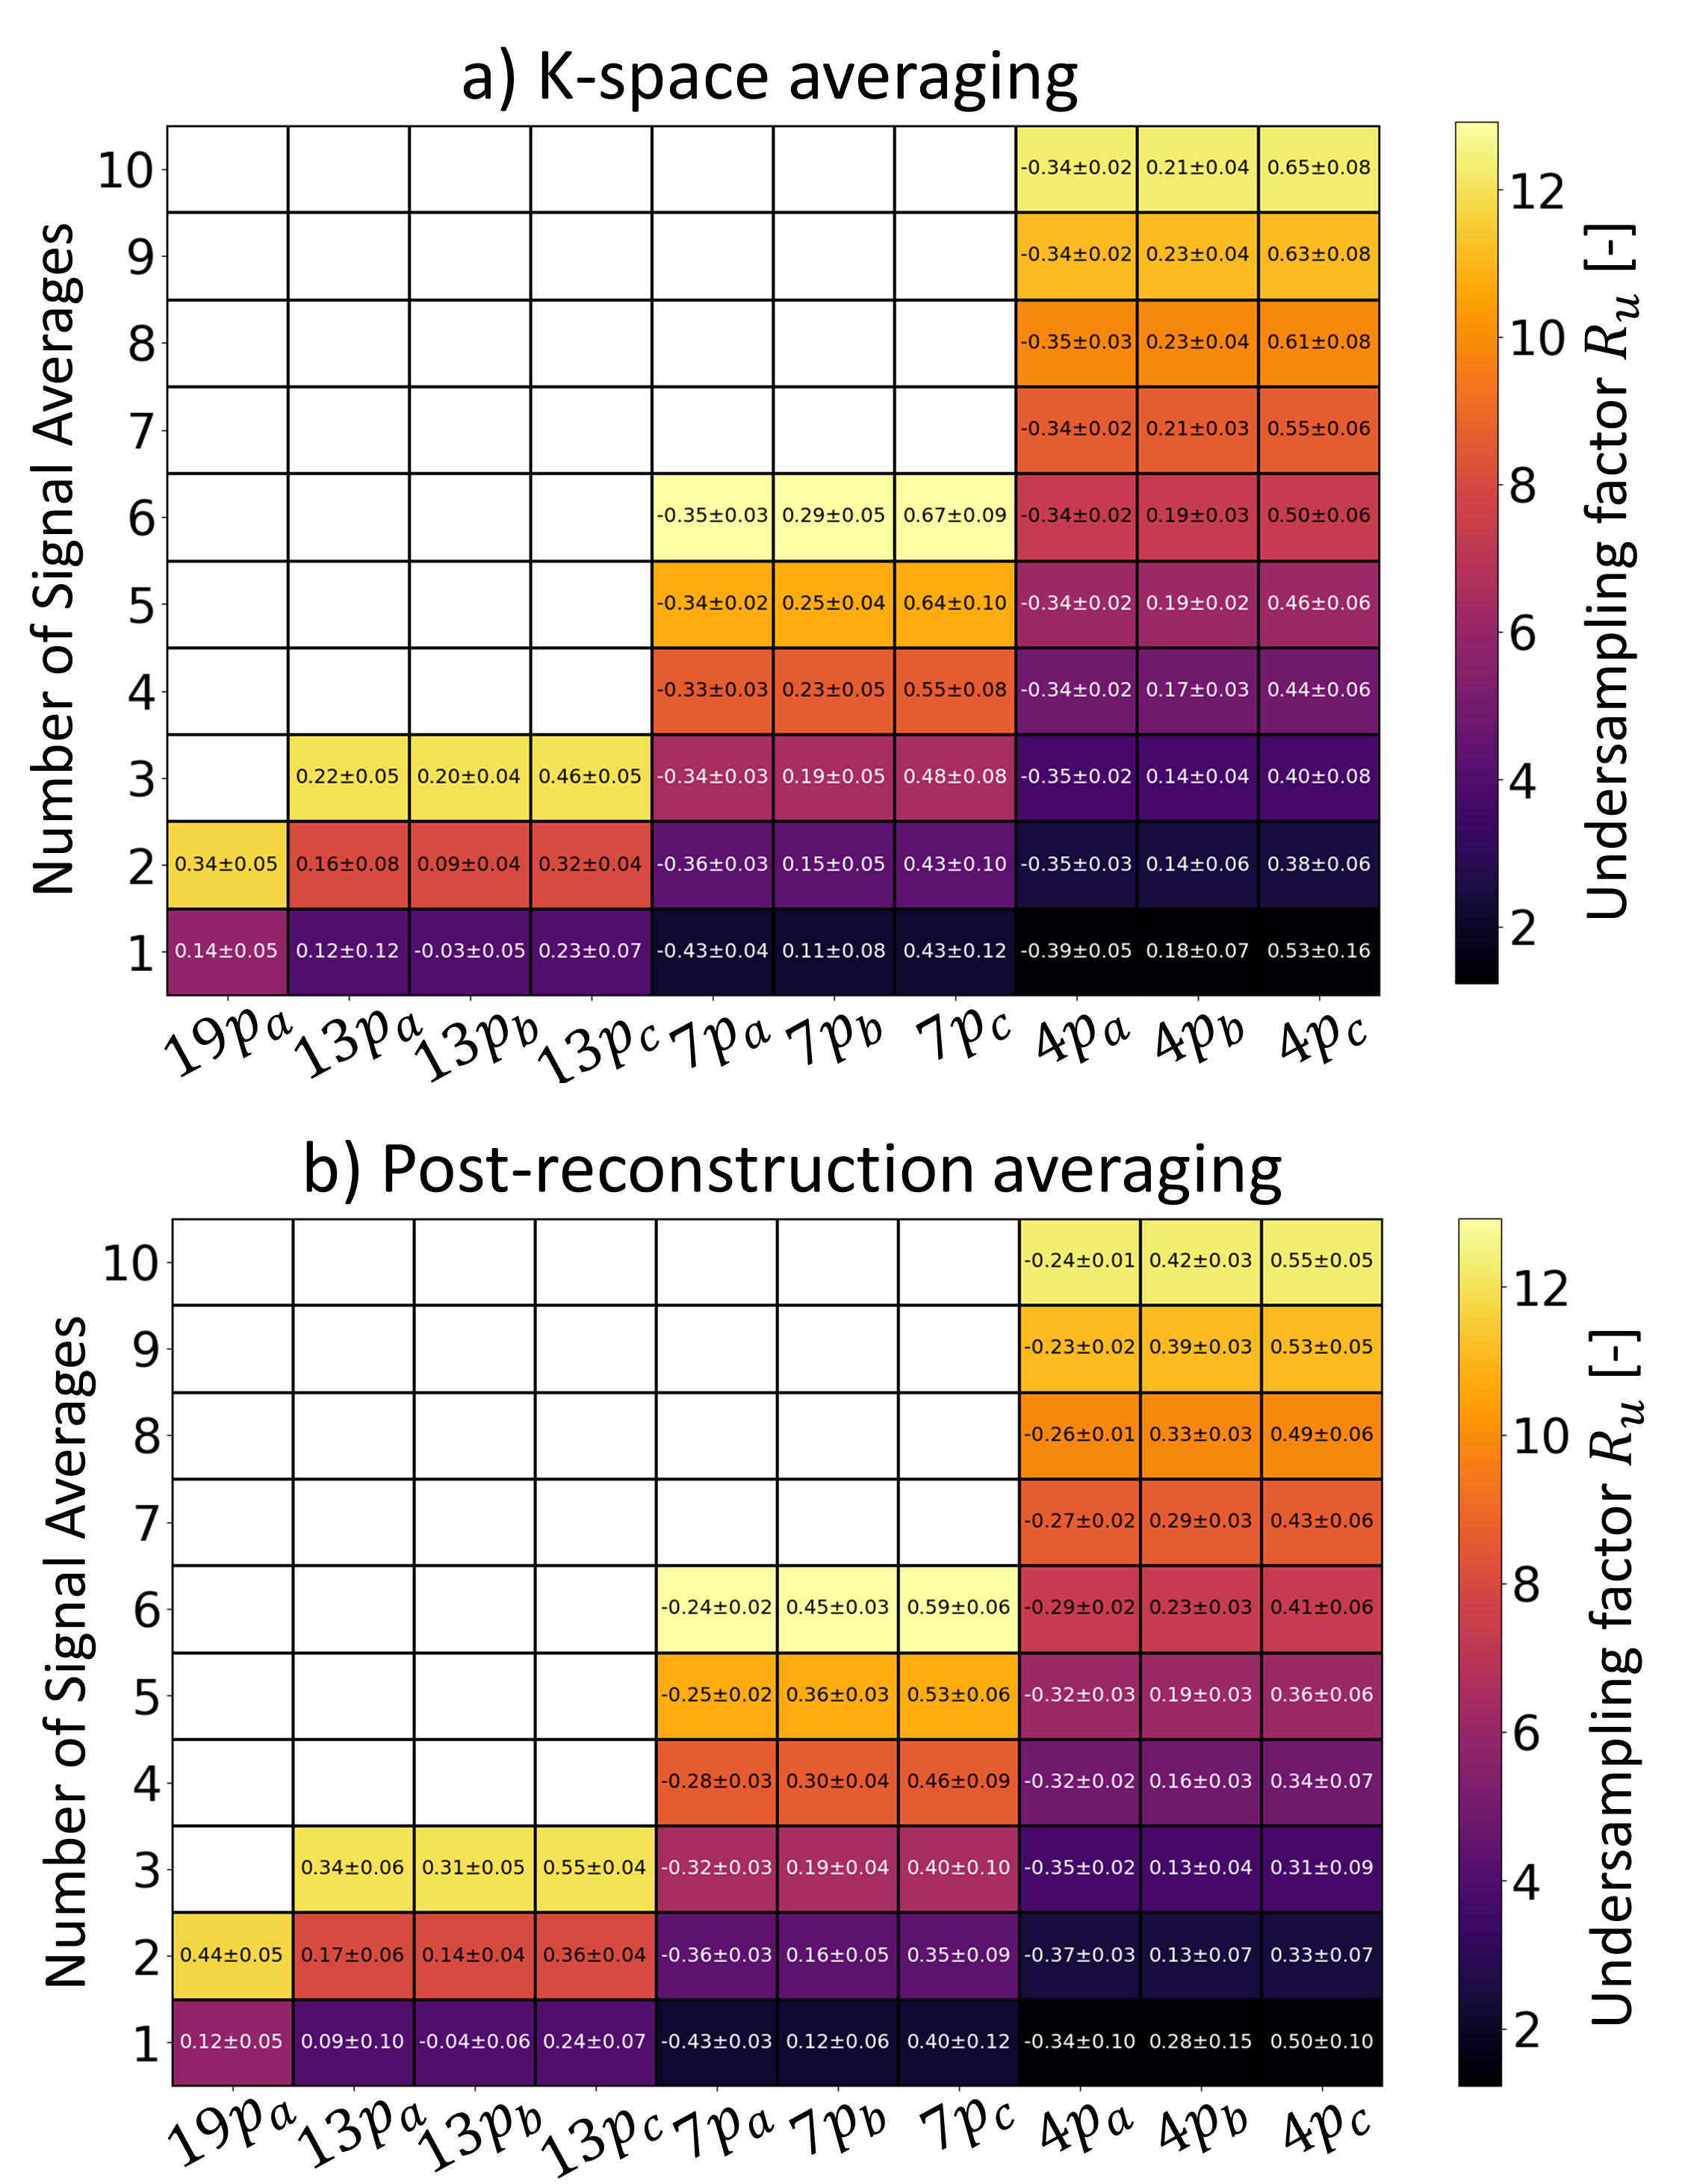
Figure 2: Mean error and standard deviation of integrated TKE when comparing results from undersampled data to the ideal MR reference.
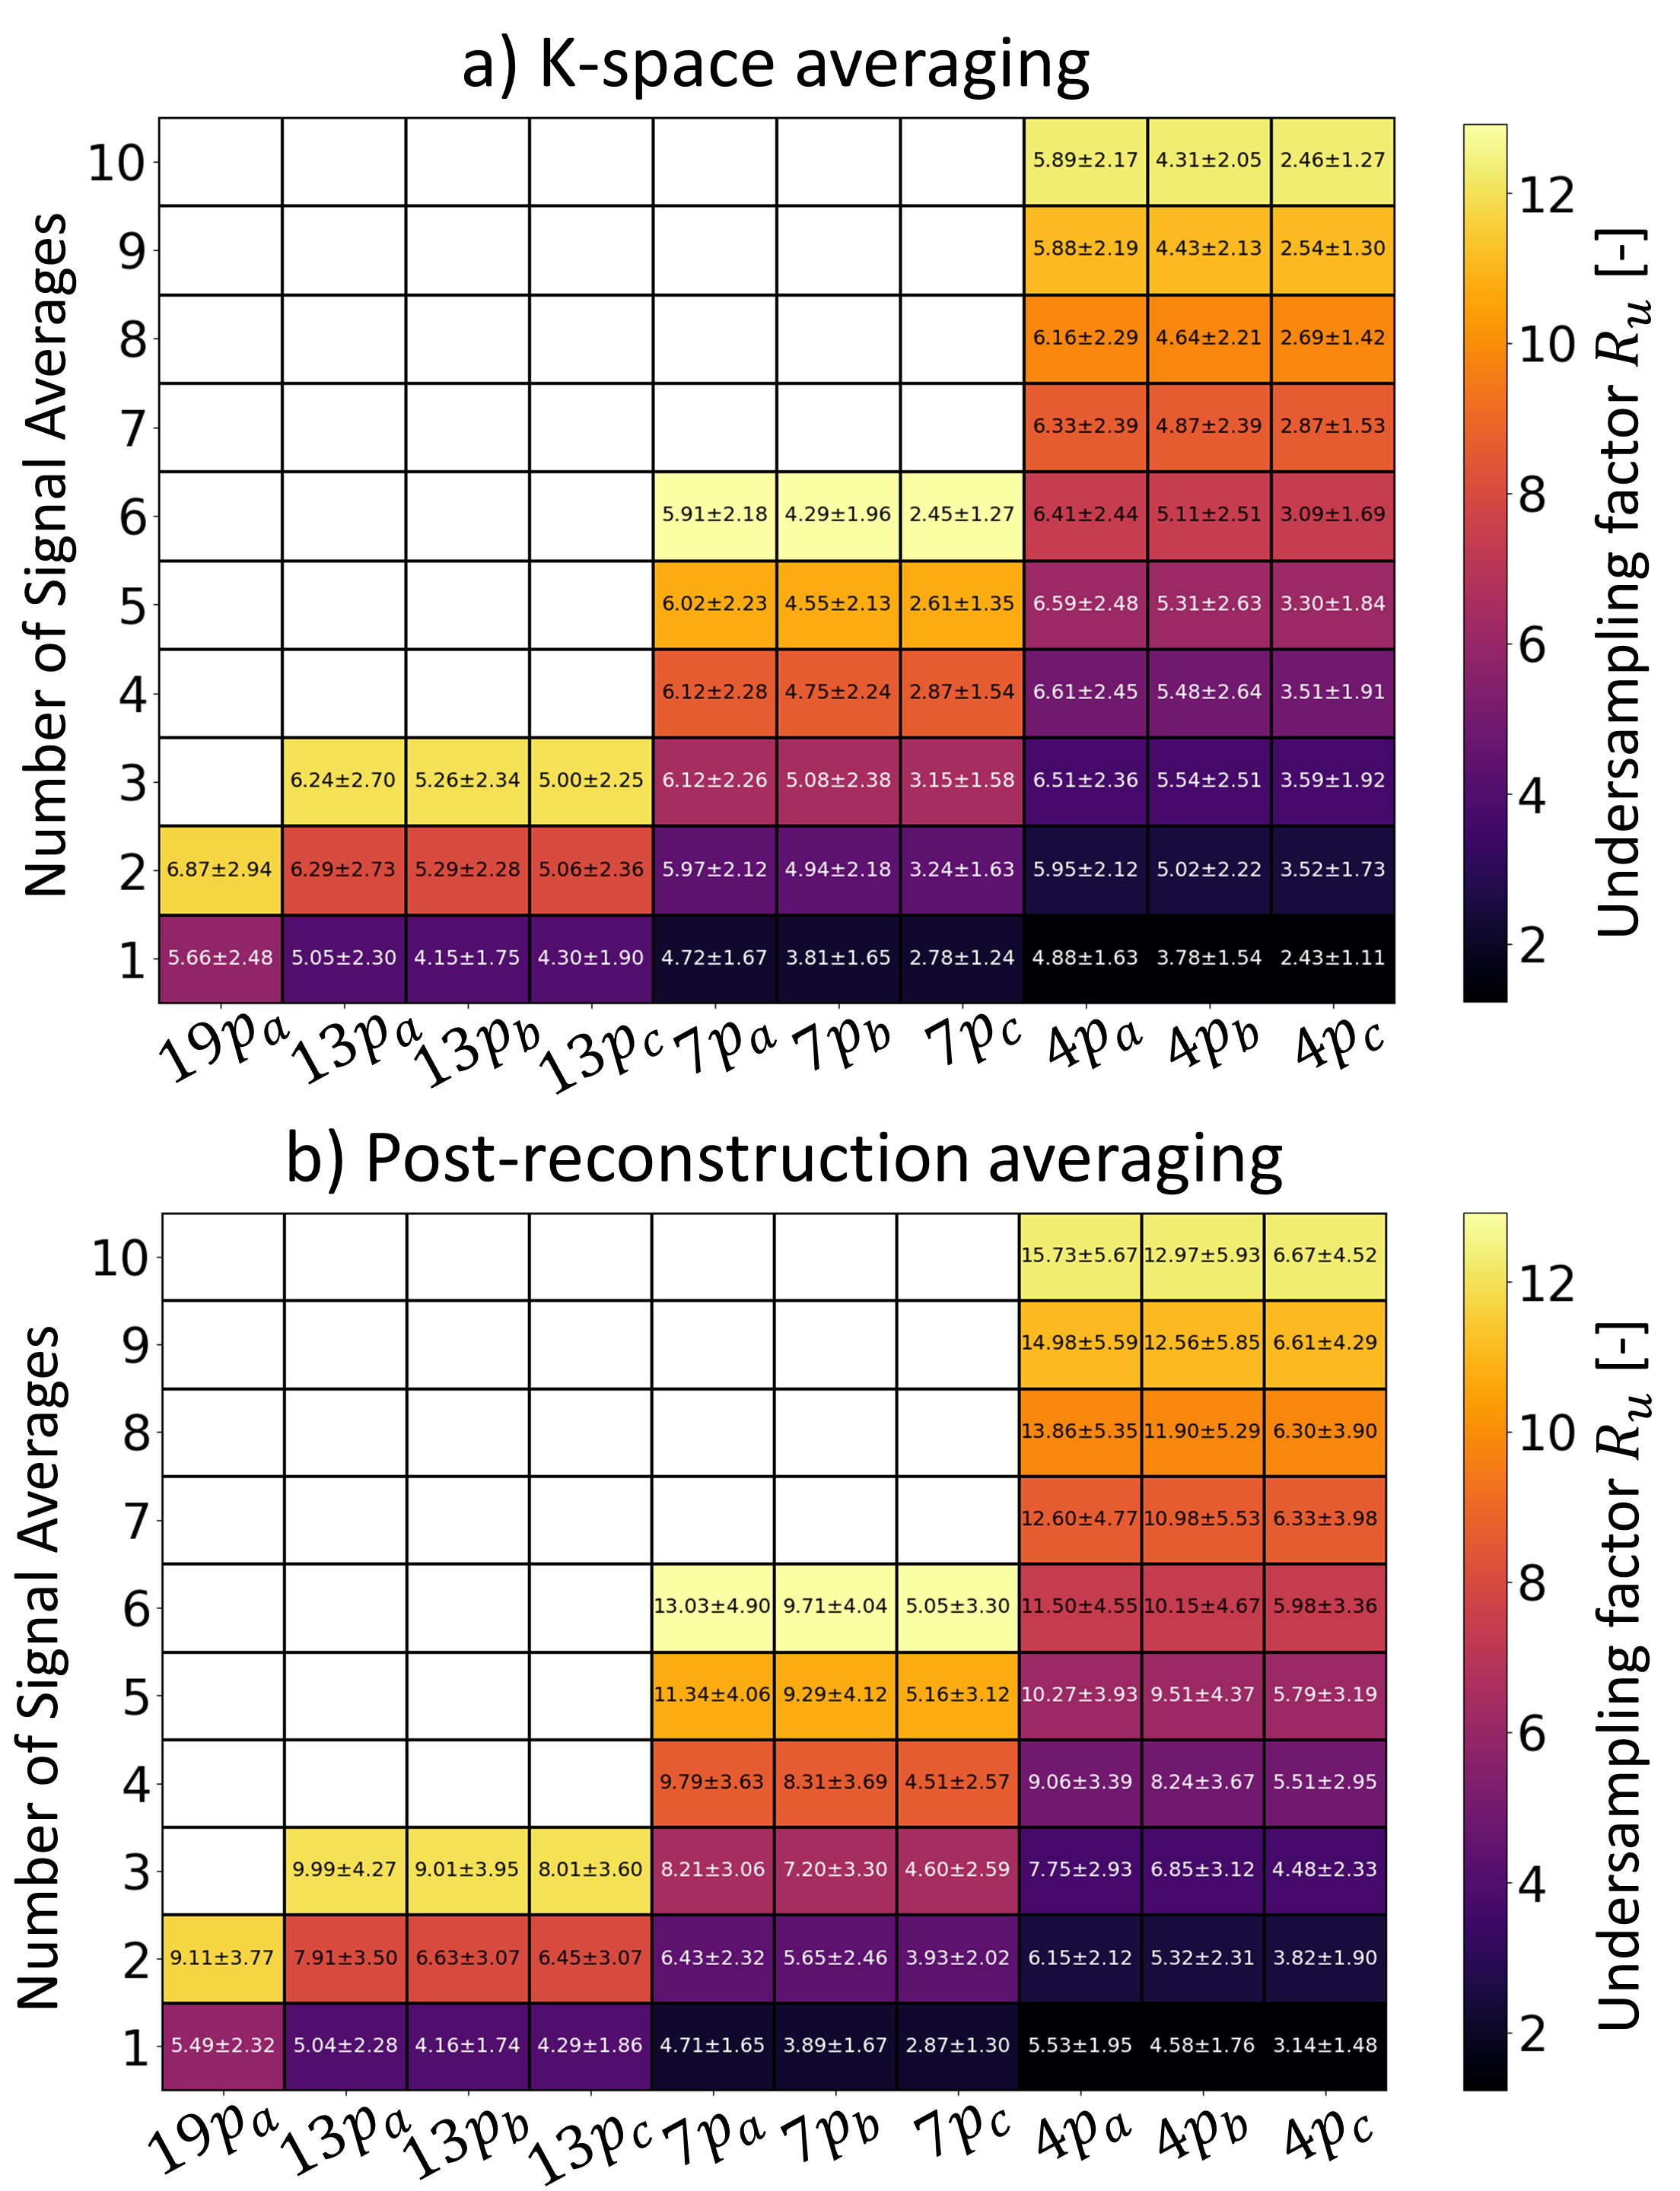
Figure 3: Mean and standard deviation of TNR computed from $$$N_{rep}$$$ repetitions.
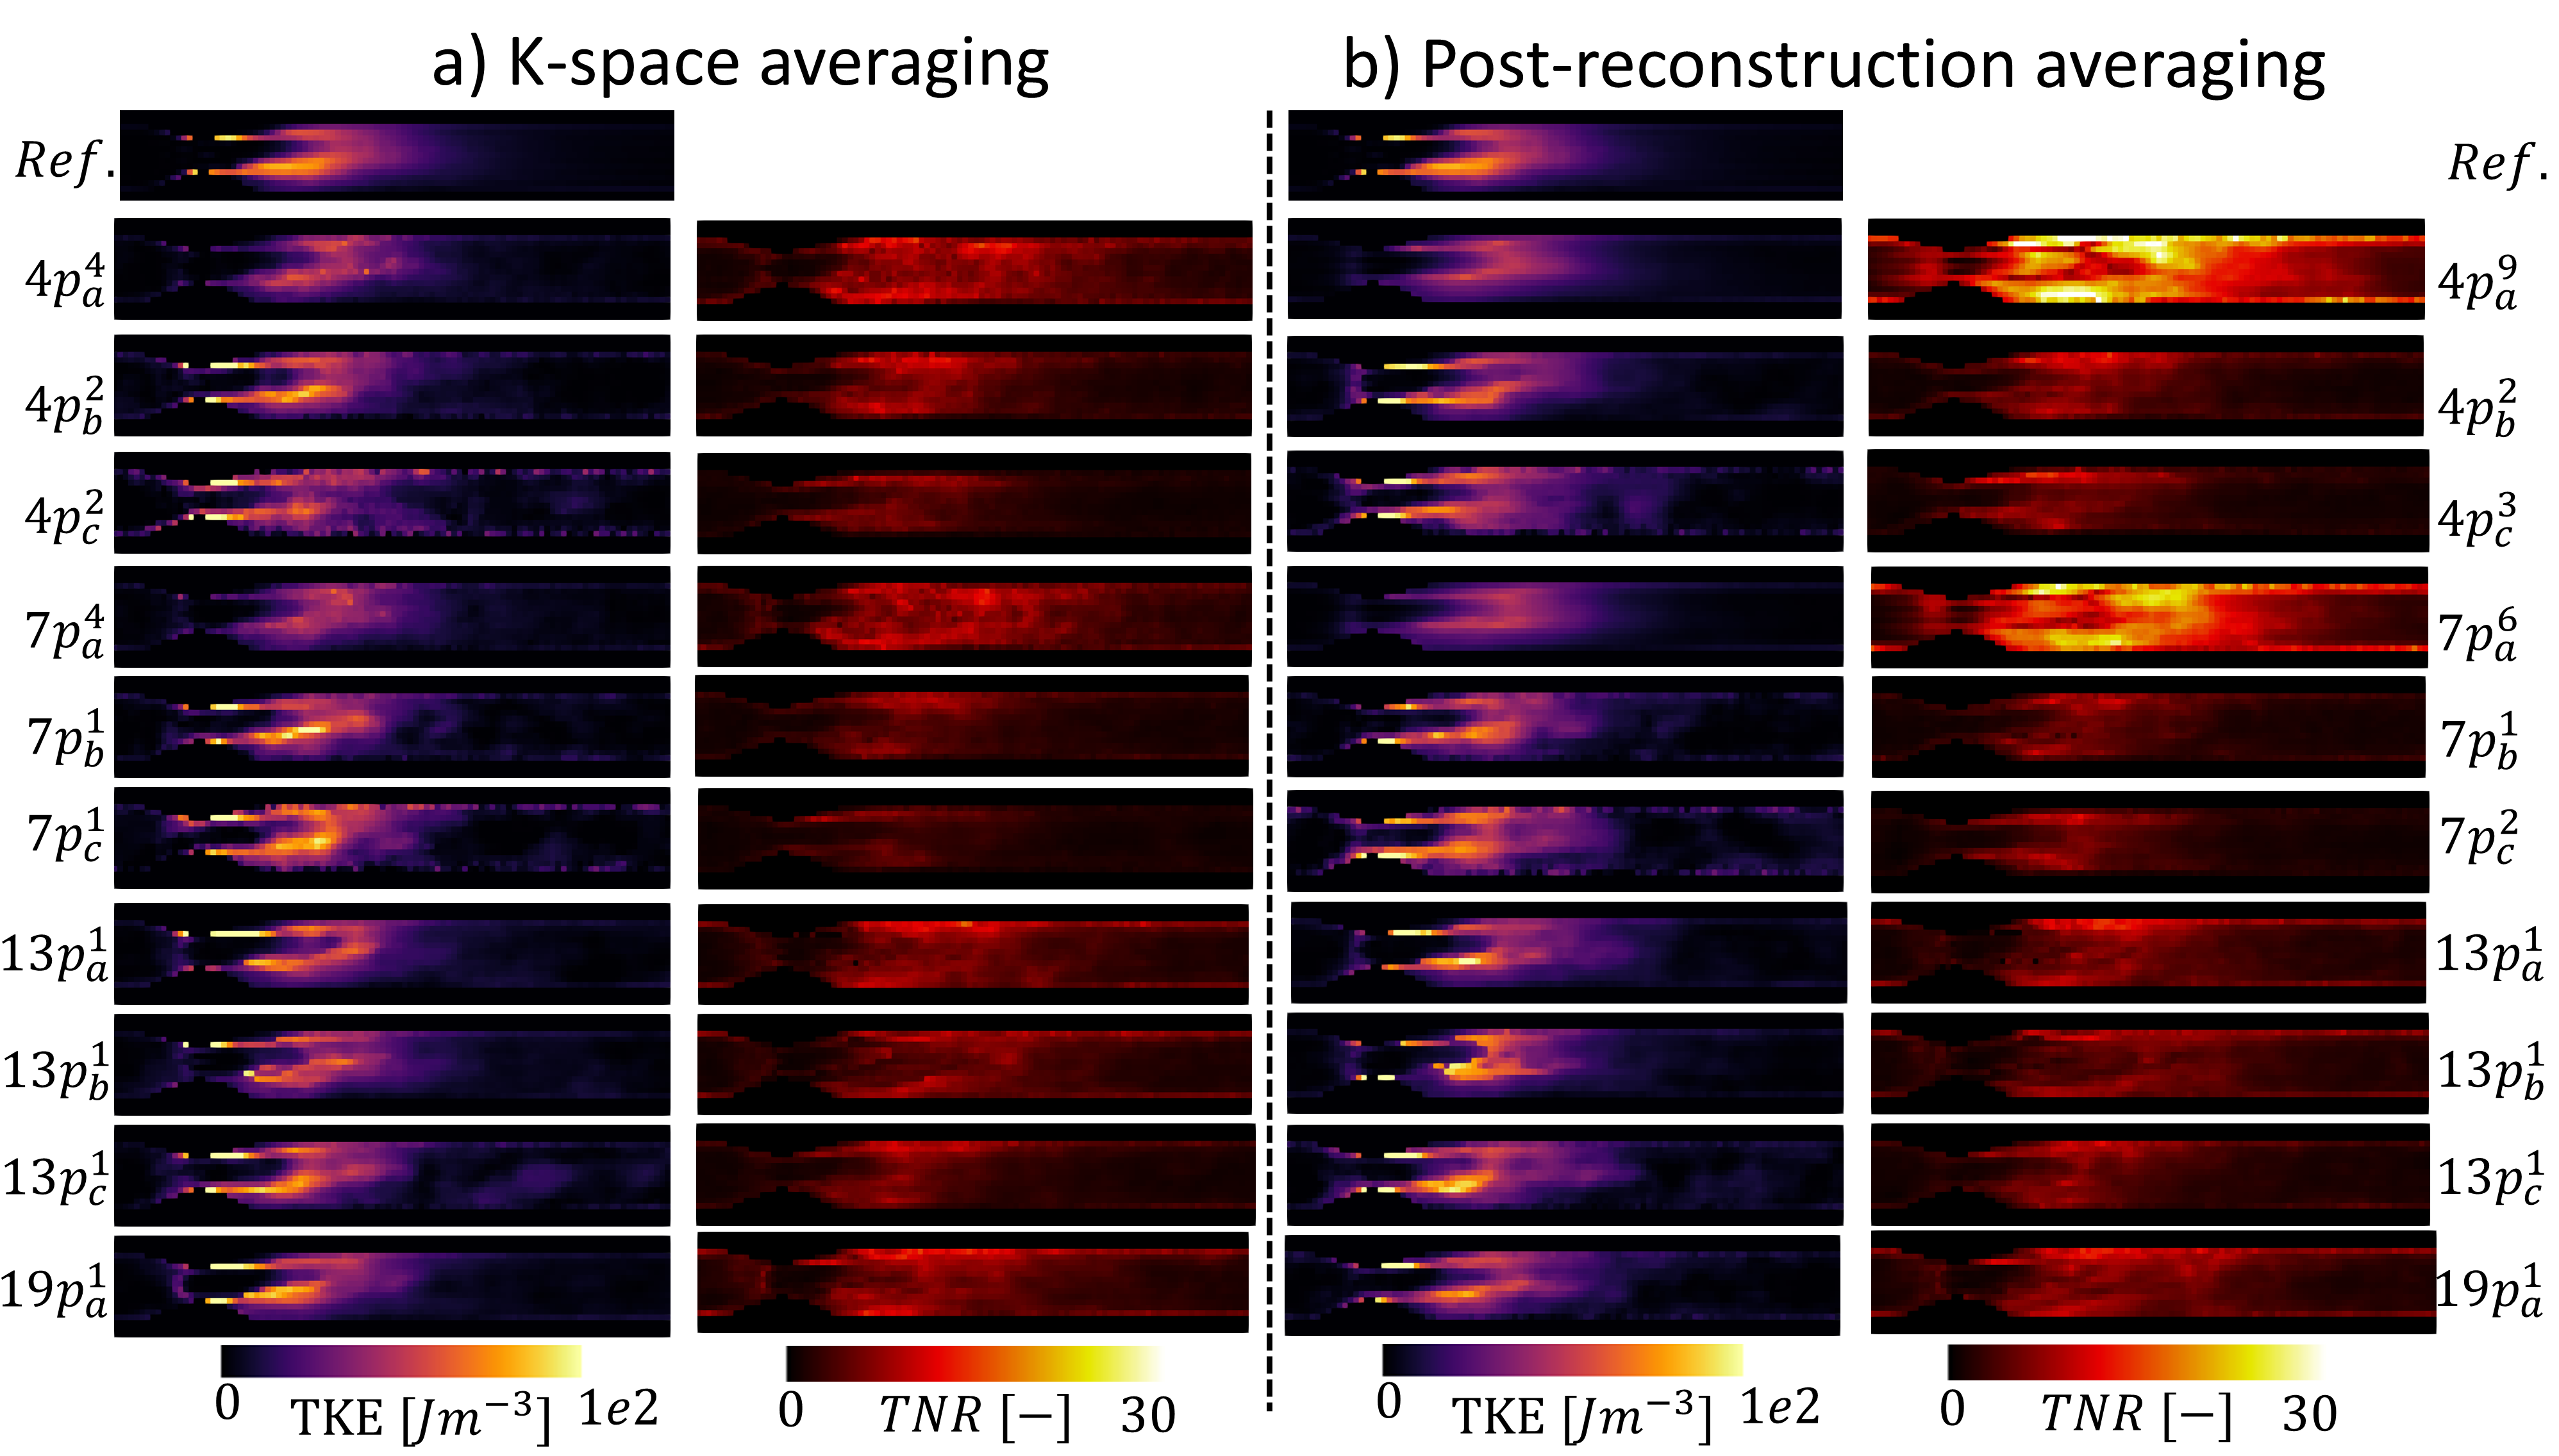
Figure 4: Comparison of TKE and TNR maps of the minimum integrated TKE error scan option for each encoding scheme. Note that for each encoding scheme $$$p^{n_{a}}_{a,b,c}$$$, a, b and c correspond to the $$$V_{ENC}$$$ combination and $$$n_{a}$$$ corresponds to the number of signal averages.
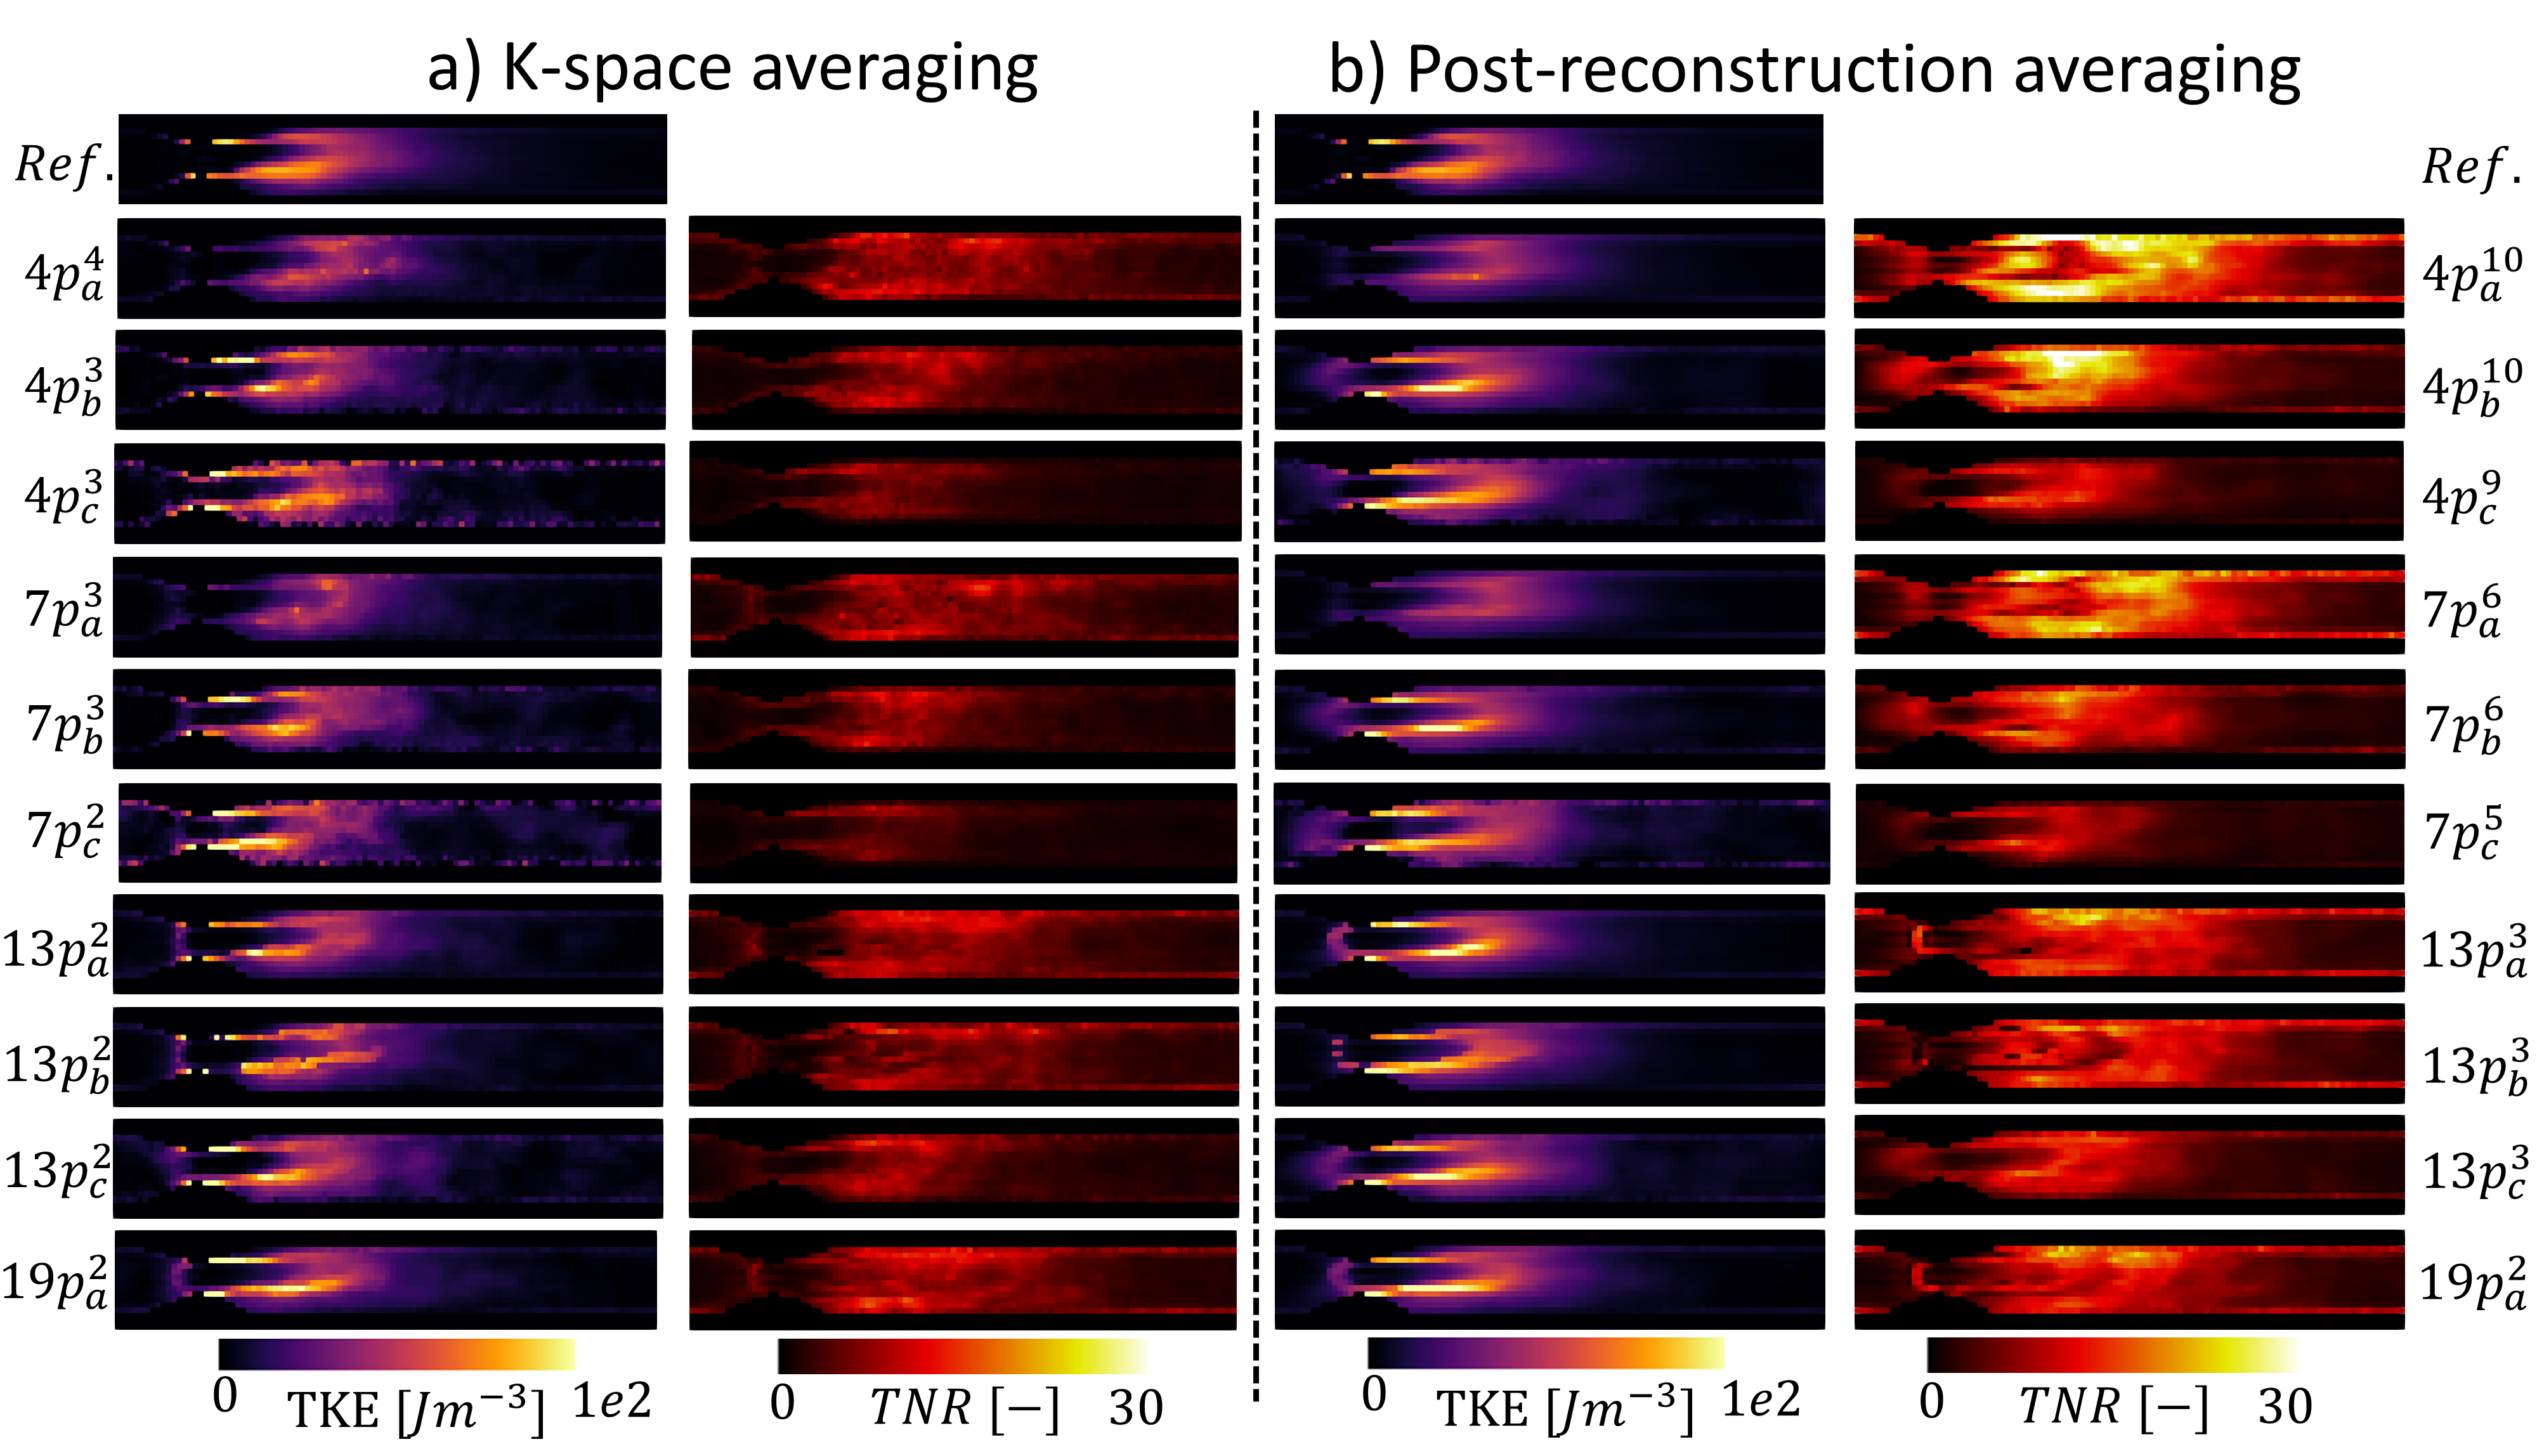
Figure 5: Comparison of TKE and TNR maps of the maximum mean TNR scan option for each encoding scheme. Note that for each encoding scheme $$$p^{n_{a}}_{a,b,c}$$$, a, b and c correspond to the $$$V_{ENC}$$$ combination and $$$n_{a}$$$ corresponds to the number of signal averages.
DOI: https://doi.org/10.58530/2023/3644