3643
3D-pASL and DWI for detection of the function of transplanted kidneys with 1.5T MRI
LING ZHANG 1, Sheng Xie1, Xiuzheng Yue2, Zhenshan Ding1, Xiaoqi Pu1, and Yiwei Li1
1China-Japan friendship hospital, Beijing, China, 2Philips Healthcare, Beijing, China
1China-Japan friendship hospital, Beijing, China, 2Philips Healthcare, Beijing, China
Synopsis
Keywords: Kidney, Transplantation
Kidney Transplanted is the therapyfor patients with end-stage renal disease. Arterial spin labeling (ASL) uses magnetic labeling of water from inflowing blood as an endogenous tracer to acquire maps of absolute regional perfusion. The purpose of this study was to evaluate the blood flow of transplanted kidney allograft using a 1.5T MRI with ASL technique and determine whether renal allograft cortical perfusion by ASL could be a non-invasive biomarker for identifying kidney allograft function. Our data showed DWI and 3D-pCASL could be quantitative non-invasive tools for the clinical translation of identifying kidney allografts with subclinical pathology in further study.Introduction
Kidney Transplanted is the therapy of choice for patients with end-stage renal disease (ESRD)1. Recent advances have demonstrated promising results for MRI to noninvasively assess kidney fibrosis by employing multiparametric functional2. Arterial spin labeling (ASL) uses magnetic labeling of water from inflowing blood as an endogenous tracer to acquire maps of absolute regional perfusion. However, it is limited by its low signal-to-noise ratio3. The purpose of this study was to evaluate the blood flow of transplanted kidney allograft using a 1.5T MRI with arterial spin labeling (ASL) technique and determine whether renal allograft cortical perfusion by ASL could be a non-invasive biomarker for identifying kidney allograft function.Methods
This prospective study included 12 renal transplant patients (46.6±11.1 years, 2 females), and cortical renal blood flow (CRBF) was detected using multiparametric MRI. All the patients did the serum creatinine measurement. DWI (b-values of 0,800 s/mm2) and 3D pulsed ASL (label duration = 1800ms, post label delay = 1600ms) were performed on a 1.5T MR scanner (Ambition, Philips Healthcare, Best, The Netherland) with a 16-channel body coil. The detailed scanning parameters have shown in Table 1. Apparent diffusion coefficient (ADC) maps and RBF maps were generated and measured using Intellispace Portal (Version 10, Philips Healthcare). We sketched the renal cortex manually, including the whole cortex, and placed 3 regions of interest (ROIs) respectively, as large as possible in the renal medulla of the upper, middle, and lower poles of the kidney, and then automatically copied them to the ADC (Figure 1). Spearman correlations were used to analyze the correlations between the renal cortical RBF and the ADC generated from two-b-value DWI and serum creatinine, which is the gold standard index for clinical evaluation of transplanted kidney function.Results
This study consisted of 12 renal transplant patients whose mean serum creatinine was 178±110 μmoI/L, the mean ADC was 1.90±0.20-3 mm2/s, and the mean RBF was 269±69 mL/100 g/min. The ADC negatively correlated with serum creatinine level (r=-0.802, p<0.05). The RBF negatively correlated with serum creatinine level (r=-0.598, p<0.001) (Figure 2). Discussion Due to the fact that microvascular loss, as well as hypoperfusion, are key characteristics of kidney fibrosis, as well as drivers of progressive injury, quantitative measurement of the changes of transplanted renal in perfusion and diffusion may make it possible to predict the function of transplanted renal in the long run. In this study, Cortical ADC and ASL had strong correlation with serum creatinine, which is the gold standard index for clinical evaluation of transplanted kidney function. And DWI and 3D-pCASL can provide a more accurate and comprehensive understanding of the functional information of transplanted kidney metabolism, which is beneficial to a selection of treatment drugs and provides an important reference value for the diagnosis, staging, treatment, and prognosis of CKD in transplanted kidneys.Discussion
Due to the fact that microvascular loss, as well as hypoperfusion, are key characteristics of kidney fibrosis, as well as drivers of progressive injury, quantitative measurement of the changes of transplanted renal in perfusion and diffusion may make it possible to predict the function of transplanted renal in the long run. In this study, Cortical ADC and ASL had strong correlation with serum creatinine, which is the gold standard index for clinical evaluation of transplanted kidney function. And DWI and 3D-pCASL can provide a more accurate and comprehensive understanding of the functional information of transplanted kidney metabolism, which is beneficial to a selection of treatment drugs and provides an important reference value for the diagnosis, staging, treatment, and prognosis of CKD in transplanted kidneys.Conclusions
DWI and 3D-pCASL could be quantitative non-invasive tools for the clinical translation of identifying kidney allografts with subclinical pathology in further study.Table 1: the details of parameters and scan time for DWI and ASL protocols
| Parameters | DWI | 3D pCASL |
| TR\TE (ms) | 1200/78 | 3746/13 |
| FOV (mm2) | 400×328 | 400×277 |
| Matrix | 132×110 | 68×60 |
| Slice thickness (mm) | 6 | 8 |
| b value () | 0/800 | --- |
| PLD/label duration time (ms) | --- | 1600/1800 |
| Scan time | 1m34s | 4m52s |
Acknowledgements
References
1. Francis A, Baynosa R. Ischaemia-reperfusion injury and hyperbaric oxygen pathways: a review of cellular mechanisms. Diving Hyperb Med, 2017, 47:110-117.
2. Buchanan CE, Mahmoud H, Cox EF et al. Quantitative assessment of renal structural and functional changes in chronic kidney disease using multi-parametric magnetic resonance imaging. Nephrol Dial Transplant 2020, 35:955–964.
3. Ren T, Wen CL, Chen LH et al. Evaluation of renal allografts function early after transplantation using intravoxel incoherent motion and arterial spin labeling MRI. Magn Reson Imaging 2016, 34: 908–914.
Figures
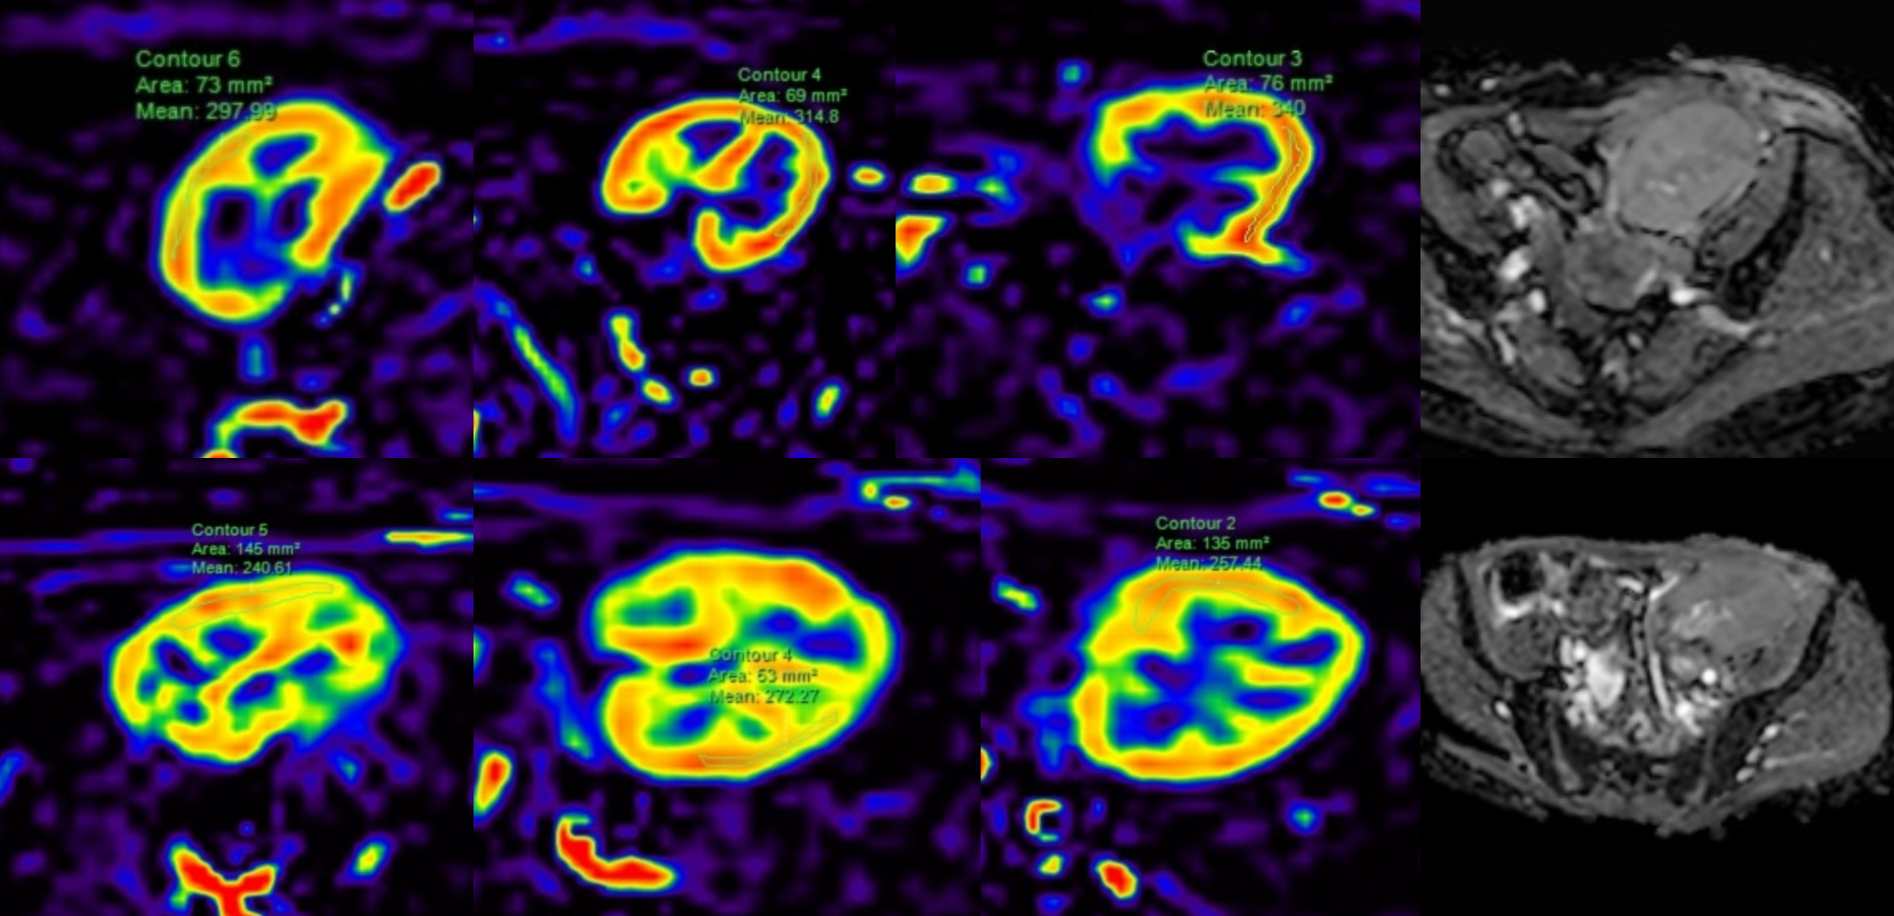
Figure
1 shows ROIs of RBF maps for three slices and ADC maps, which could discriminate
the cortex and medulla of the allograft of two patients.
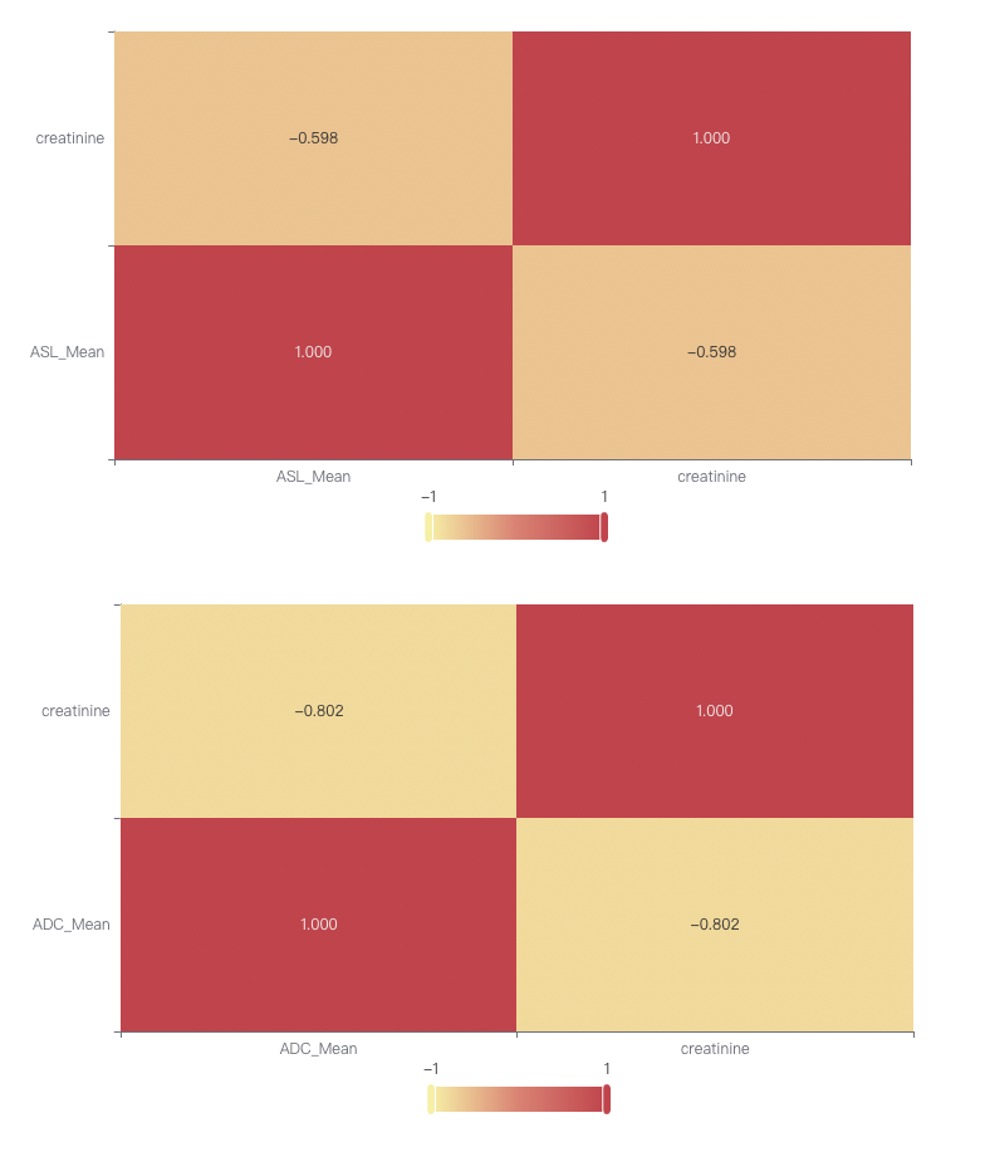
Figure 2 shows the ADC negatively correlated
with serum creatinine level (r=-0.802, p<0.05). The RBF negatively correlated with serum
creatinine level (r=-0.598, p<0.001)
DOI: https://doi.org/10.58530/2023/3643