3642
ABSOLUTE QUANTIFICATION OF RENAL ASL IN DOGS1Radiology, Ghent University, AALTER, Belgium, 2Morphology, Imaging, Orthopedics, Rehabilitation and Nutrition, Ghent University, Ghent, Belgium, 3Ghent Institute of Functional and Metabolic Imaging, Ghent University, Ghent, Belgium
Synopsis
Keywords: Kidney, Arterial spin labelling
Arterial Spin Labeling (ASL) is a noninvasive fMRI technique that may evaluate canine renal condition. To date, however, the parameters to estimate the renal blood flow (RBF) have not been calculated on dogs. Therefore, λ: blood-tissue water partition coefficient in kidneys and canine at 3T were measured. Measured λ was 0.91[mL/g] and was 1463 ms. With these new values RBF maps were calculated and then compared against the RBF maps given by the scanner. This pilot study demonstrates the relevance of the ASL parameters estimation for the RBF maps calculation in canine kidney.
Introduction
Dogs' prevalence of CKD ranges between 0,5% - 7%1. There has been an encouragement for new or better methods to diagnose renal conditions and explain the pathophysiological progression2,3. Existing techniques are uncomfortable or ineffective3,4,5. In this study we relayed in a noninvasive technique, arterial spin labeling (ASL) fMRI. Renal ASL in dogs has been reported in a single pilot study18. Critical parameters for quantification of renal ASL in dogs are unavailable, such as the blood-tissue water partition coefficient (λ), and the longitudinal relaxation time of blood. The objective is to evaluate the parameters required to quantify renal blood flow (RBF) in dogs and to compare the differences against the scanner output.RBF maps are computed following equation6 $$$f = \frac{\lambda}{2 \alpha TI_2}\frac{\Delta M(TI)}{M_0} \exp(\frac{TI_1}{T_1})$$$. Usually, the value of λ is obtained from literature7 as 0.9 ml/100g, for brain tissue. As a 10% change in λ would result in a 10% quantification error, it is of great importance to measure λ in renal tissue. The same holds for the value as it has been shown that using an incorrect value results in significant SNR changes16.
Methods
To determine λ, the following equation was used7: $$$λ=((Kw)/(Bw))/(Bd)$$$ A sample from a healthy beagle kidney was obtained from a separate study. Kidney water content ($$$K_w$$$) was estimated with a moisture analyser. Blood water content follows7: $$$B_w=Hct\cdot d_{rbc}\cdot w_{rbc}+(1-Hct)\cdot d_{pl}\cdot w_{pl} [3]$$$ where: Hct: Haematocrit, $$$d_{rbc}$$$ Red cell density8, $$$w_{rbc}$$$ red cells water content9, $$$d_{pl}$$$ density of plasma10, $$$w_{pl}$$$ plasma water content9 and Blood density $$$B_d$$$ are obtained from literature11,12,13. A blood sample was taken from a healthy beagle. The sample was scanned with a 2D single-slice inversion recovery turbo spinecho sequence following literataure17, TR/TE = 10000/8.8 ms, Voxel size 0.8x0.8x5mm, turbo factor 7, bandwidth: 352 Hz/Px, with inversion times in seconds [0.05, 0.1, 0.4, 1, 1.6, 1.9]. T1 was estimated by fitting the signal intensities using qMRLab–MATLAB software. One healthy purpose-bred beagle was scanned in dorsal recumbency on a Siemens PrismaFit 3T. RBF was measured using a FAIR-QTIPS ASL sequence (Siemens WIP-ASP 1023H), with TI1 2000ms, Bolus-length 1000ms. TR/TE 4500/23.58ms, matrix 64x64, 8 oblique coronal 8mm slices and 272x136mm Field of view. The TLCO (Twelve-Layer Concentric-Objects) method14 was used to calculate perfusion values across the kidney. Inline generated RBF maps with T1=1250ms and λ=0.9 were compared against corrected RBF maps, generated offline in Python, with the measured and λ values.Results
$$$K_{w}$$$ in two samples was measured 79.99–80.36 [g/g].$$$B_{w}$$$ was computed according to literature values as:
· $$$d_{rbc}$$$=1.074–1.101$$$ w_{rbc}$$$=68g/100g=0.678
· $$$w_{pl}$$$ = 93g/100g = 0.927 $$$d_{pl}$$$ = 1.015-1.025
· Hct = 48.5% value was measured from post-mortem blood sample.
Then, $$$B_{w}$$$ [g/g].
$$$B_{d}$$$ from literature as: 1.047-1.055 g/ml, giving a value of 𝜆=0.91[mL/g].
Measured T1 mean value in blood sample was 1254.84ms±185.46. As the scanning room is configured to be at 19, and the body temperature of a dog is 38$$$^{\circ}C$$$, T1 needs to be corrected. In15 a difference of 11ms per is reported. It follows that the corrected is 1254+19*11=1463ms. In the ASL sequence, a of 1250ms is assumed. The theoretical SNR in a FAIR PASL experiment, is16 $$$SNR \propto \exp(-PLD/T_{1,blood})$$$ With a Post-Label Delay of 2000ms, the potential SNR gain is 26%.
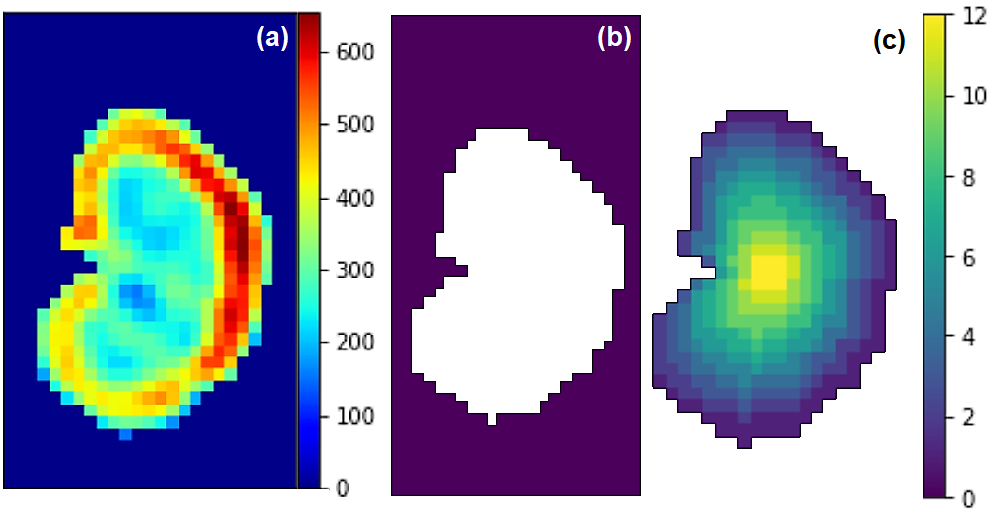
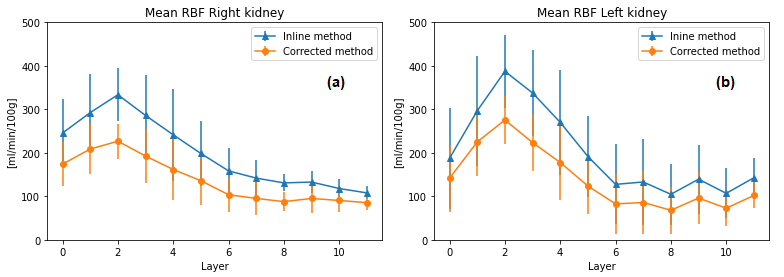
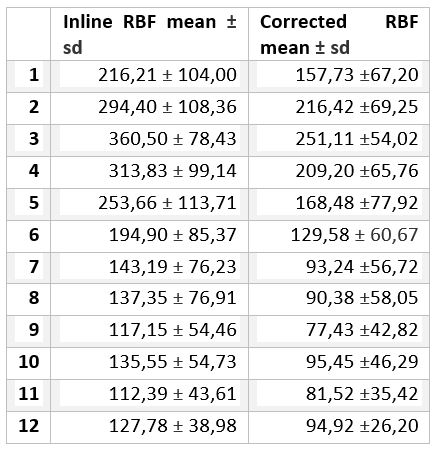
Figure 1 shows the RBF maps, the kidney mask and TLCO algorithm. Figure 2 shows the TLCO method applied to both kidneys and both corrected and inline RBF map calculation. Table 1 shows the mean and standard deviation for both kidneys together, 0 represents the outermost layer and 11 represents the innermost layer.
Discussion
The measured value for 𝜆, seems to be in range with literature values6,19, these values are often assumed to be between 0,8 - 0,9 [mL/g] in humans. However, it is required to perform additional moisture tests in canine kidneys, to verify this 𝜆 value across dog breed.To our knowledge is the first time that the is measured in a 3T scanner, therefore this test should be repeated in different centers and with multiple blood samples.
The scanner generates inline RBF maps with fixed value of 𝜆 = 0.9 and user-defined T1=1250ms. As both computed values in this experiment are higher, following equation [1], it is expected that corrected RBF maps have lower perfusion values, but with a higher SNR. This is reflected in Table 1, where we found lower RBF values, but also lower standard deviations, making the measurements more accurate using correct value.
Conclusion
In this study we demonstrate that blood-tissue water partition coefficient and in dogs, present changes compared to the values used in humans ASL. Yet, it is still required to increase the number of samples to have a more precise estimation of these parameters. ASL-MRI might provide insights for diagnosis of kidney illnesses and explanation of pathophysiological progressions in dogs. This canine research could be considered to confirm the use of ASL in human renal assessment.Acknowledgements
1. Lund EM, Armstrong PJ, Kirk CA, Kolar LM, Klausner JS. Health status and population characteristics of dogs and cats examined at private veterinary practices in the United States. Journal of the American Veterinary Medical Association 1999 May;214:1336–41.
2. Miyagawa Y, Takemura N, Hirose H. Assessments of factors that affect glomerular filtration rate and indirect markers of renal function in dogs and cats. The Journal of veterinary medical science 2010 Sep;72:1129–36.
3. 5. Von Hendy-Willson VE, Pressler BM. An overview of glomerular filtration rate testing in dogs and cats. Veterinary journal (London, England : 1997) 2011 May;188:156–65.
4. Schneider M. In: Kiessling F, Pichler BJ, editors. Ultrasound Contrast Agents Berlin, Heidelberg: Springer Berlin Heidelberg; 2011. p. 219–229. https://doi.org/10.1007/ 978-3-642-12945-2_16.
5. Kazmierski B, Deurdulian C, Tchelepi H, Grant EG. Applications of contrast-enhanced ultrasound in the kidney. Abdominal radiology (New York) 2018 Apr;43:880–898.
6. Nery, F., Buchanan, C.E., Harteveld, A.A. et al. Consensus-based technical recommendations for clinical translation of renal ASL MRI. Magn Reson Mater Phy 33, 141–161 (2020). https://doi.org/10.1007/s10334-019-00800-z
7. Herscovitch P, Raichle ME. What is the Correct Value for the Brain-Blood Partition Coefficient for Water? Environment and Behavior. 1985;5(1):487-510. doi:10.1177/0013916504269666
8. Baik SJ. Distribution of dog erythrocyte density and relationship to cell suspension viscosity. University of Tennessee; 2002.
9. Clausen G, Hope A, Aukland K. Partition of 125I‐iodoantipyrine among erythrocytes, plasma, and renal cortex in the dog. Acta Physiol Scand. 1979;107:63–8.
10. Kenner T, Moser M, Hinghofer-Szalkay, Mohl W. Indirect Determination of Fluid Filtration and Reabsorption in the Microcirculation of the Myocardium. Biomed Eng / Biomed Tech. 1984;29:108–16.
11. Remington JW, Baker CH. Blood and plasma specific gravity changes during acute alterations in hemodynamics in splenectomized dogs. Circ Res. 1958;6:146–54.
12. Stebbins GG, Leake CD. Diurnal variations in blood specific gravity in normal dogs and humans. Am J Physiol Content. 1926;80:639–42.
13. Lee J-S, Lee L-P. Ventilatory changes of pulmonary capillary blood volume assessed by arterial density. J Appl Physiol. 1986;61:1724–31.
14. Piskunowicz M, Hofmann L, Zuercher E, Bassi I, Milani B, Stuber M, et al. A new technique with high reproducibility to estimate renal oxygenation using BOLD-MRI in chronic kidney disease. Magnetic resonance imaging 2015 Apr;33:253–6117.
15. Captur, G., Bhandari, A., Brühl, R. et al. T1 mapping performance and measurement repeatability: results from the multi-national T1 mapping standardization phantom program (T1MES). J Cardiovasc Magn Reson 22, 31 (2020). https://doi.org/10.1186/s12968-020-00613-3
16. Zhang X, Petersen ET, Ghariq E, De Vis JB, Webb AG, Teeuwisse WM, Hendrikse J, van Osch MJ. In vivo blood T(1) measurements at 1.5 T, 3 T, and 7 T. Magn Reson Med. 2013 Oct;70(4):1082-6. doi: 10.1002/mrm.24550. Epub 2012 Nov 21. PMID: 23172845.
17. Wolf, Marcos; Kommer, Stefan; Fembek, Sebastian; Dröszler, Uwe; Körner, Tito; Berg, Andreas; et al. (2022): Reproducible phantom for quality assurance in abdominal MRI focussing kidney imaging. Frontiers. Collection. https://doi.org/10.3389/fphy.2022.993241
18. Hillaert A, Vanderperren K, Pullens P, (2022) Measurement of renal perfusion using ASL-MRI and renal oxygenation using BOLD-MRI in dogs: a pilot study
19. Cox EF, Buchanan CE, Bradley CR, Prestwich B, Mahmoud H, Taal M, et al. Multiparametric Renal Magnetic Resonance Imaging: Validation, Interventions, and Alterations in Chronic Kidney Disease. Frontiers in physiology 2017;8:696.
References
The authors thank Dr. Bernd Kühn (Siemens Healthcare AG, Erlangen, DE) for providing the ASL WIP sequence.
Figures