3641
Quantitative MR Images of Renal Parenchymal Disease: An Experimental In Vivo Study Using Rat Chronic Kidney Disease Models1Radiology, Seoul National University Hospital, Seoul, Korea, Republic of
Synopsis
Keywords: Kidney, Quantitative Imaging
Quantitative MRI sequences could be a noninvasive assessment modality in the diagnosis and evaluation of CKD. In particular, T1ρ may be a suitable MR sequence parameter to assess renal parenchymal fibrosis in a quantitative manner. Moreover, monitoring the change in common metabolites using MRS may reflect the alteration of osmolality in the renal medulla in CKD.This study aimed to validate the usefulness of quantitative multiparametric magnetic resonance imaging (MRI) sequence parameters and suggest suitable spectroscopic metabolites in the evaluation of parenchymal fibrosis using an experimental animal model of chronic kidney disease (CKD) by long-term adenine intake.
Materials and Methods
Experimental adenine intake in rats induces renal dysfunction due to the deposition of 2,8-dihydroxyadenine crystals in the renal parenchyma. This pathophysiologic progression resembles that of human CKD. A total of 16 male Wistar rats were analyzed. They were divided into three groups: control (n = 7), CKD1 (n = 5), and CKD2 (n = 4). The CKD groups were kept under the 3- or 6-week term intake of 0.25% adenine. According to the group assignment, quantitative MRI sequences, including diffusion-weighted image, T1ρ (T1 rho), T2* mapping, and in vivo MR spectroscopy (1H-MRS), were performed using a 9.4T animal MR scanner. A semiquantitative histopathologic analysis for renal fibrosis was conducted. Comparative analyses of quantitative MR values measured from anatomic regions of kidneys between groups were performed.
Results
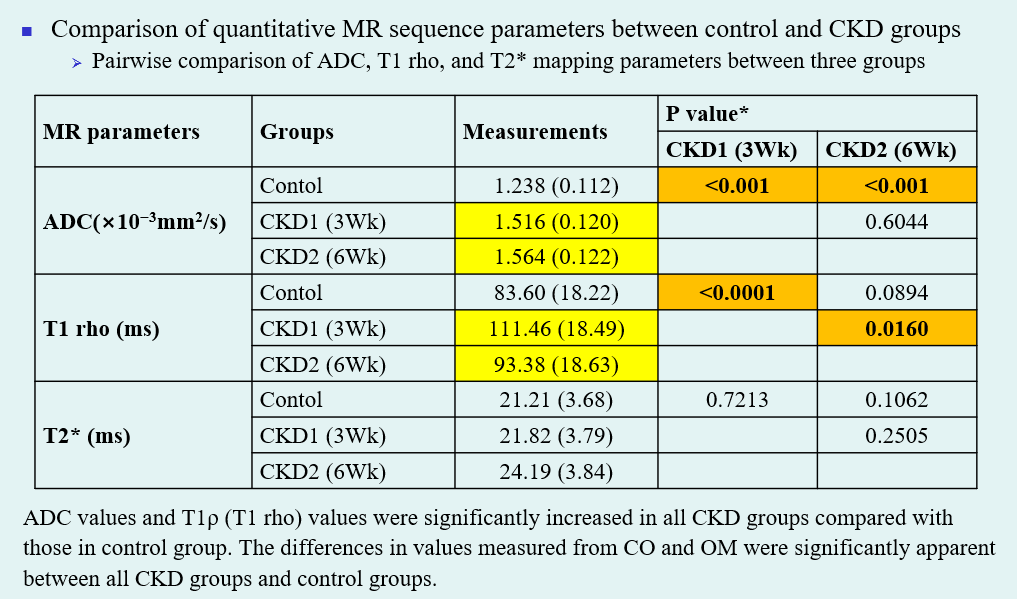
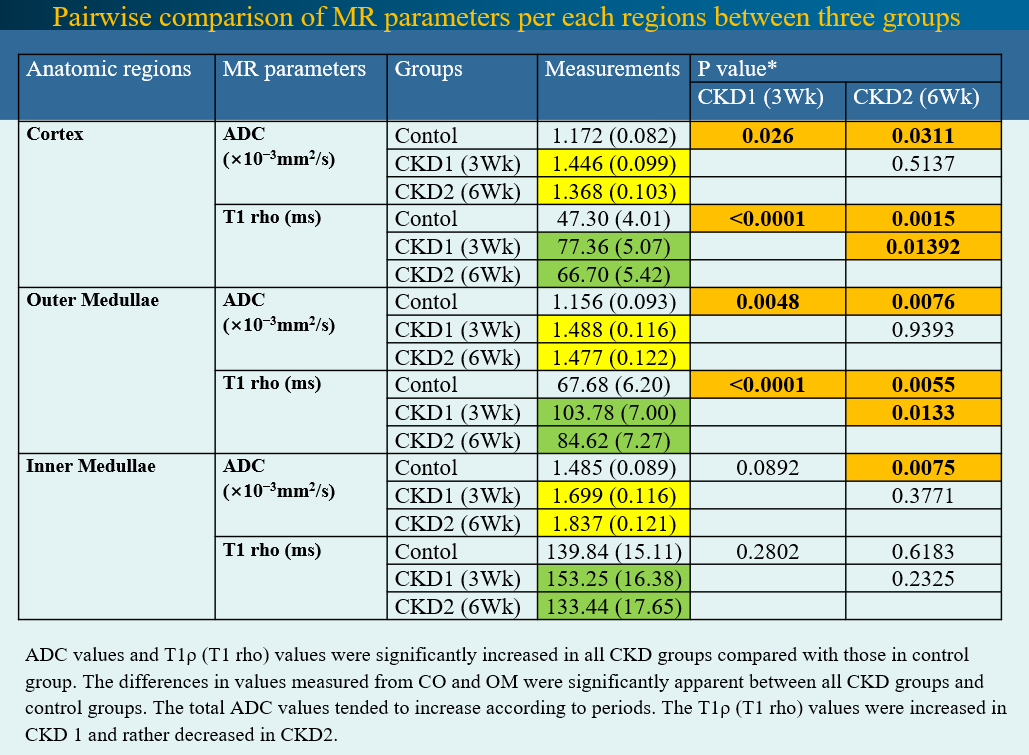
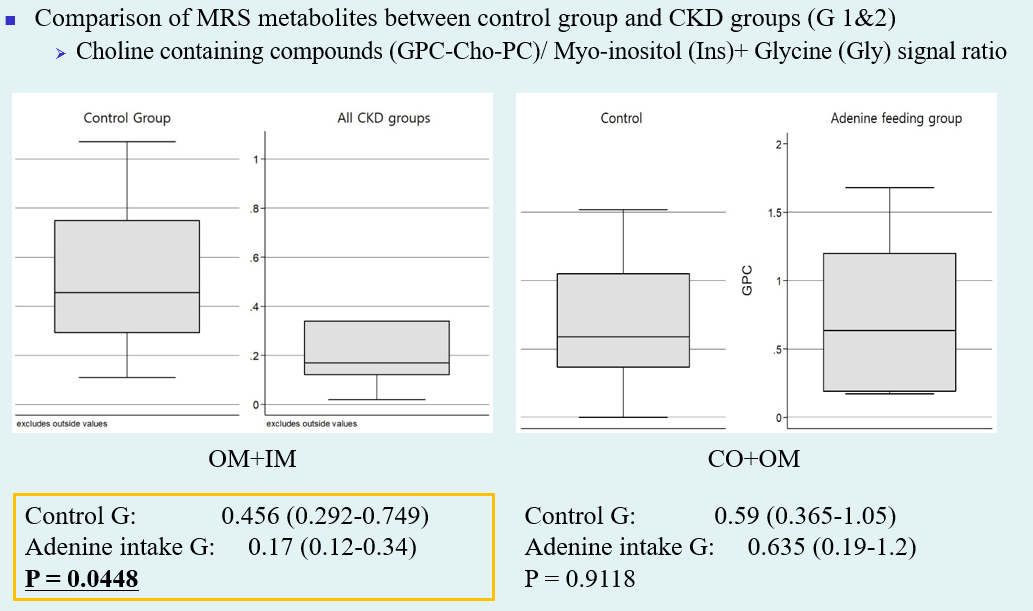
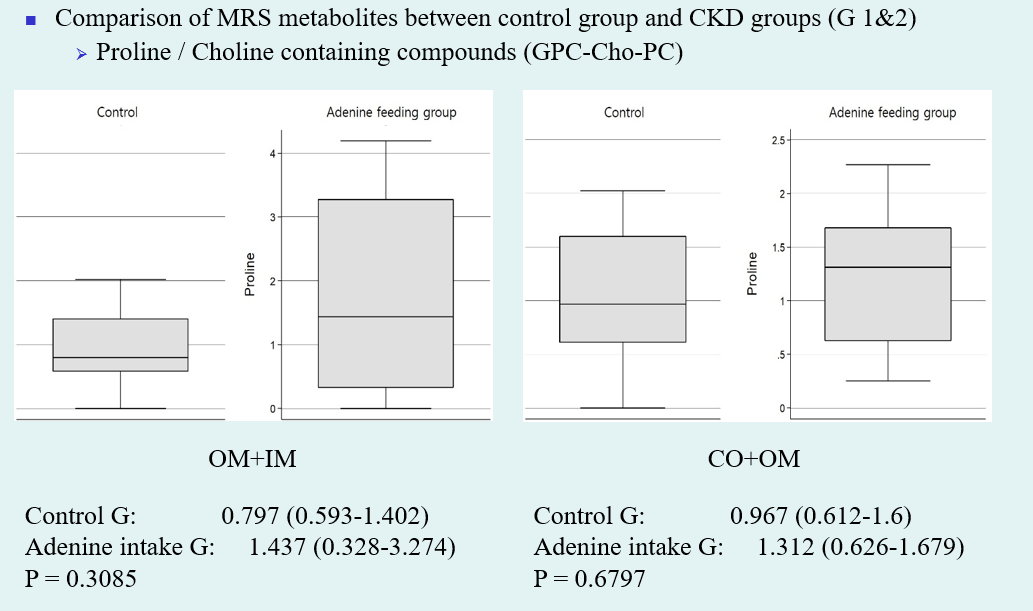
Compared to the control group, significant histopathologic changes were observed in CKD groups according to periods. The apparent diffusion coefficient (ADC) and T1 (T1 rho) values were significantly increased in all CKD groups compared with those in the control group. The differences in values measured from the cortex and outer medulla were significant between the CKD and control groups. The total ADC values tended to increase according to periods. The T1ρ (T1 rho) values were increased in the CKD1 group and decreased in the CKD2 group. Among MRS metabolites acquired from each region, the ratio of glycerophosphorylcholine–choline–phosphatidylcholine signals to myo-inositol–glycine signals collected from voxels located at medulla region was significantly lower in the CKD groups than in the control group (0.17 vs. 0.456, P = 0.0448).
Conclusion
Quantitative MRI sequences could be a noninvasive assessment modality in the diagnosis and evaluation of CKD. In particular, T1ρ may be a suitable MR sequence parameter to assess renal parenchymal fibrosis in a quantitative manner. Moreover, monitoring the change in common metabolites using MRS may reflect the alteration of osmolality in the renal medulla in CKD.
Acknowledgements
No acknowledgement found.References
Inoue T, Kozawa E, Okada H, et al. Noninvasive evaluation of kidney hypoxia and fibrosis using magnetic resonance imaging. J Am Soc Nephrol 2011;22:1429-1434.
Diwan V, Brown L, Gobe GC. Adenine-induced chronic kidney disease in rats. Nephrology (Carlton) 2018;23:5-11.
Charagundla SR, Borthakur A, Leigh JS, Reddy R. Artifacts in T(1rho)-weighted imaging: correction with a self-compensating spin-locking pulse. J Magn Reson 2003;162:113-121.
Togao O, Doi S, Kuro-o M, et al. Assessment of renal fibrosis with diffusion-weighted MR imaging: study with murine model of unilateral ureteral obstruction. Radiology 2010;255:772-780.
Woo S, Cho JY, Kim SY, Kim SH. Intravoxel incoherent motion MRI-derived parameters and T2* relaxation time for noninvasive assessment of renal fibrosis: An experimental study in a rabbit model of unilateral ureter obstruction. Magn Reson Imaging 2018;51:104-112.
Thoeny HC, De Keyzer F. Diffusion-weighted MR imaging of native and transplanted kidneys. Radiology 2011;259:25-38.
Boor P, Perkuhn M, Weibrecht M, et al. Diffusion-weighted MRI does not reflect kidney fibrosis in a rat model of fibrosis. J Magn Reson Imaging 2015;42:990-998.
Schley G, Jordan J, Ellmann S, et al. Multiparametric magnetic resonance imaging of experimental chronic kidney disease: A quantitative correlation study with histology. PLoS One 2018;13:1-18.
Wang YX, Yuan J, Chu ES, et al. T1rho MR imaging is sensitive to evaluate liver fibrosis: an experimental study in a rat biliary duct ligation model. Radiology 2011;259:712-719.
Hu G, Liang W, Wu M, et al. Comparison of T1 mapping and T1rho values with conventional diffusion-weighted imaging to assess fibrosis in a rat model of unilateral ureteral obstruction. Acad Radiol 2019;26:22-29.
Hectors SJ, Bane O, Kennedy P, et al. T1ρ mapping for assessment of renal allograft fibrosis. J Magn Reson Imaging 2019;50:1085-1091.
Prasad P, Li LP, Halter S, et al. Evaluation of renal hypoxia in diabetic mice by BOLD MRI. Invest Radiol 2010;45:819-822.
Bagnasco S, Balaban R, Fales HM, Yang YM, Burg M. Predominant osmotically active organic solutes in rat and rabbit renal medullas. J Biol Chem 1986;261:5872-5877.
Chang HH, Chao HN, Walker CS, Choong SY, Phillips A, Loomes KM. Renal depletion of myo-inositol is associated with its increased degradation in animal models of metabolic disease. Am J Physiol Renal Physiol 2015;309:F755-F763.
Sharma I, Deng F, Liao Y, Kanwar YS. Myo-inositol Oxygenase (MIOX) overexpression drives the progression of renal tubulointerstitial injury in diabetes. Diabetes 2020;69:1248-1263.
Martínez-Granados B, Morales JM, Rodrigo JM, et al. Metabolic profile of chronic liver disease by NMR spectroscopy of human biopsies. Int J Mol Med 2011;27:111-117.
Figures