3639
Noninvasive assessment of the renal function, the Oxford classification and the prognostic risk stratification of IgAN by DWI and BOLD MRI1Radiology, Tongji Hospital, Tongji Medical College, Huazhong University of Science and Technology, Wuhan, China
Synopsis
Keywords: Kidney, Diffusion/other diffusion imaging techniques
Purpose To explore whether IVIM-DWI and BOLD-MRI can assess the renal function, Oxford classification and prognostic risk stratification of IgAN patients.
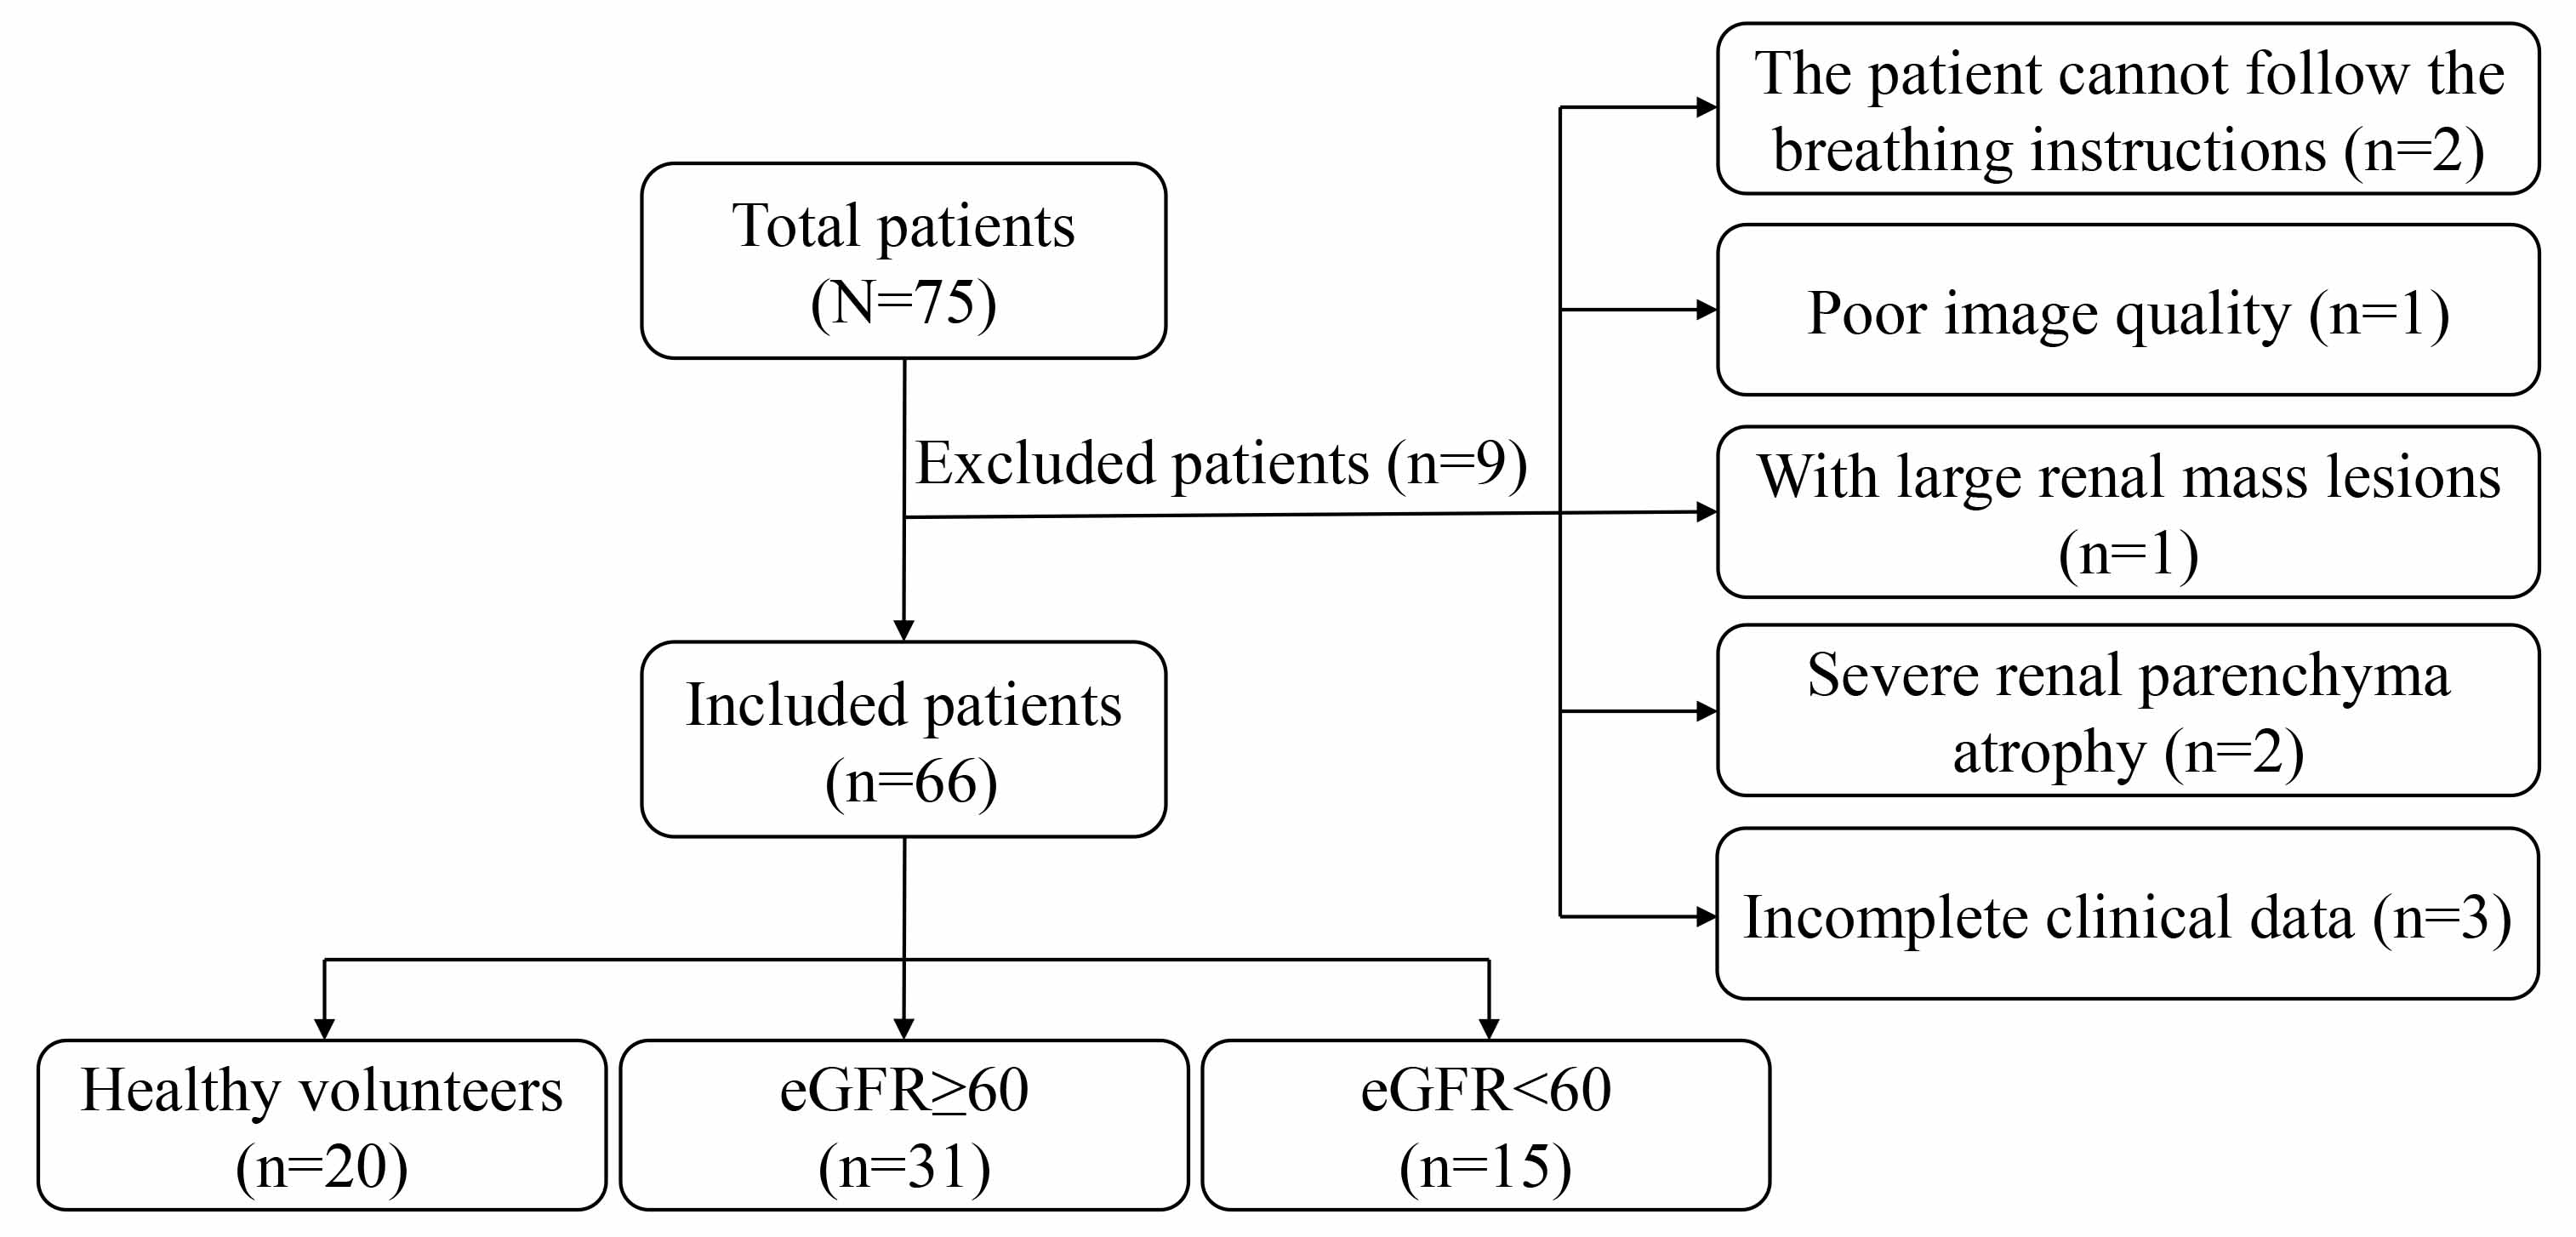
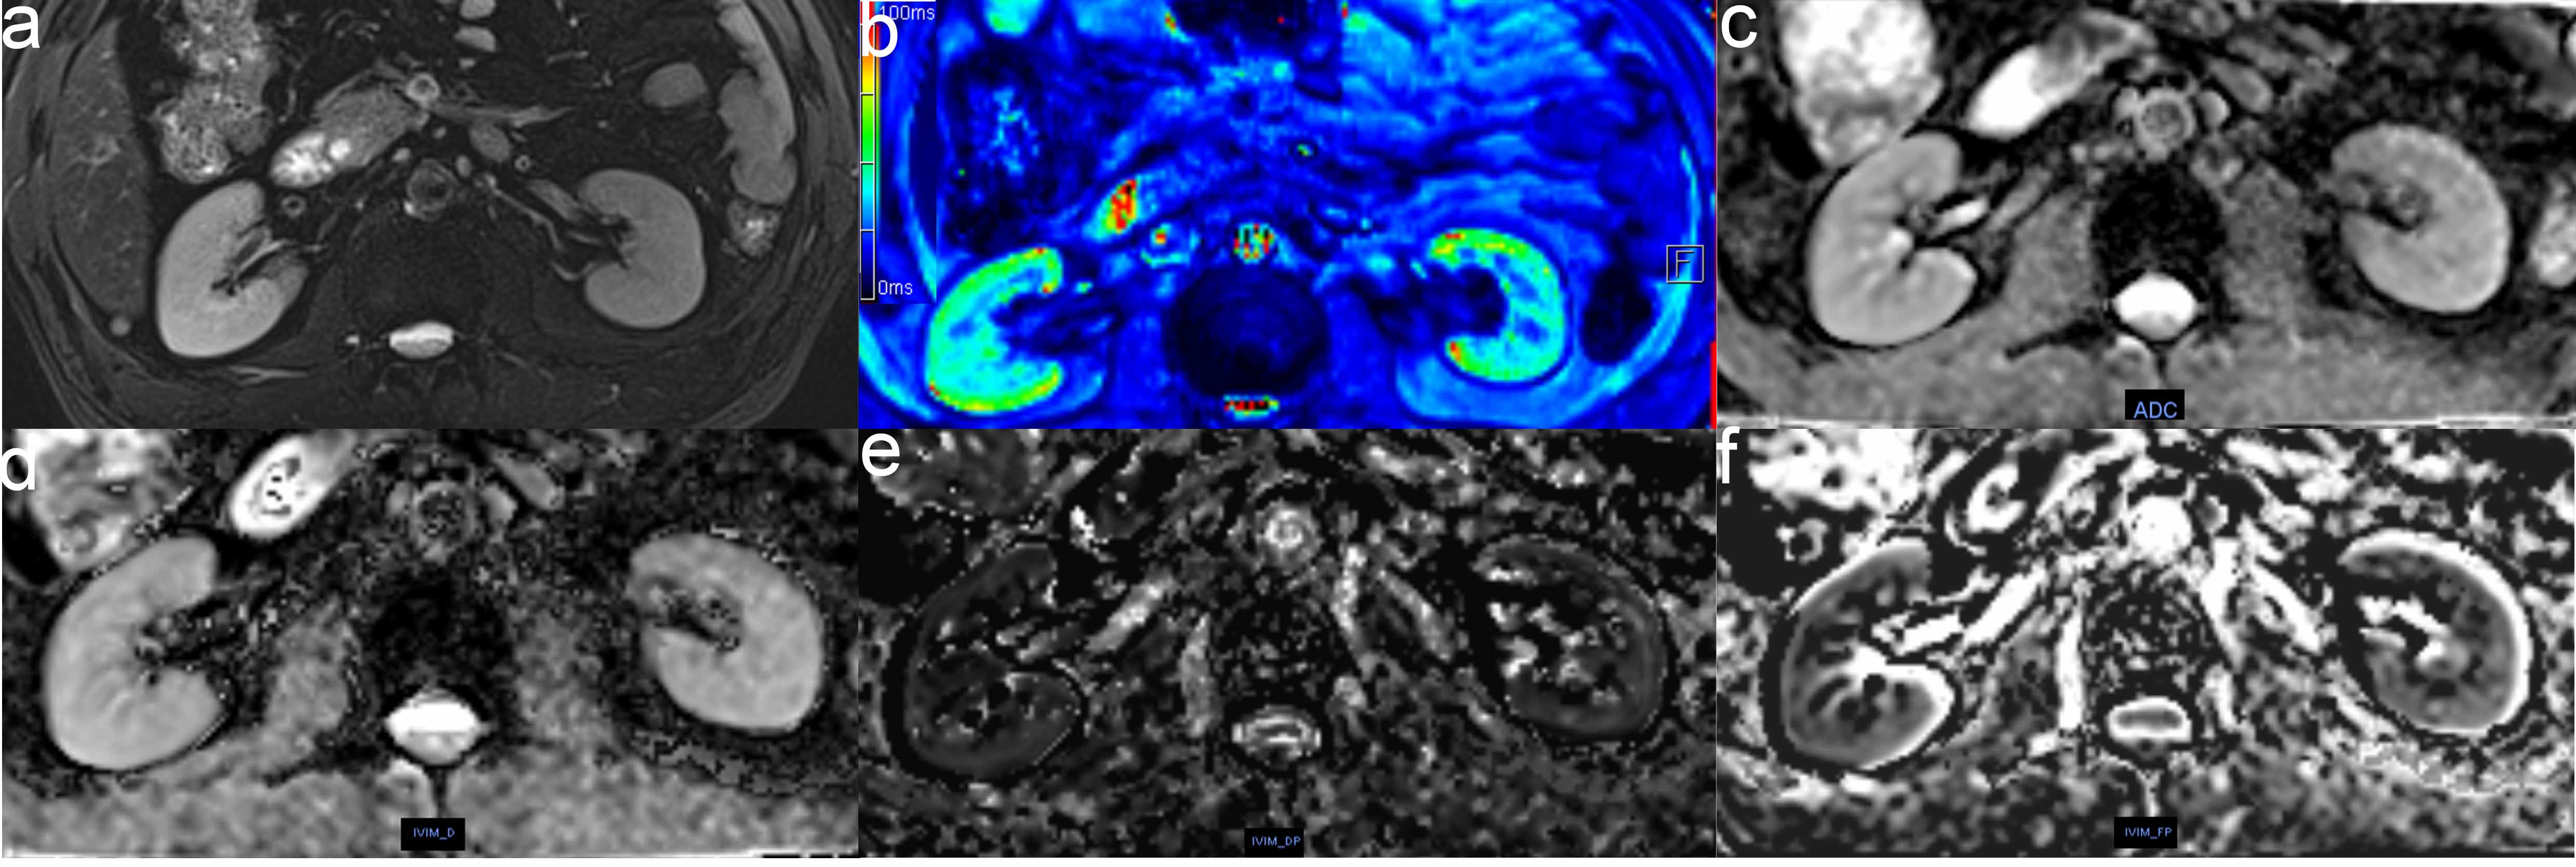
Methods This retrospective study included 46 IgAN patients and 20 healthy volunteers for renal MRI examinations. T2* values on BOLD images and ADC, Dt, Dp, fp values on IVIM-DWI images were measured.
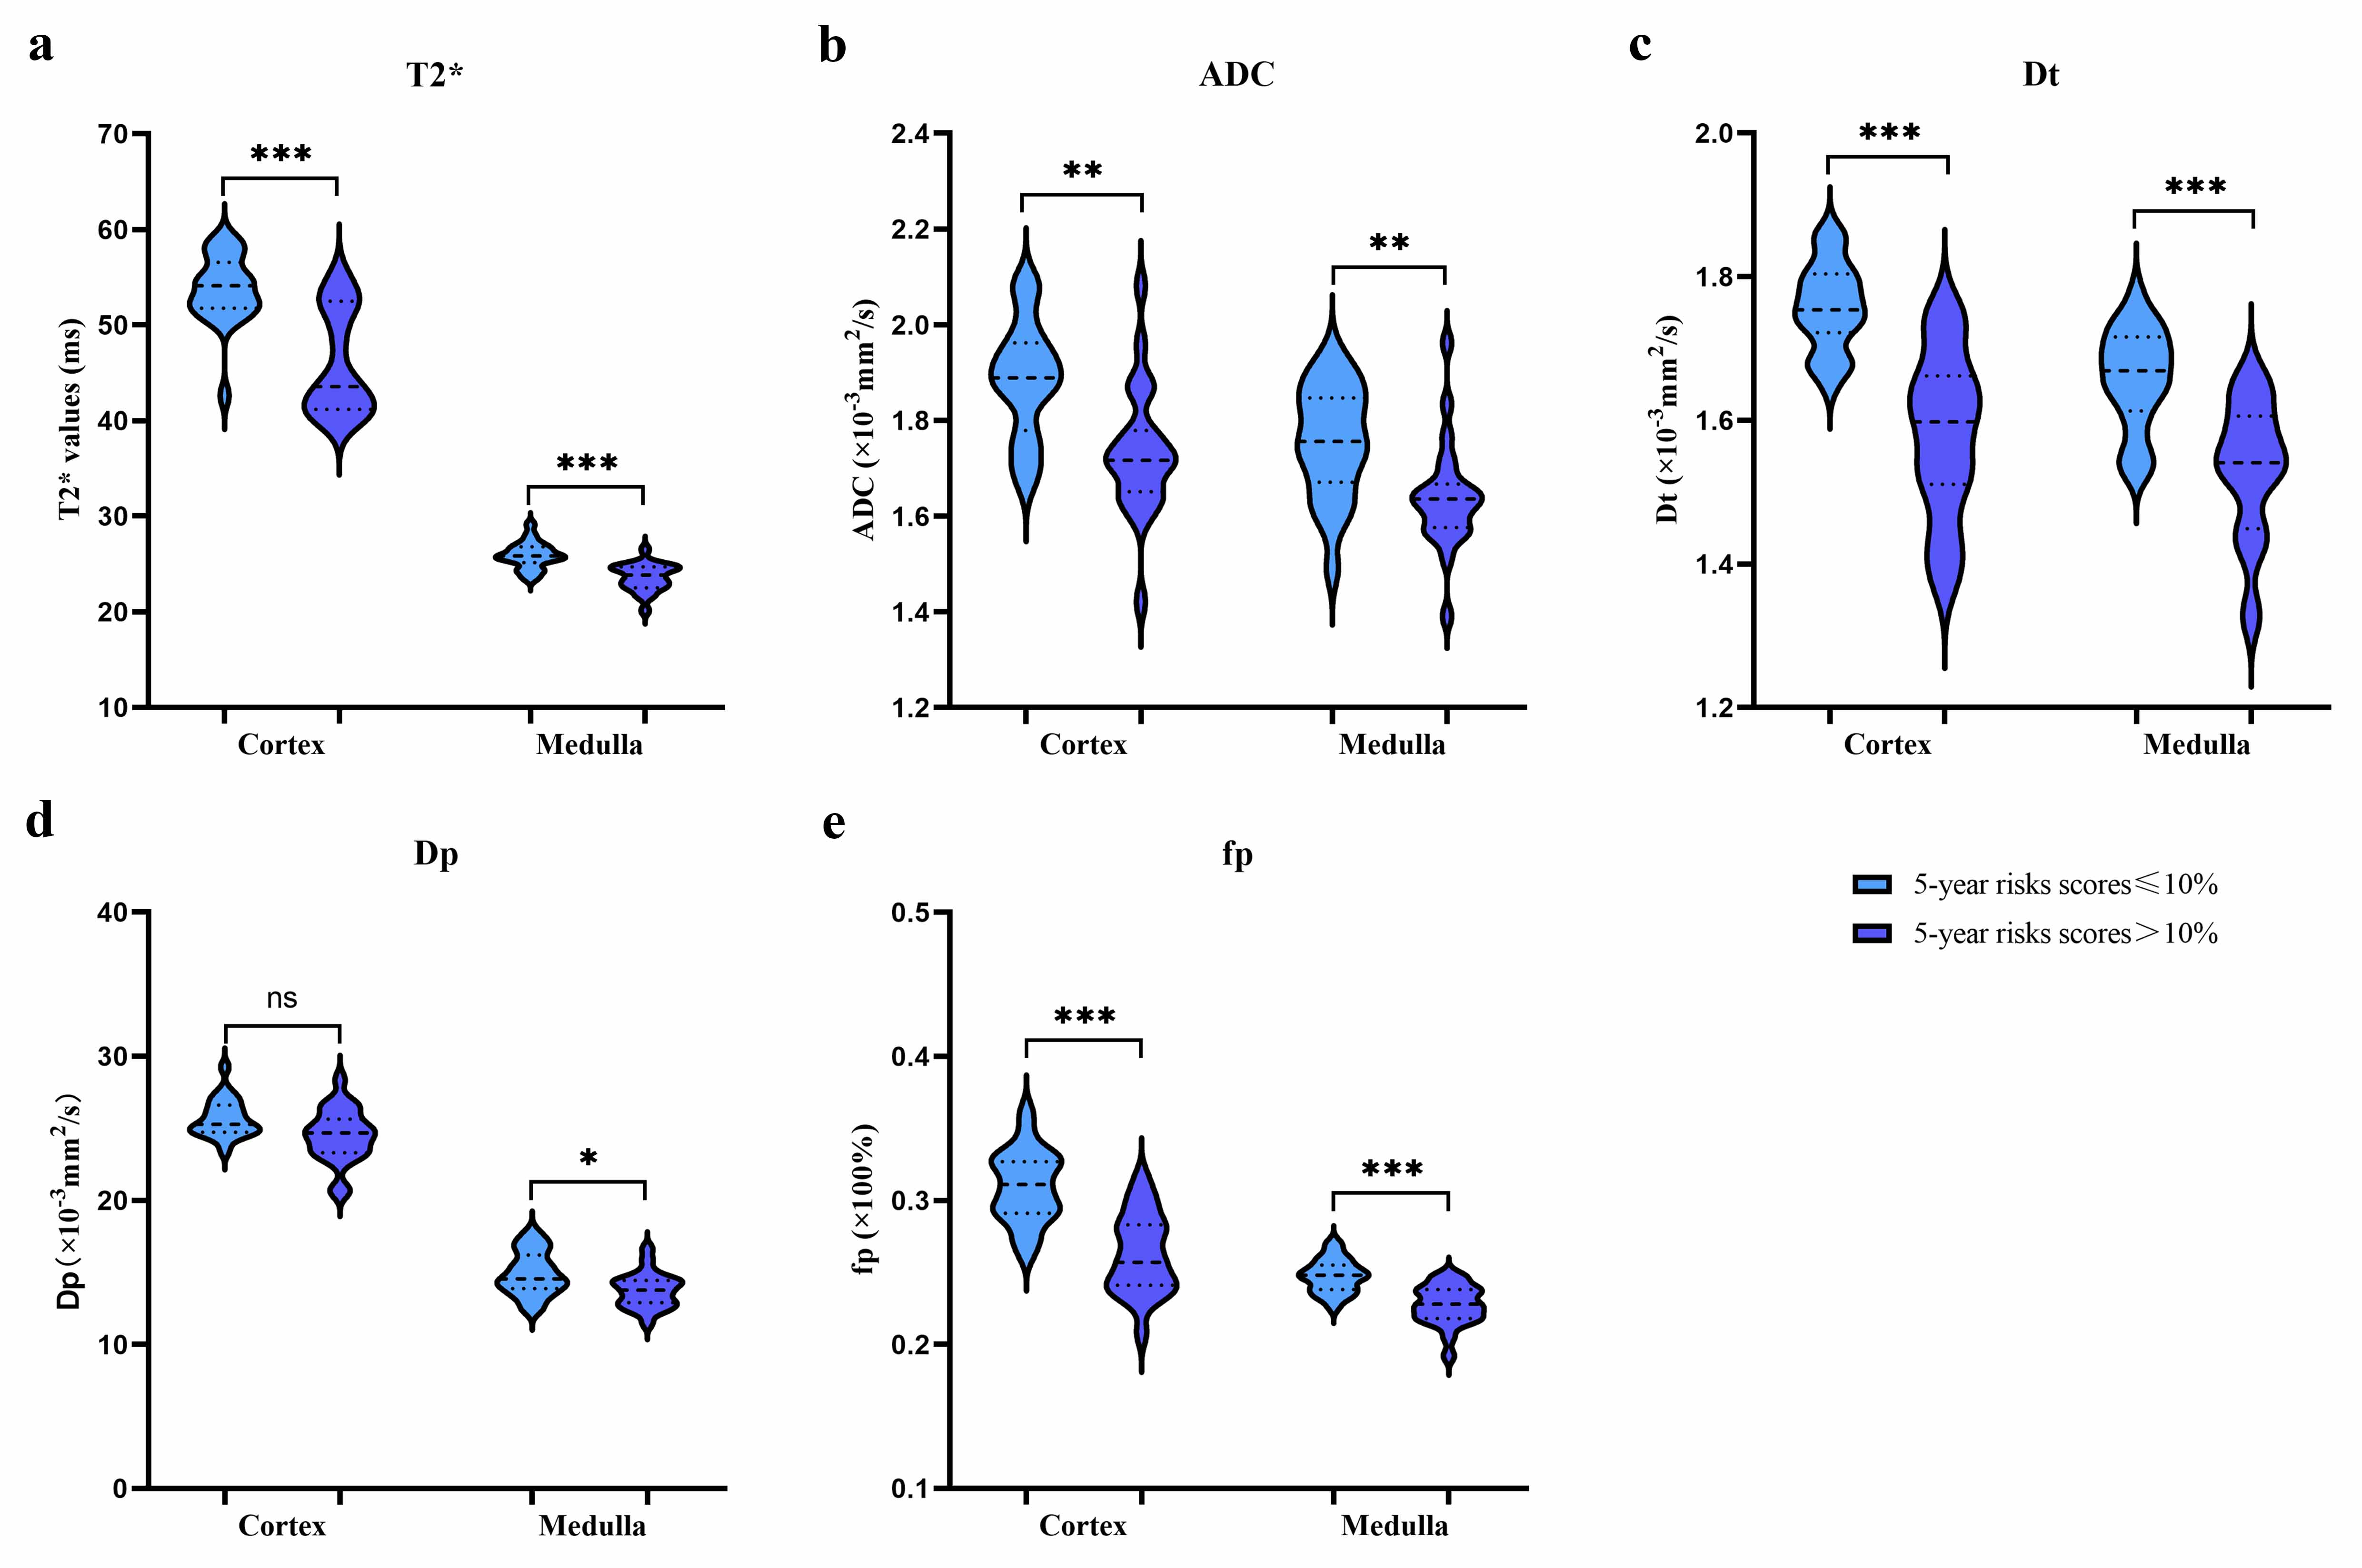
Results: Cortical Dt generated the largest area under the curve for differentiating 5-year risk scores ≤ 10% from 5-year risk scores > 10%, and for differentiating T0 from T1/T2.
Conclusions IVIM-DWI and BOLD-MRI can assess the renal function, Oxford classification, and prognostic risk stratification of IgAN patients.
Research type
Purpose To explore whether intravoxel incoherent motion diffusion-weighted imaging (IVIM-DWI) and blood oxygenation level-dependent MRI (BOLD-MRI) can noninvasively assess the renal function, the Oxford classification and the prognostic risk stratification of IgAN patients.Methods This retrospective study included 46 IgAN patients with pathologically confirmed and 20 healthy volunteers for renal MRI examinations from December 2020 to April 2022. We measured the renal cortex and medulla T2* values on BOLD images and ADC, Dt, Dp, fp values by using MR Body Diffusion Toolbox v1.4.0 (Siemens Healthcare). One-way ANOVA, Student's t-test or Mann-Whitney U test, Pearson product-moment correlation, Spearman's rank correlation and ROC curves were used in our study.
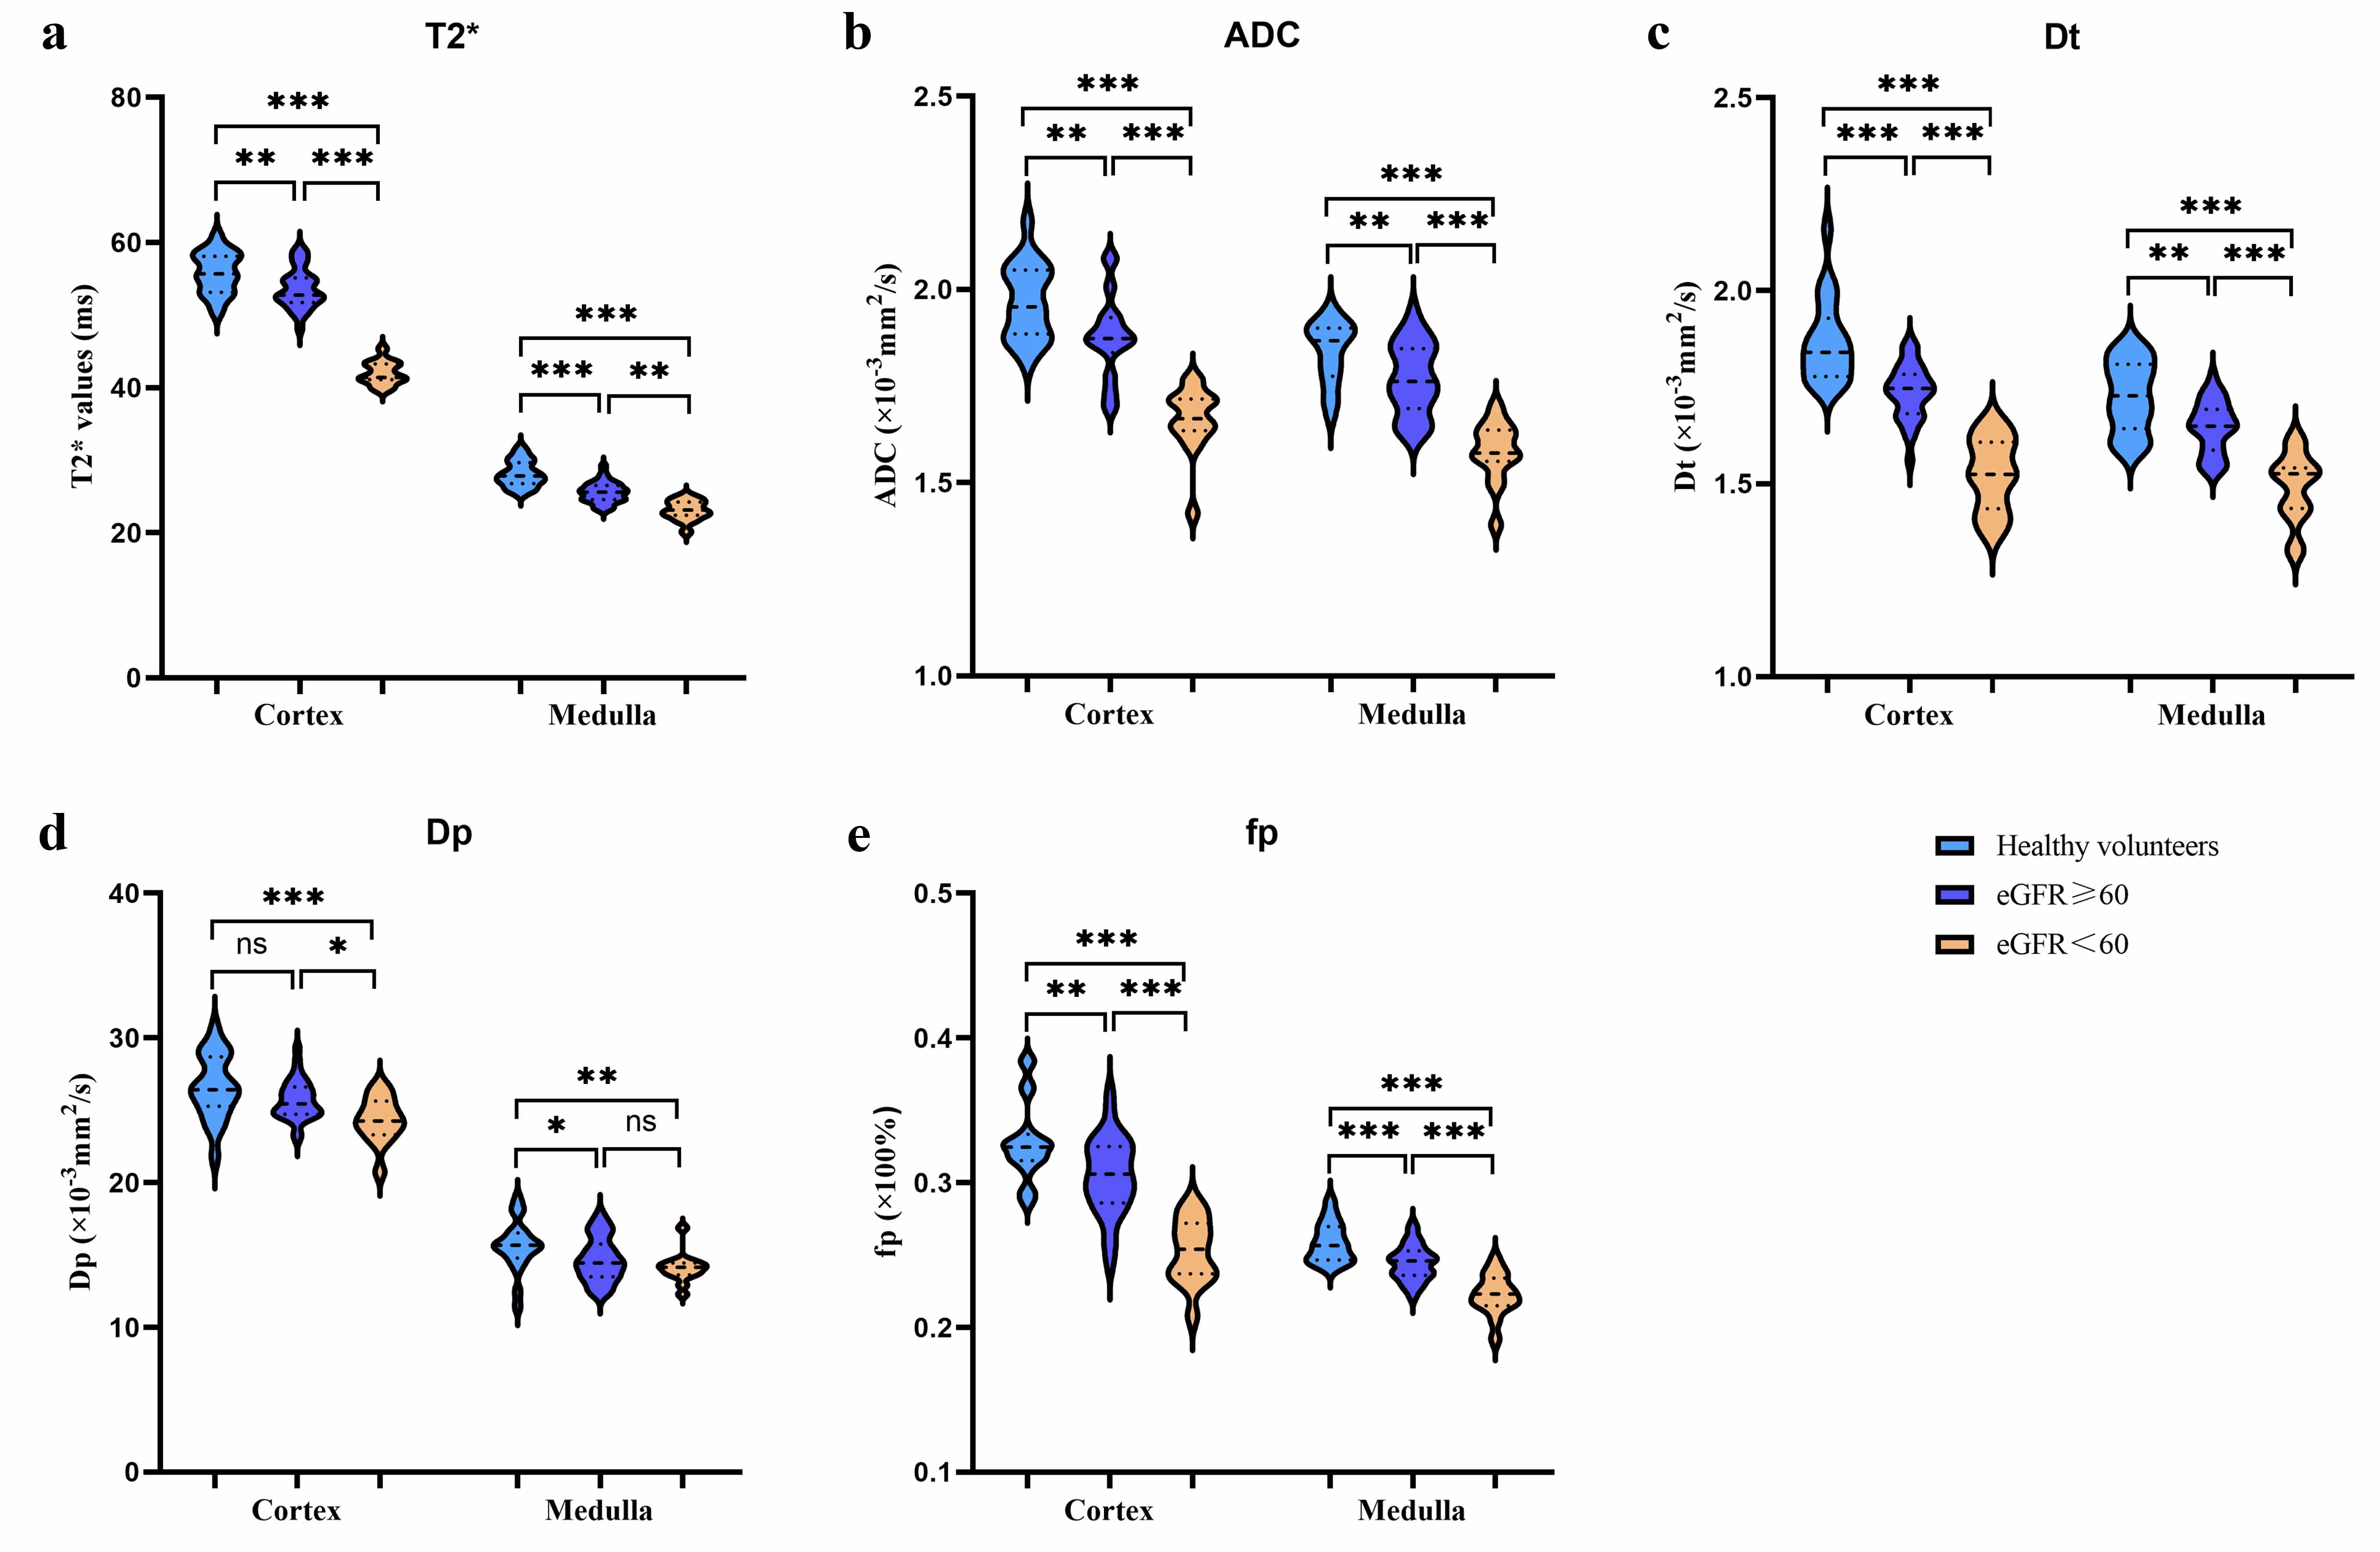
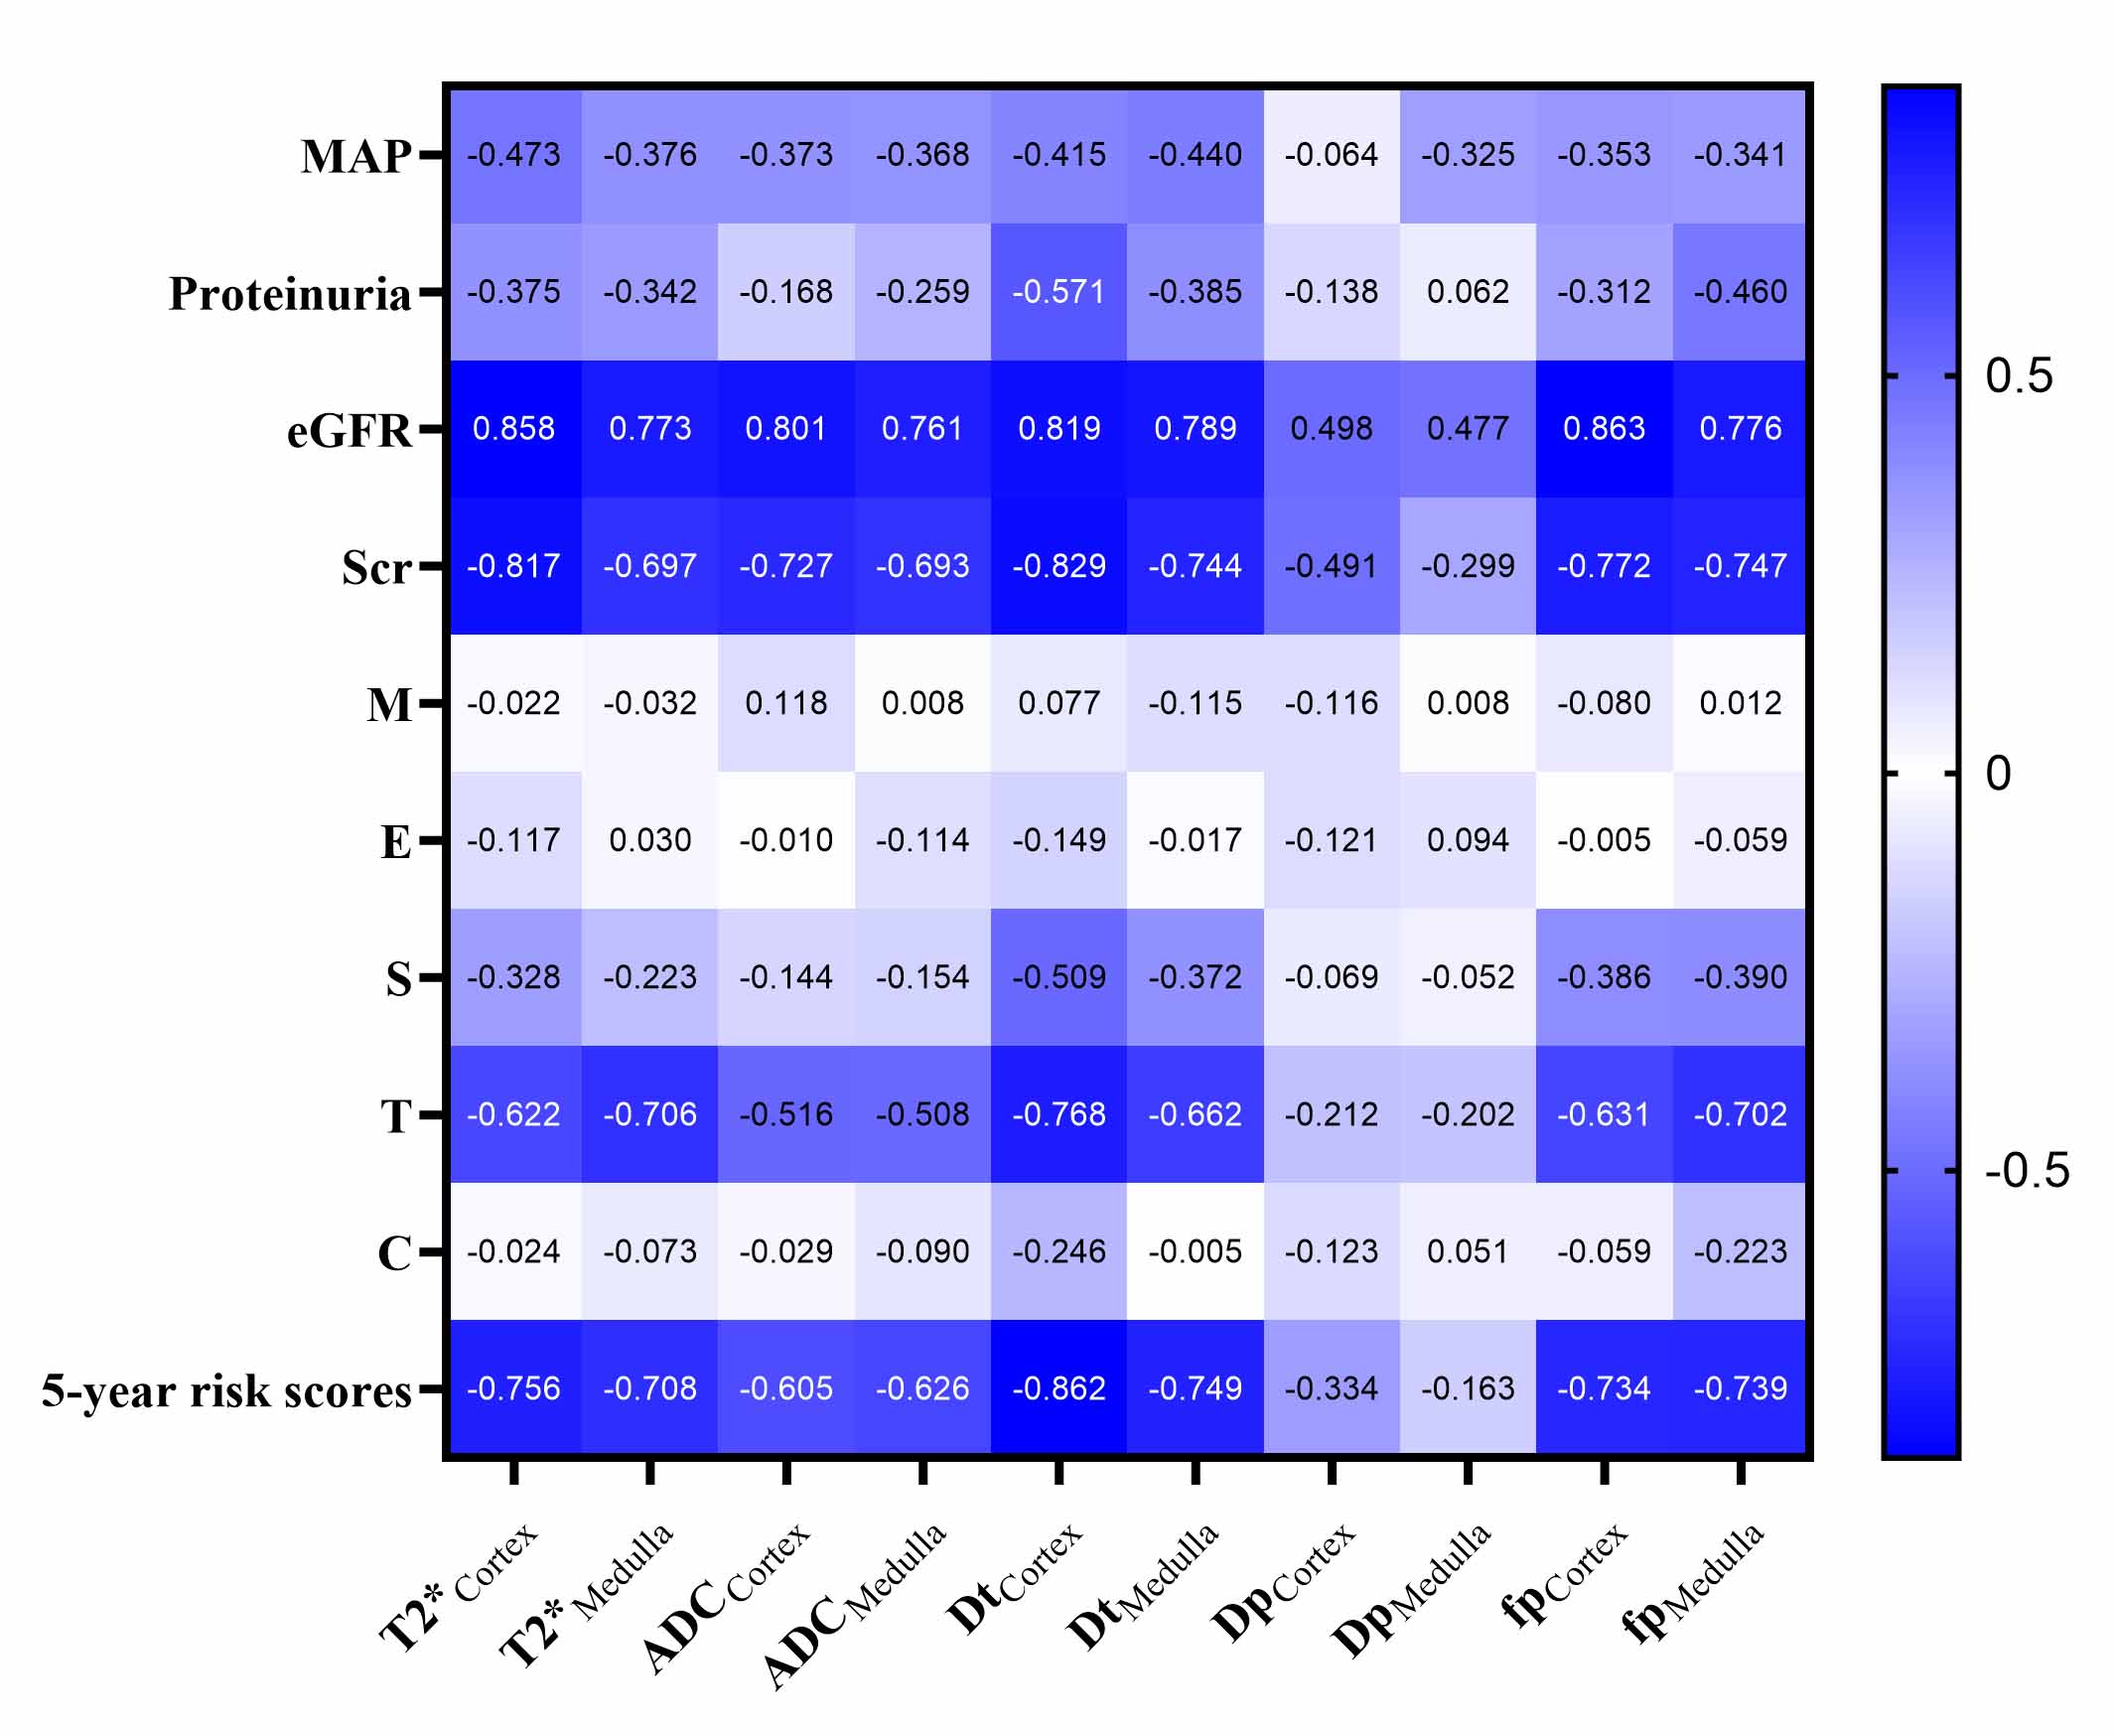
Results Cortical T2*, ADC, Dt, fp and medullary T2*, ADC, Dt, Dp, fp showed significant differences between healthy volunteers and IgAN patients with eGFR ≥ 60ml/min/1.73m2 (all P < 0.05). Except for cortical Dp, all other MRI parameters showed significant differences between 5-year risk score ≤ 10% and 5-year risk score > 10% (all P < 0.05). No MRI parameters showed correlation with M, E or C scores (P > 0.05). Cortical T2*, Dt, fp and medullary Dt, fp showed low to moderate correlations with S score (P < 0.05). Except for cortical and medullary Dp, all other MRI parameters were correlated with T score (P < 0.05). Cortical Dt generated the largest area under the curve (AUC = 0.927) for differentiating 5-year risk score ≤ 10% from 5-year risk score > 10% and for differentiating T0 from T1/T2 (AUC = 0.963).
Conclusions IVIM-DWI and BOLD-MRI can noninvasively assess the renal function, the Oxford classification, especially T score, and the prognostic risk stratification of IgAN patients.
Acknowledgements
NoneReferences
1. Reich, H.N., et al., Remission of proteinuria improves prognosis in IgA nephropathy. J Am Soc Nephrol, 2007. 18(12): p. 3177-83.
2. Lai, K.N., et al., IgA nephropathy. Nat Rev Dis Primers, 2016. 2: p. 16001.
3. Cattran, D.C., et al., The Oxford classification of IgA nephropathy: rationale, clinicopathological correlations, and classification. Kidney Int, 2009. 76(5): p. 534-45.
4. Roberts, I.S., et al., The Oxford classification of IgA nephropathy: pathology definitions, correlations, and reproducibility. Kidney Int, 2009. 76(5): p. 546-56.
5. Trimarchi, H., et al., Oxford Classification of IgA nephropathy 2016: an update from the IgA Nephropathy Classification Working Group. Kidney Int, 2017. 91(5): p. 1014-1021.
6. Barbour, S.J., et al., Evaluating a New International Risk-Prediction Tool in IgA Nephropathy. JAMA Intern Med, 2019. 179(7): p. 942-952.
7. Liu, Y., et al., Diffusional kurtosis imaging in assessing renal function and pathology of IgA nephropathy: a preliminary clinical study. Clin Radiol, 2018. 73(9): p. 818-826.
8. Mao, W., et al., Chronic kidney disease: Pathological and functional evaluation with intravoxel incoherent motion diffusion-weighted imaging. J Magn Reson Imaging, 2018. 47(5): p. 1251-1259.
9. Khatir, D.S., et al., Reproducibility of MRI renal artery blood flow and BOLD measurements in patients with chronic kidney disease and healthy controls. J Magn Reson Imaging, 2014. 40(5): p. 1091-8.
10. Finsterbusch, J., Improving the performance of diffusion-weighted inner field-of-view echo-planar imaging based on 2D-selective radiofrequency excitations by tilting the excitation plane. J Magn Reson Imaging, 2012. 35(4): p. 984-92.
11. Prasad, P.V., et al., Cortical Perfusion and Tubular Function as Evaluated by Magnetic Resonance Imaging Correlates with Annual Loss in Renal Function in Moderate Chronic Kidney Disease. Am J Nephrol, 2019. 49(2): p. 114-124.
12. Fine, L.G., C. Orphanides, and J.T. Norman, Progressive renal disease: the chronic hypoxia hypothesis. Kidney Int Suppl, 1998. 65: p. S74-8.
13. Mariani, G., et al., Renal outcome in IgA nephropathy according to Oxford classification and ultrastructural analysis in a Brazilian center . Clin Nephrol, 2018. 89(4): p. 270-276.
14. Coppo, R., et al., Validation of the Oxford classification of IgA nephropathy in cohorts with different presentations and treatments. Kidney Int, 2014. 86(4): p. 828-36.
15. Espinosa, M., et al., Association of C4d deposition with clinical outcomes in IgA nephropathy. Clin J Am Soc Nephrol, 2014. 9(5): p. 897-904.
16. Le, W., et al., Validation of the Oxford classification of IgA nephropathy for pediatric patients from China. BMC Nephrol, 2012. 13: p. 158.
17. Kang, S.H., et al., The Oxford classification as a predictor of prognosis in patients with IgA nephropathy. Nephrol Dial Transplant, 2012. 27(1): p. 252-8.
18. Soares, M.F.S. and I.S.D. Roberts, Histologic Classification of IgA Nephropathy: Past, Present, and Future. Semin Nephrol, 2018. 38(5): p. 477-484.
Figures