3637
Correlation of Monopolar ADC and Bipolar ADC measurements to MRE Estimates in Healthy Human Kidney1Biomedical Engineering, Ohio State University, Columbus, OH, United States, 2Radiology, Ohio State University, Columbus, OH, United States
Synopsis
Keywords: Kidney, Elastography, MRI, MRE, Diffusion Imaging
Kidney disease and injury can be assessed using tissue stiffness measurements determined by Magnetic Resonance Elastography (MRE), a method that uses MRI. Similarly, diffusion measurements such as apparent diffusion coefficient (ADC) can also provide useful information regarding tissue health. Our goal is to assess the health of the cortex, medulla, and whole kidney by comparing ADC measurements from monopolar and bipolar diffusion gradient schemes against MRE derived stiffness values. Preliminary results indicate a strong correlation between MRE derived stiffness values and monopolar derived ADC measurements and a fair correlation between MRE derived stiffness values and bipolar derived ADC measurements.Introduction
Kidney injury and disease can be debilitating health issues that require invasive, potentially painful, and long diagnosis times. Many kidney diseases, such as Lupus Nephritis, may lead to the progression of renal fibrosis1,2. Renal fibrosis may increase the stiffness and alter other tissue properties of the kidney through increasing the interstitial extracellular matrix and decreasing the number of tubules3. These tissue properties, particularly tissue stiffness, can be used to assess the occurrence and development of disease and injury. Current methods to assess and diagnose kidney disease and eventual renal fibrosis are often invasive. An alternative that is neither painful nor invasive is Magnetic Resonance Elastography (MRE). MRE is an MRI based procedure that uses externally applied mechanical waves to create stiffness maps of the assessed tissue. A study by Rouvière et al. has determined stiffness estimates of the kidney using MRE in healthy participants4. Studies by de Silva et al.5 and Goyal et al.6 showed apparent diffusion coefficient (ADC) measurements of the kidney using diffusion scans in participants. Researchers have previously used MRE and diffusion imaging to assess and determine tissue or organ disease and injury from the brain to the liver7. MRE and diffusion imaging can be used as an effective biomarker for diagnosing kidney diseases. To our knowledge, no studies have investigated the correlation of MRE estimates to monopolar and bipolar apparent diffusion coefficients (ADC). The aim of this study is to compute tissue stiffness of the cortex, medulla, and whole kidney and to compare the ADC measurements derived from monopolar and bipolar diffusion scans.Methods
Imaging was performed using a 3T MRI scanner (Prisma, Siemens Healthcare, Erlangen, Germany). Normal subjects were scanned after obtaining written informed consent. Coronal slices were obtained using a spin-echo echo planar (SE-EPI) MRE sequence. 60 Hz vibrations were introduced through two small soft drivers that were placed on the participants lower back, positioned at the locations of the kidneys. MRE imaging parameters include: FOV = 500x500mm, matrix size = 256x256, TR = 933ms, TE = 44.3ms, slice thickness = 6mm, slices = 5, MRE phase offsets = 4. Monopolar and Bipolar ADC estimates were obtained using six direction diffusion imaging. Diffusion imaging parameters include: FOV = 500x500mm, matrix size = 256x256, TR = 1000ms, TE = 56ms, slice thickness = 6mm, slices = 5. Total scan time was ~20 minutes. MRE images were masked to obtain each of the kidneys. Butterworth bandpass filter was performed to remove the longitudinal component of the applied motion. Local frequency estimation (LFE) processing was then performed to create stiffness maps. Three ROI’s of the cortex, medulla, and entire (whole) kidney for both kidneys were drawn to report the mean stiffness and ADC measurements along with the standard deviation.Results
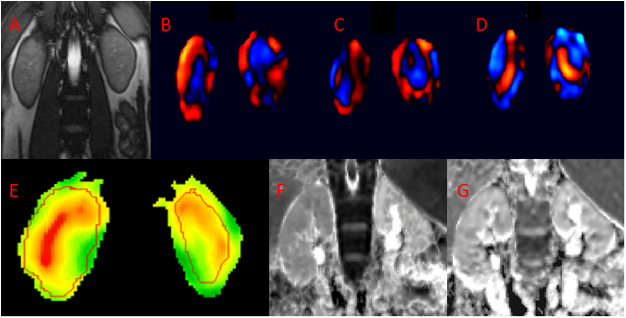
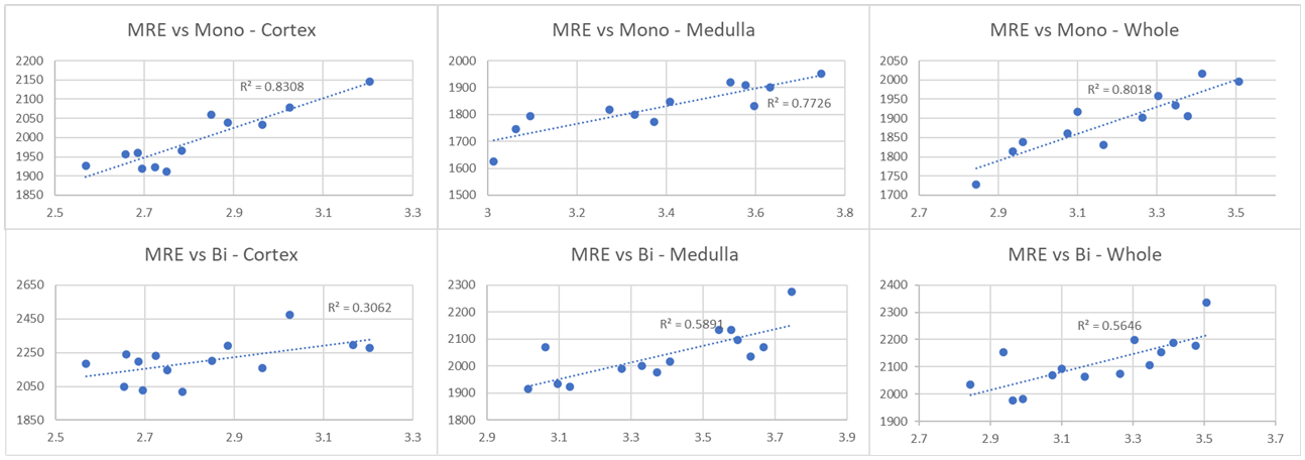
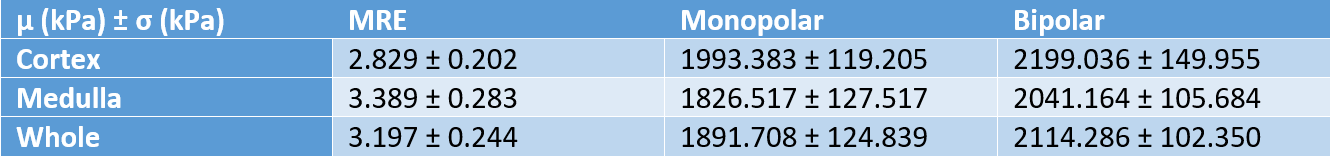
Table 1 shows the mean measurements of MRE-derived stiffness values, ADC values form Monopolar and Bipolar gradients for cortex, medulla, and whole kidney. Figure 1 shows a magnitude image of the kidneys, the snapshot of wave images in all three directions along with the corresponding stiffness map, and ADC maps obtained using monopolar and bipolar diffusion scans. Good discernible waves were observed in both the kidneys for all directions. The MRE stiffness map includes an example of the whole kidney and of the medulla (red contour) and shows clear distinctions between the cortex and medulla regions for stiffness values.Figure 2 shows correlation plots between MRE-derived stiffness values and ADC measurements obtained using monopolar and bipolar gradients. The r2 values for MRE against Monopolar for the cortex, medulla, and whole kidney are 0.8308, 0.7726, and 0.8018, respectively. The r2 values for MRE against Bipolar for the cortex, medulla, and whole kidney are 0.3062, 0.5891, and 0.5646, respectively.
Discussion and Conclusion
This study shows high correlations between MRE-derived stiffness and Monopolar ADC measurements and fair correlations between MRE-derived stiffness and Bipolar ADC measurements. The results suggest that monopolar gradients derived ADC measurements are more robust compared to bipolar gradients. The lower correlation when using bipolar diffusion gradients may be due to the fact that it may be susceptible to any variations in the motion of kidneys as it has higher sensitivity. However, the correlation between stiffness measurements and ADC values suggest that ADC and stiffness values can be used in conjunction for the diagnosis and prognosis of kidney diseases. Future work will involve studying the effectiveness of applying a combination of ADC and stiffness values to assess diseased or injured tissue.Acknowledgements
No acknowledgement found.References
1. Jaryal A, Vikrant S. Current status of lupus nephritis. Indian J Med Res. 2017 Feb;145(2):167-178. doi: 10.4103/ijmr.IJMR_163_16. PMID: 28639592; PMCID: PMC5501048.
2. Kaimori JY, Isaka Y, Hatanaka M, Yamamoto S, Ichimaru N, Fujikawa A, Shibata H, Fujimori A, Miyoshi S, Yokawa T, Kuroda K, Moriyama T, Rakugi H, Takahara S. Visualization of kidney fibrosis in diabetic nephropathy by long diffusion tensor imaging MRI with spin-echo sequence. Sci Rep. 2017 Jul 18;7(1):5731. doi: 10.1038/s41598-017-06111-4. PMID: 28720778; PMCID: PMC5515876.
3. Leung G, Kirpalani A, Szeto SG, Deeb M, Foltz W, Simmons CA, Yuen DA. Could MRI Be Used To Image Kidney Fibrosis? A Review of Recent Advances and Remaining Barriers. Clin J Am Soc Nephrol. 2017 Jun 7;12(6):1019-1028. doi: 10.2215/CJN.07900716. Epub 2017 Mar 15. PMID: 28298435; PMCID: PMC5460707.
4. Rouvière O, Souchon R, Pagnoux G, Ménager JM, Chapelon JY. Magnetic resonance elastography of the kidneys: feasibility and reproducibility in young healthy adults. J Magn Reson Imaging. 2011 Oct;34(4):880-6. doi: 10.1002/jmri.22670. Epub 2011 Jul 18. PMID: 21769970; PMCID: PMC3176985.
5. de Silva, S., Lockhart, K.R., Aslan, P. et al. The diagnostic utility of diffusion weighted MRI imaging and ADC ratio to distinguish benign from malignant renal masses: sorting the kittens from the tigers. BMC Urol 21, 67 (2021). https://doi.org/10.1186/s12894-021-00832-5
6. Goyal A, Sharma R, Bhalla AS, Gamanagatti S, Seth A. Diffusion-weighted MRI in assessment of renal dysfunction. Indian J Radiol Imaging. 2012 Jul;22(3):155-9. doi: 10.4103/0971-3026.107169. PMID: 23599561; PMCID: PMC3624736.
7. Low G, Kruse SA, Lomas DJ. General review of magnetic resonance elastography. World J Radiol. 2016 Jan 28;8(1):59-72. doi: 10.4329/wjr.v8.i1.59. PMID: 26834944; PMCID: PMC4731349.
Figures