3636
Diagnostic Performance and Interobserver Agreement of Clear Cell Likelihood Score Using T2-Weighted Imaging with Fat Suppression Technique1Department of Radiology, the first Medical Centre of Chinese PLA General Hospital, Beijing, China
Synopsis
Keywords: Kidney, Kidney, Clear cell likelihood score; Clear cell renal cell carcinoma
Whether T2-weighted imaging with or without fat suppression technique affects the performance of Clear Cell Likelihood Score v2.0 (ccLS v2.0) for diagnosing ccRCC in SRMs is not known. The final results showed that the tumor signal intensity between T2-weighted imaging with and without fat suppression was statistically significant (P < 0.001), but diagnostic performance and interobserver agreement of ccLS v2.0 in the diagnosis of ccRCC based on the two imaging techniques was comparable (P>0.05). Fat-suppressed T2-weighted imaging is also applicable to ccLS v2.0. This finding is helpful to expand the clinical application scope of ccLS and increase its clinical universality.Abstract
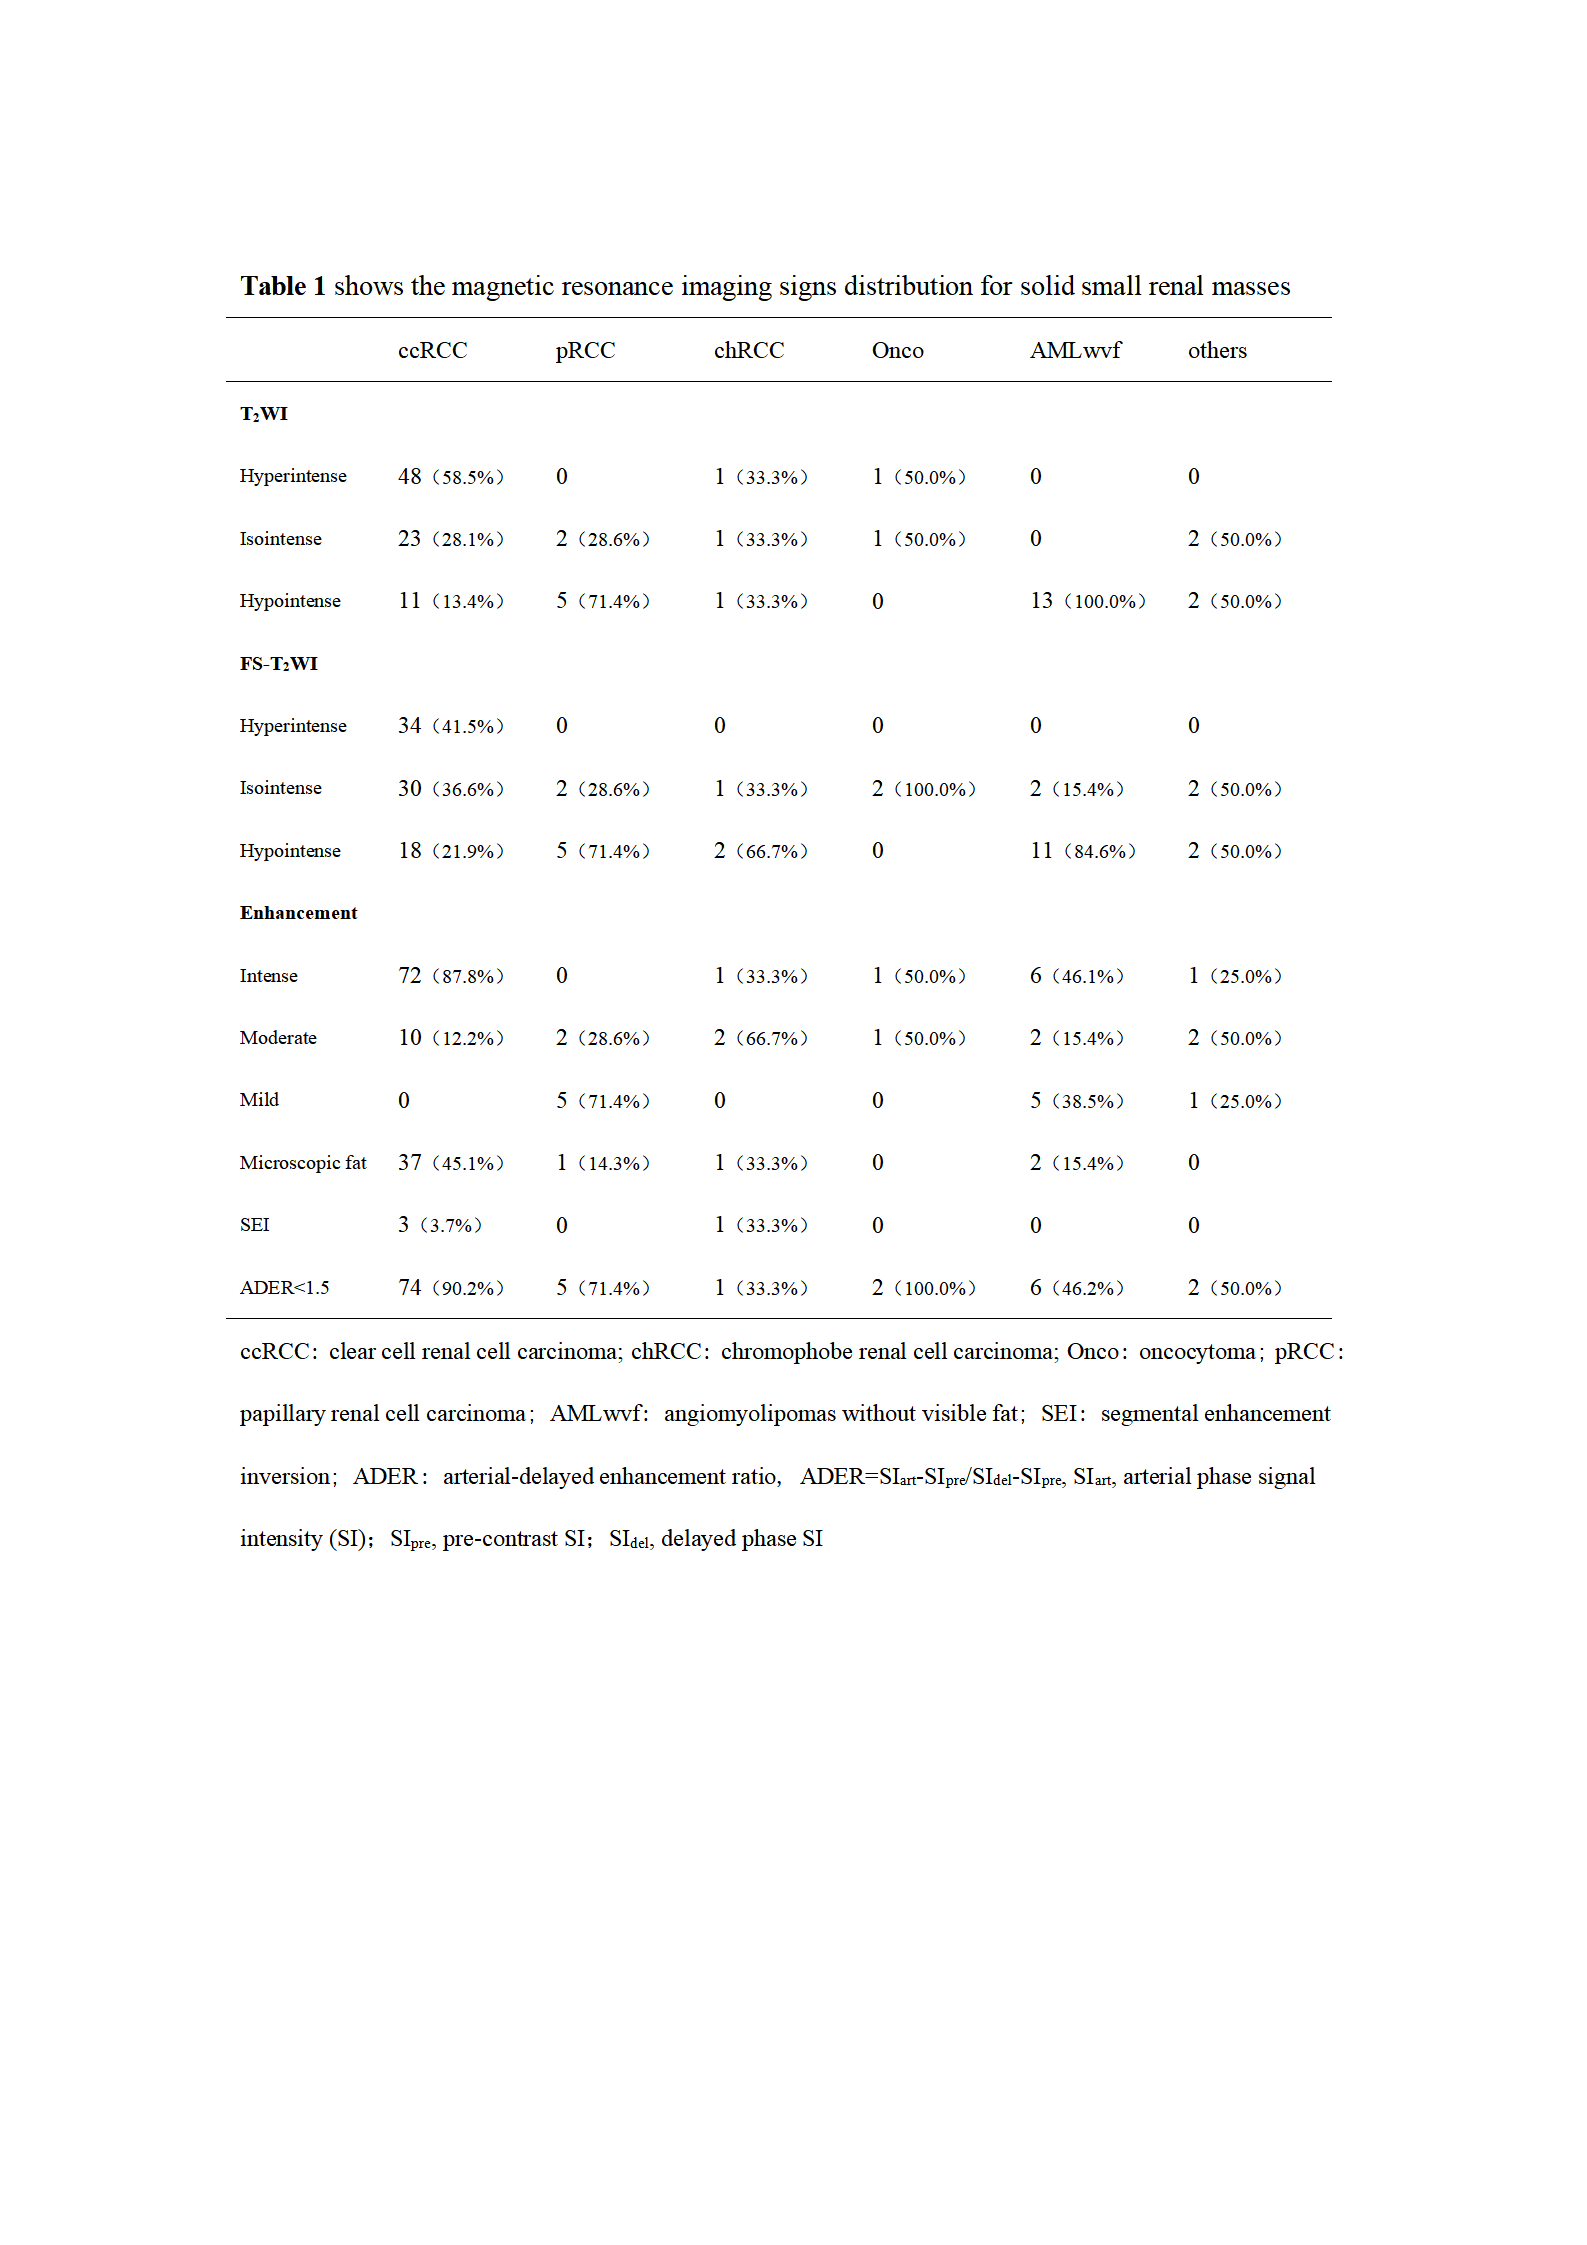
Introduction Clear cell renal cell carcinoma (ccRCC) is the most common malignant subtype in solid small renal masses (SRMs),1-3 Clear Cell Likelihood Score (ccLS) is a 5-point scoring system based on magnetic resonance imaging (MRI), which is extremely useful in the diagnosis and prognosis of ccRCC.4-13 In the ccLS v2.0, T2 signal intensity of renal tumors, the enhancement degree of corticomedullary phase, and the presence of microscopic fat and other imaging signs are taken into account. T2 signal intensity of the tumor is one of the main diagnostic criteria of ccLS, and it is the first step in the diagnostic process of ccLS, which is an important component of the ccLS score.14 Although it is not mandatory, ccLS first recommends T2-weighted imaging without fat suppression technique, followed by T2-weighted imaging with fat suppression technique.9 However, fat suppression T2WI sequence is more widely used in clinical practice. So this study aims to compare whether T2-weighted imaging with or without fat suppression technique affects the diagnostic performance and interobserver agreement of ccLS v2.0 for diagnosing ccRCC in solid SRMs.Methods In this retrospective study, the clinical data and MR images of 111 patients (77 males and 34 females, mean age 55±12 years) with pathologically confirmed solid SRMs from January 2021 to December 2021 at our institution were analyzed. Two radiologists independently assessed the tumor signal intensity (hypointense, isointense, hyperintense) on T2-weighted imaging with and without fat suppression, other MRI features and the ccLS scores according to ccLS v2.0, respectively. Disagreements were resolved by consensus. Receiver operating characteristic curves (ROC) were generated to evaluate the diagnostic performance of ccLS v2.0 depending on T2-weighted imaging with and without fat-suppressed technique. Cohen's Kappa was used to evaluate the interobserver agreement between two radiologists' scores.
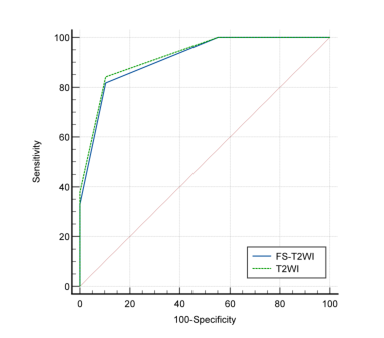
Results The tumor signal intensity between T2-weighted imaging with and without fat suppression technique was statistically significant (P < 0.001). On T2-weighted imaging without fat suppression technique, the accuracy, sensitivity, specificity, positive predictive value (PPV), negative predictive value (NPV), area under the curve (AUC) of ccLS v2.0 were 85.6%,84.1%,89.7%,95.8%,66.7%, 0.92 [95% confidence interval (95%CI):0.86, 0.97], respectively. On frequency-selective saturation T2-weighted imaging, the accuracy, sensitivity, specificity, PPV, NPV and AUC of ccLS v2.0 were 83.8%,81.7%,89.7%,95.7%,63.4%,0.91 (95%CI:0.85, 0.96), respectively, and the differences were not statistically significant (P > 0.05). The interobserver agreements for ccLS v2.0 on T2-weighted imaging with and without fat suppression were 0.55 (95%CI:0.42 ~ 0.67) and 0.57 (95%CI:0.45~0.69), and the differences were not statistically significant (P > 0.05).
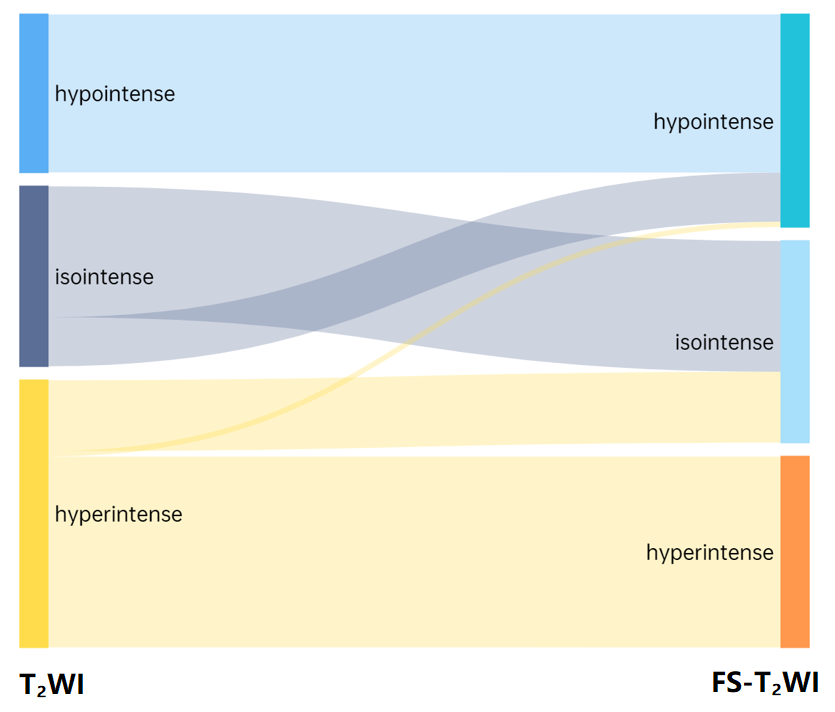
Discussion The results showed that 20.7% (23/111) of SRM patients showed decreased signal intensity on T2-weighted imaging with fat suppression compared with T2-weighted imaging without fat suppression (P<0.001). The reason may be that the frequency selective saturation method causes fat molecules to be continuously excited by applying pre-pulse, fat molecules no longer accept energy, so they do not produce signals, and microscopic fat as intracellular triglycerides, there is also a certain degree of signal reduction.15-19 Among the 23 SRMs with different signal intensities in this study, renal tumors containing microscopic fat accounted for about 43.5% (10/23).
In this study, the differences of diagnostic performance in the ccLS v2.0 on T2-weighted imaging with and without fat suppression technique were not statistically significant (P>0.05). The main reasons for the analysis are as follows: firstly, in both MR imaging techniques, 79.3%(88/111) SRMs have the same signal intensity, the final ccLS score is the same, and the diagnosis result is the same. Secondly, for cases with inconsistent T2 signal intensity (13/23) were iso-and hyper-signal differences. According to ccLS v2.0, lesions with iso- and hyper-signal intensity on T2WI and intense enhancement in the corticomedullary phase followed the same diagnostic process, so they were likely to be diagnosed as ccRCC, so the final results were not affected. Thirdly, among the 4 cases whose T2WI signal intensity is inconsistent, which results in the change of ccLS score, because the ccLS score of 4 or 5 can be diagnosed as a ccRCC, 50%(2/4) have not had their final diagnosis altered. Reducing the influence of T2 signal intensity variations in renal tumors on the scoring system's diagnostic performance demonstrates that the scoring system is stable. However, the results of this study showed that 2 cases of ccRCC were misdiagnosed as benign tumors due to the use of fat suppression technique. We still need to investigate whether the fat suppression technique will have an effect on the diagnostic performance of ccLS v2.0 when including larger data, however, ccLS v2.0 based on T2-weighted imaging with fat suppression can also provide some reference for the daily diagnosis of young radiologists.20-22
Conclusion Fat-suppressed T2-weighted imaging is also applicable to ccLS v2.0, and has the similar performance as the T2-weighted imaging without fat-suppression.
Acknowledgements
NoneReferences
[1] Bhindi B, Thompson R H, Lohse C M, et al. The Probability of Aggressive Versus Indolent Histology Based on Renal Tumor Size: Implications for Surveillance and Treatment[J]. European urology, 2018, 74(4):489–497.
[2] Moch H, Cubilla A L, Humphrey P A, et al. The 2016 WHO Classification of Tumours of the Urinary System and Male Genital Organs-Part A: Renal, Penile, and Testicular Tumours[J]. European urology, 2016, 70(1):93–105.
[3] Finelli A, Cheung D C, Al-Matar A, et al. Small Renal Mass Surveillance: Histology-specific Growth Rates in a Biopsy-characterized Cohort[J]. European urology, 2020, 78(3):460–467.
[4] Kay FU, Pedrosa I. Imaging of Solid Renal Masses. Radiol Clin North Am. 2017 Mar;55(2):243-258.
[5] Canvasser N E, Kay F U, Xi Y, et al. Diagnostic Accuracy of Multiparametric Magnetic Resonance Imaging to Identify Clear Cell Renal Cell Carcinoma in cT1a Renal Masses[J]. The Journal of urology, 2017, 198(4):780–786.
[6] Kay F U, Canvasser N E, Xi Y, et al. Diagnostic Performance and Interreader Agreement of a Standardized MR Imaging Approach in the Prediction of Small Renal Mass Histology[J]. Radiology, 2018, 287(2):543–553.
[7] Johnson B A, Kim S, Steinberg R L, et al. Diagnostic performance of prospectively assigned clear cell Likelihood scores (ccLS) in small renal masses at multiparametric magnetic resonance imaging[J]. Urologic oncology, 2019, 37(12):941–946.
[8] Steinberg R L, Rasmussen R G, Johnson B A, et al. Prospective performance of clear cell likelihood scores (ccLS) in renal masses evaluated with multiparametric magnetic resonance imaging[J]. European radiology, 2021, 31(1):314–324.
[9] Pedrosa I, Cadeddu J A. How We Do It: Managing the Indeterminate Renal Mass with the MRI Clear Cell Likelihood Score[J]. Radiology, 2022, 302(2):256–269.
[10] Dunn M, Linehan V, Clarke S E, et al. Diagnostic Performance and Interreader Agreement of the MRI Clear Cell Likelihood Score for Characterization of cT1a and cT1b Solid Renal Masses: An External Validation Study[J]. AJR. American journal of roentgenology, 2022 Aug(17):1–11.
[11] Rasmussen R G, Xi Y, Sibley R C, et al. Association of Clear Cell Likelihood Score on MRI and Growth Kinetics of Small Solid Renal Masses on Active Surveillance[J]. AJR. American journal of roentgenology, 2022, 218(1):101–110.
[12] Schieda N, Davenport M S, Silverman S G, et al. Multicenter Evaluation of Multiparametric MRI Clear Cell Likelihood Scores in Solid Indeterminate Small Renal Masses[J]. Radiology, 2022, 303(3):590–599.
[13] Al Nasibi K, Pickovsky J S, Eldehimi F, et al. Development of a Multiparametric Renal CT Algorithm for Diagnosis of Clear Cell Renal Cell Carcinoma Among Small (≤ 4 cm) Solid Renal Masses[J]. AJR. American journal of roentgenology, 2022 Aug 31:1–10.
[14] Roussel E, Capitanio U, Kutikov A, et al. Novel Imaging Methods for Renal Mass Characterization: A Collaborative Review[J]. European urology, 2022, 81(5):476–488.
[15] R C Semelka, W Chew, H Hricak, et al. Fat-saturation MR imaging of the upper abdomen.[J]. AJR Am J Roentgenol, 1990, 155(5):1111–1116.
[16] Chung M S, Choi H J, Kim M-H, et al. Comparison of T2-weighted MRI with and without fat suppression for differentiating renal angiomyolipomas without visible fat from other renal tumors[J]. AJR. American journal of roentgenology, 2014, 202(4):765–771.
[17] Schwartz LH, Seltzer SE, Tempany CM, et al. Prospective comparison of T2-weighted fast spin-echo, with and without fat suppression and conventional spin-echo pulse sequenc(clean)[J]. Radiology, 1993, 189(2):411–416.
[18] Tanaka T, Morimoto Y, Masumi S, et al. Utility of frequency-selective fat saturation T2-weighted MR images for the detection of joint effusion in the temporomandibular joint[J]. Dento maxillo facial radiology, 2002, 31(5):305–312.
[19] Morimoto Y, Tanaka T, Masumi S, et al. Significance of frequency-selective fat saturation T2-weighted MR images for the detection of bone marrow edema in the mandibular condyle[J]. Cranio: the journal of craniomandibular practice, 2004, 22(2):115–123.
[20] Tse J R. Editorial Comment: Clear Cell Likelihood Score-Another Step Toward Noninvasive Risk Stratifit: Toward a CT Equivalent of the MRI Clear Cell Likelihood Score[J]. AJR. American journal of roentgenology, 2022:11.
[21] Shetty A S. Editorial Comment: Toward a CT Equivalent of the MRI Clear Cell Likelihood Score[J]. AJR. American journal of roentgenology, 2022:11.
[22] Mileto A, Potretzke T A. Standardized Evaluation of Small Renal Masses Using the MRI Clear Cell Likelihood Score[J]. Radiology, 2022, 303(3):600–602.
Figures