3629
Perfusion MRI using dynamic contrast-enhanced MRI and arterial spin labeling for the characterization of small renal masses: preliminary study.1BioMedical Engineering and Imaging Institute, Icahn School of Medicine at Mount Sinai, New York, NY, United States, 2Department of Diagnostic, Molecular and Interventional Radiology, Icahn School of Medicine at Mount Sinai, New York, NY, United States, 3Department of Urology, Icahn School of Medicine at Mount Sinai, New York, NY, United States, 4Precision Immunology Institute/Tisch Cancer Institute, Icahn School of Medicine at Mount Sinai, New York, NY, United States, 5Siemens Healthcare, Erlangen, Germany, 6University of Sheffield, Sheffield, United Kingdom
Synopsis
Keywords: Cancer, DSC & DCE Perfusion
Functional imaging using dynamic contrast-enhanced magnetic resonance imaging (DCE-MRI) and arterial spin-labeling (ASL), which is a non-contrast technique, have been proposed to quantitatively assess perfusion and vascular flow in small renal masses (SRM) and may provide complementary information. In our initial series, we found significant differences in certain DCE-MRI quantitative and semi-quantitative parameters for renal cell carcinoma (RCC) versus benign tumors (Vp, wash-in, wash-out TTP and AUC) and between ccRCC versus non-clear cell (non-cc)RCC (Ve), while no differences existed between groups for ASL. Certain pharmacokinetic parameters derived from DCE-MRI appear promising for SRM characterizationIntroduction
Small renal masses (SRM) <4 cm are increasingly detected in clinical practice and commonly do not undergo pathologic confirmation before standard-of-care operative management. The non-invasive diagnosis of SRMs is therefore essential for clinicians and patients, as the different diagnoses, ranging from renal cell carcinoma (RCC) to benign masses have different tumor behavior, prognoses, and treatments [1]. Recently, perfusion imaging using dynamic contrast-enhanced MRI (DCE-MRI) and arterial spin labelling (ASL) have become important tools to derive biological information, which can be described in terms of physiological characteristics in the tissue [2, 3]. In this study, we investigated whether SRM perfusion measured by DCE-MRI and ASL enables distinction of the tumor diagnosis.Methods
In a prospective, IRB approved, single-center study, 38 patients (28 M/10F; age 59.62±11.6y) with SRMs had MRI at 1.5T (Siemens Aera, Siemens Healthcare, Erlangen, Germany), prior to partial nephrectomy. The MRI protocol included tissue perfusion measurements by DCE-MRI (n=38) and ASL (n=21) (Fig.1). The DCE-MRI acquisition consisted of a free-breathing, fat-suppressed 3D VIBE dynamic acquisition in coronal orientation (TR/TE/FA: 4.53ms/1.06ms/12º, FOV 440x358mm2, 36 slices, CAIPI 2 acceleration) with a temporal resolution of 5s. Gadobutrol (Gadavist, Bayer, 0.1 mmol/kg dose) and a 40ml saline flush were intravenously injected at 2ml/s at 25 s after the start of the DCE-MRI acquisition. Volumetric ASL was acquired in coronal orientation (TR/TE/FA: 5000 ms/25.84ms/180º, FOV 280x140mm2, 30 slices), with pseudo-continuous labeling (pCASL: 30 label and control pairs, FA=28 º, start TI=3000 ms, labeling duration=1500ms, T1 blood =1250ms), fat saturation and background suppression. The sequence parameters are summarized in Table 1. The patients were instructed to synchronize their breathing with the acquisition (inhale and exhale during labeling and pause breathing on end-expiration during data acquisition) [4]. PMI 0.4 (Platform for Medical Imaging, University of Sheffield) software was used to analyze DCE data for the tumor, using an extended Tofts model [5]. DCE-MRI modeled quantitative parameters [volume transfer constant (Ktrans), Kep (rate constant), extravascular-extracellular volume (Ve), plasma flow (FP), and plasma volume (Vp)] were obtained (Figure 2).In-house code in MATLAB 2021 (The Mathworks, Natick, MA) was used to analyze model-free DCE-MRI parameters [wash-in, wash-out, peak enhance rate (PER), area under the curve (AUC), area under the curve in 60sec (AUC60sec), bolus arrival time (BA) and time to peak (TTP)].Perfusion-weighted and renal blood flow (RBF) maps derived from ASL were reconstructed inline on the scanner (Siemens). RBF and DCE-MRI quantitative and semi quantitative parameters were tested for normality and lognormality. RBF and DCE-MRI parameters were compared among tumor histological subtypes using ANOVA, Mann-Whitney and ANOVA Kruskal-Wallis tests. DCE-MRI parameters were correlated with RBF by the Spearman correlation. Statistical analyses were performed using GraphPad Prism 9.Results
Thirty-six SRMs were resected with the following pathologic diagnoses: 19 clear cell (ccRCC), 4 papillary (p)RCC, 2 clear cell/papillary (ccp)RCC, 2 chromophobe (ch)RCC, 5 oncocytoma, and 2 angiomyolipomas (AML). Two additional AMLs were diagnosed based on prior biopsy (n=1) and diagnostic appearance on qualitative MRI (n=1). Quantitative parameters did not demonstrate any statistically significant difference between tumor diagnoses, except for Vp (p=0.039), which was higher in RCC compared to benign SRM (Figure 2a). Semi-quantitative parameters wash-in slope (p=0.0060), wash-out slope (p=0.002), and AUC (p=0.0365) were higher in benign SRM compared to RCC (Figure 2b,c,d). TTP (p=0.004) was higher in RCC compared to benign SRM (Figure 2e). Ve was higher in ccRCC compared to non-ccRCC (p=0.0350) (Figure 2f). ASL-derived perfusion parameters were not significantly different for RCC versus benign SRM and ccRCC versus non-ccRCC (all p-values >0.05). RBF from ASL did not correlate with any of the modeled DCE-MRI parameters (Spearman r=0.15-0.312, p=0.156-0.48).Discussion
The measurement of perfusion characteristics using functional MRI techniques in SRM is attractive given the non-invasive nature, lack of ionizing radiation, and the ability to capture established differences in tumor biology (i.e., neovascularity) between the different pathologic diagnoses. Overall, our quantitative parameter measurements for DCE-MRI, includingKtrans, Kep, and Ve, agree with previously reported values in a study conducted on a 3T system by Zhang et al [2]. A separate study, using a 3T system and different gadolinium-based contrast agent (gadodiamide), reported Ktrans values for chRCC that were lower than our values [6]. DCE-MRI parameters demonstrated promise to differentiate between RCC and benign SRM and for ccRCC from the other RCC. We can hypothesize certain biological connections to our results; for example, the higher Ve values found for ccRCC vs non-ccRCC indicates a larger extracellular-extravascular space, which can be seen in the setting of leaky tumor neovascularity commonly seen in ccRCC. ASL is a highly attractive technique given the non-contrast nature, yet measures perfusion differently than DCE-MRI; our initial results demonstrate no correlation between DCE-MRI (Ktrans) and ASL parameter measurements (RBF) in our small sample size.Conclusion
Quantitative/semi-quantitative DCE-MRI parameters are promising for SRM characterization. Further investigation in a larger sample size is needed for verification and to determine if any DCE-MRI and ASL parameters may serve as surrogate markers of vascularity, as well as correlation of parameter measurements with pathologic findings, such as microvascular density. It is likely that these perfusion MRI quantification methods will provide complementary information.Acknowledgements
This work was supported by a research grant from Bayer Healthcare.References
1. Heller, M.T., A. Furlan, and A. Kawashima, Multiparametric MR for Solid Renal Mass Characterization. Magn Reson Imaging Clin N Am, 2020. 28(3): p. 457-469.
2. Zhang, Y., et al., Tumor Vascularity in Renal Masses: Correlation of Arterial Spin-Labeled and Dynamic Contrast-Enhanced Magnetic Resonance Imaging Assessments. Clin Genitourin Cancer, 2016. 14(1): p. e25-36.
3. Lanzman, R.S., et al., Arterial spin-labeling MR imaging of renal masses: correlation with histopathologic findings. Radiology, 2012. 265(3): p. 799-808.
4. Robson, P.M., et al., Volumetric Arterial Spin-labeled Perfusion Imaging of the Kidneys with a Three-dimensional Fast Spin Echo Acquisition. Acad Radiol, 2016. 23(2): p. 144-54.
5. Notohamiprodjo, M., et al., Measuring perfusion and permeability in renal cell carcinoma with dynamic contrast-enhanced MRI: a pilot study. J Magn Reson Imaging, 2010. 31(2): p. 490-501.
6. Wang, H.Y., et al., Dynamic Contrast-enhanced MRI in Renal Tumors: Common Subtype Differentiation using Pharmacokinetics. Sci Rep, 2017. 7(1): p. 3117.
Figures

Table 1: Sequence acquisition parameters for the 1.5T MRI protocol are shown below (Aera, Siemens Healthcare).
Abbreviations: TR (time to repetition), TE (time to echo), FA (flip angle), AT [Acquisition time (min:sec)], ST (slice thickness), and FOV (field of view).
*Gadolinium based contrast agent used in all cases was gadobutrol (Gadavist, Bayer Healthcare).
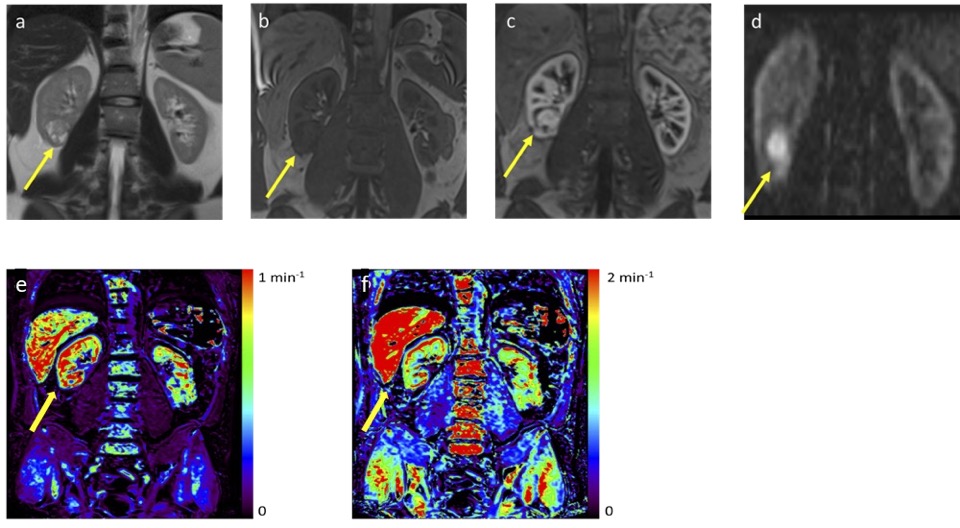
Clear cell renal cell carcinoma in right kidney (lower pole) (yellow arrow) of a 42 year old male patient (tumor size 2.5 cm). (a) Coronal T2-weighted (T2-W) MR image; (b) Coronal pre-contrast T1-weighted (T1-W) image; (c) Coronal DCE image; (d) Coronal RBF from ASL; and (e) Ktrans and (f) Kep derived from DCE-MRI.
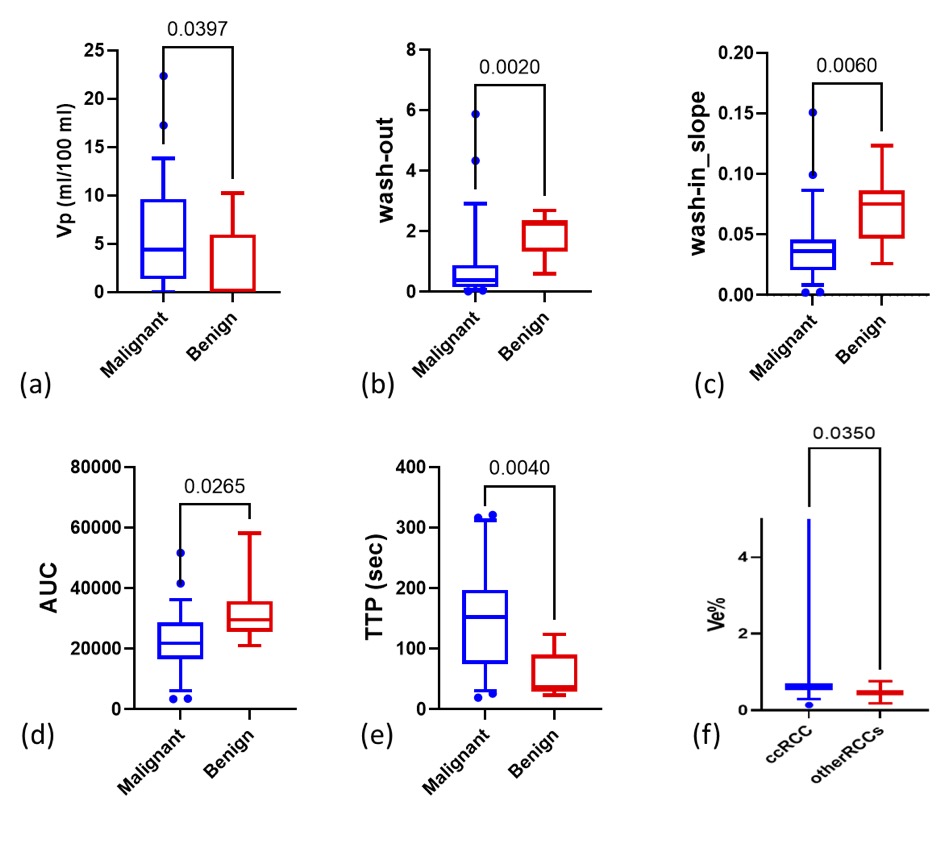
Box-and-whisker plots showing extended Tofts model and model-free DCE-MRI parameters with significant differences between renal lesions. Mean values of the parameters provided by parameters were compared between RCC and benign SRM, and between ccRCCs and other RCC by a Mann-Whitney test.