3627
The Value of T2 mapping Sequence in Evaluating Renal Damage in Patients with Liver Cirrhosis
Ye Ju1, Yue Wang1, Nan Wang1, and Ailian Liu1
1the First Affiliated Hospital of Dalian Medical University, Dalian, China
1the First Affiliated Hospital of Dalian Medical University, Dalian, China
Synopsis
Keywords: Kidney, fMRI
Patients with liver cirrhosis are easily complicated with renal injury, and it is often difficult to find the symptoms of early renal injury in time, which eventually leads to poor prognosis. T2 mapping, as a quantitative MRI technique, can provide quantitative information about the content and composition of water and collagen fibers [1]. The results of this study show that T2 mapping can effectively evaluate the renal damage of liver cirrhosis, so T2 mapping is expected to be an effective way to quantitatively and non-invasively evaluate the renal damage of liver cirrhosis.Introduction
Patients with liver cirrhosis are prone to renal impairment due to circulatory disturbance and other factors, which eventually leads to high morbidity and mortality. The symptoms of early renal function injury are often not obvious, and commonly used clinical renal function indicators such as serum creatinine are insensitive, while gold standard renal biopsy is invasive and prone to complications. Therefore, it is necessary to find a sensitive and effective way to diagnose patients with early renal injury and intervene as early as possible to slow down the disease progress and improve the prognosis of patients. T2 mapping, as a quantitative MRI technique, can provide quantitative information about the content and composition of water and collagen fibers [1]. It has been applied to quantitative evaluation of heart, nerves and bone joints. In this study, we quantitatively evaluated renal function damage in patients with liver cirrhosis by T2 mapping sequence.Methods
From August 2019 to October 2022, a total of 16 patients with liver cirrhosis were examined by 3.0 T magnetic resonance scanner (Ingenia CX, Philips, Poland) in our hospital, and 16 healthy volunteers were collected as the control group. The scanning sequence included routine abdominal MR examination and T2 mapping sequence. All the original images were imported into the workstation to generate pseudo-color images, and the oval ROI was placed on the cortex and medulla at the upper pole, middle pole and lower pole of the right kidney, respectively, and its T2 value was measured. Shapiro-Wilk test was used to test the data normality, and Mann-Whitney U test was used to compare the differences between the two groups. The diagnostic efficiency was analyzed by receiver operating characteristic curve (ROC). P < 0.05 indicates that there is a statistical difference.Results
Mann-Whitney U test showed that the T2 values of cortex and medulla in cirrhosis group were higher than those in control group, and the difference was statistically significant (P < 0.05). The sensitivity, specificity and area under curve (AUC) of T2 value of cortex and medulla are shown in Table 1.Discussion
Immune cells (such as macrophages, lymphocytes, etc.) released by patients with liver cirrhosis release inflammatory factors, growth factors and other cytokines that promote fibrosis. These factors may simultaneously act on kidney tissues, leading to the formation of local fibrosis microenvironment in kidney tissues, and promoting the activation and proliferation of myofibroblasts and the production and deposition of ECM [2]. T2 mapping is one of the quantitative imaging techniques, which has objectivity, good repeatability and stability. It has been widely used in the research of articular cartilage lesions, soft tissue injuries, cardiomyopathy [3-5] and so on. Based on T2 mapping technique, this study found that T2 value of renal cortex and medulla in cirrhosis group was higher than that in control group, which may be due to the deposition of extracellular matrix, the decrease of intercellular space, the restriction of water molecule movement and the decrease of free water content.Conclusion
T2 mapping can be used as a new, non-invasive, sensitive and effective way to evaluate early renal function damage in patients with liver cirrhosis, which has certain significance for clinical decision-making, early disease intervention and prognosis improvement.Acknowledgements
None.References
1.Wang F, Zhang H, Wu C, Wang Q, Hou B, Sun Y, Kober T, Hilbert T, Zhang Y, Zeng X, Jin Z. Quantitative T2 mapping accelerated by GRAPPATINI for evaluation of muscles in patients with myositis. Br J Radiol. 2019 Oct;92(1102):20190109. doi: 10.1259/bjr.20190109. Epub 2019 Jul 19. PMID: 31287733; PMCID: PMC6774592.2.Hoerger TJ, Simpson SA, Yarnoff BO, et al.The future burden of CKD in the United States: a simulation model for the CDC CKD Initiative. Am J Kidney Dis. 2015 Mar;65(3):403-11. 3.Juras V, Bohndorf K, Heule R, Kronnerwetter C, Szomolanyi P, Hager B, Bieri O, Zbyn S, Trattnig S. A comparison of multi-echo spin-echo and triple-echo steady-state T2 mapping for in vivo evaluation of articular cartilage. Eur Radiol. 2016 Jun;26(6):1905-12. doi: 10.1007/s00330-015-3979-6. Epub 2015 Sep 3. PMID: 26334512; PMCID: PMC4863907.4.Ferrero G, Sconfienza LM, Fiz F, Fabbro E, Corazza A, Dettore D, Orlandi D, Castellazzo C, Tornago S, Serafini G. Effect of intra-articular injection of intermediate-weight hyaluronic acid on hip and knee cartilage: in-vivo evaluation using T2 mapping. Eur Radiol. 2018 Jun;28(6):2345-2355. doi: 10.1007/s00330-017-5186-0. Epub 2018 Jan 9. PMID: 29318429.5.Chaikriangkrai K, Abbasi MA, Sarnari R, Dolan R, Lee D, Anderson AS, Ghafourian K, Khan SS, Vorovich EE, Rich JD, Wilcox JE, Blaisdell JA, Yancy CW, Carr J, Markl M. Prognostic Value of Myocardial Extracellular Volume Fraction and T2-mapping in Heart Transplant Patients. JACC Cardiovasc Imaging. 2020 Jul;13(7):1521-1530. doi: 10.1016/j.jcmg.2020.01.014. Epub 2020 Mar 18. PMID: 32199848; PMCID: PMC8809107.Figures
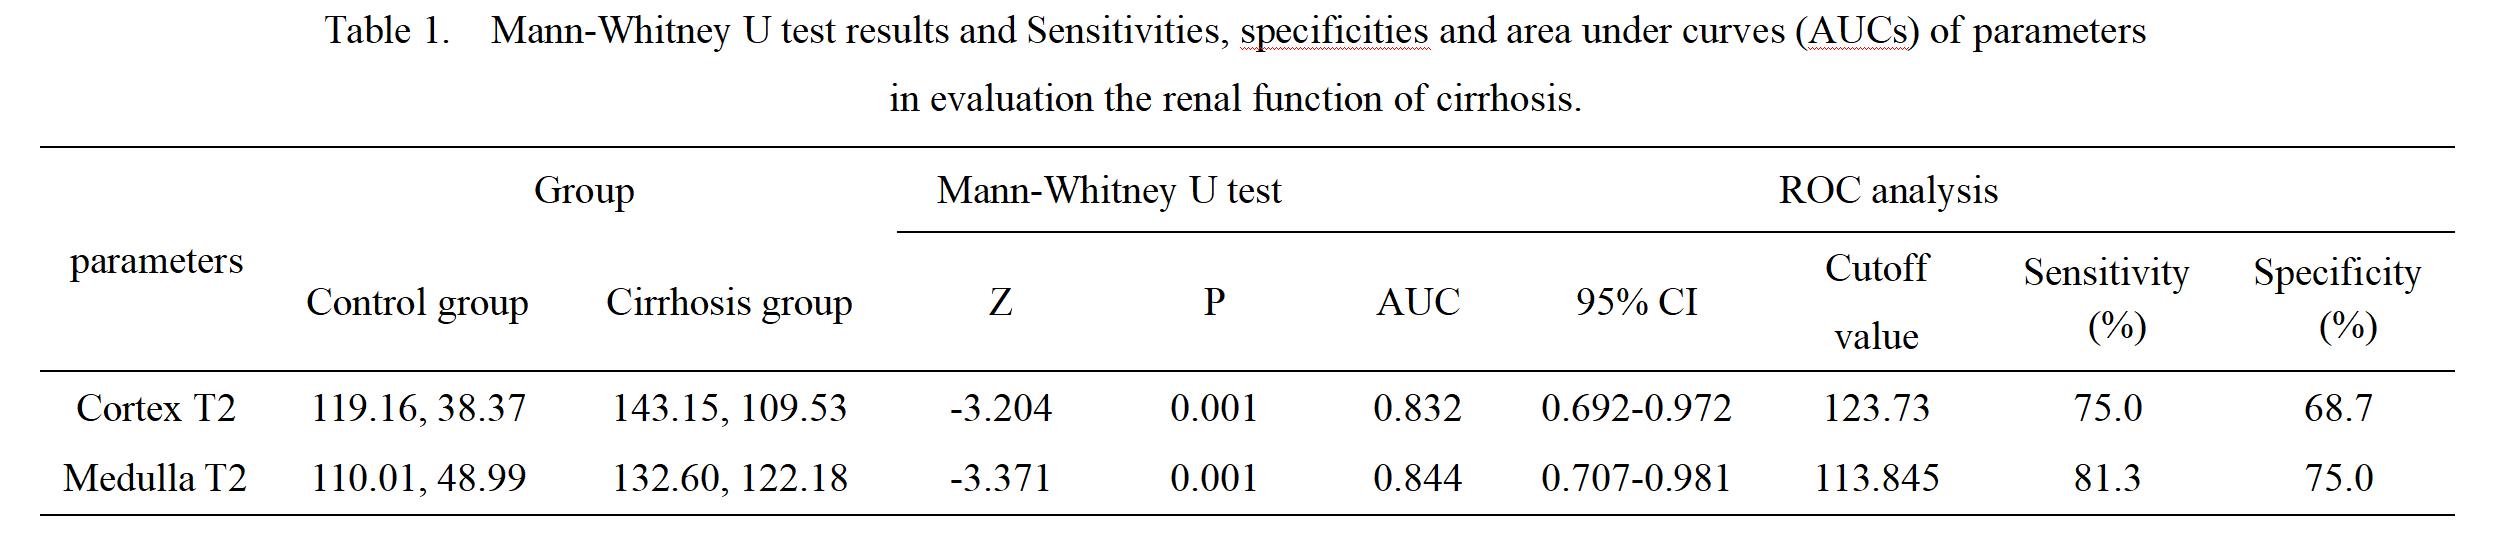
Table 1. Mann-Whitney U test results and Sensitivities, specificities and area under curves (AUCs) of parameters in evaluation the renal function of cirrhosis.
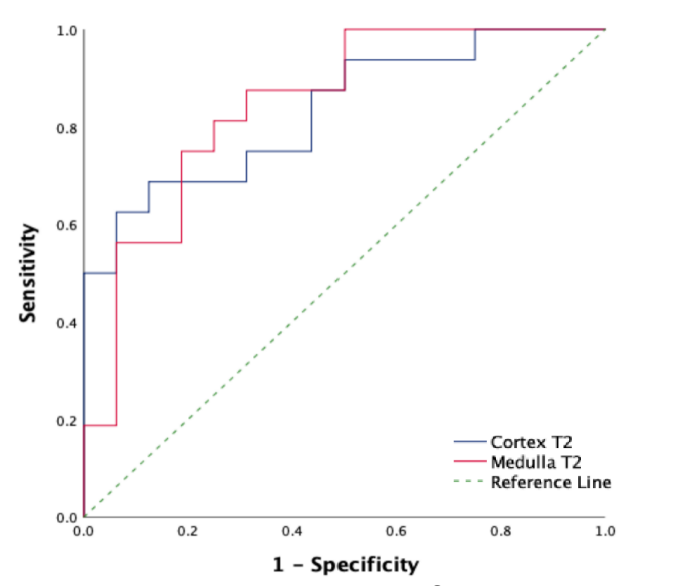
Figure 1. ROC curves showed performances of cortex T2 and medulla T2.
DOI: https://doi.org/10.58530/2023/3627