3604
Deep-learning auto-segmentation and subtype classification of pituitary adenoma based on MRI radiomics1Department of Biomedical Imaging and Radiological Sciences, National Yang Ming Chiao Tung University, Taipei, Taiwan, 2Department of Radiology, Taipei Veterans General Hospital, Taipei, Taiwan, Taipei, Taiwan, 3Division of Endocrine and Metabolism, Department of Medicine, Taipei Veterans General Hospital, Taipei, Taiwan, 4School of Medicine, National Yang Ming Chiao Tung University, Taipei, Taiwan
Synopsis
Keywords: Radiomics, Quantitative Imaging, Pituitary adenoma
Pituitary adenoma (PA) accounts for approximately 15% in intracranial neoplasms. The classification of PA generally based on the hormone level of blood as the gold standard test, while the analysis of hormone condition using neuroimaging biomarkers was less explored. Accordingly, our study developed a model to automatically segment PA and further used the quantitative and non-invasive MRI technique as image biomarkers to classify the three types of hormone pattern, focusing on corticortroph, gonadotroph, and plurihormonal type. We aimed to provide a feasible classification model based MRI to benefit the clinical management of patients with PA.Background and Purpose
Pituitary adenoma (PA) accounts for approximately 15% in intracranial neoplasms [1]. PA may lead to secrete excess hormones (including prolactin, growth hormone, adrenocorticotropic hormone, and thyrotropin) or be nonsecreting (most gonadotroph lineage) [2]. The classification of PA generally based on the hormone level of blood as the gold standard test. Once the PA becomes lager and compresses the brain tissue, such as optic nerves, or the hormone test is positive, surgery will be needed. Previous studies reported that non-functioning PA may have early progression or recurrence after surgery, and MR radiomics can provide precise prediction [3]. However, the differentiation of hormone pattern using neuroimaging biomarkers was less explored. Accordingly, our study combined the deep learning–based segmentation and radiomics to fulfill the series of PA subtype classification. For the first part of this study, we developed a model to automatically segment PA. The second part was to perform the subtype classification of PA using the MRI radiomics. We aimed to identify image biomarkers to classify the three types of hormone pattern in PA, including corticortroph, gonadotroph, and plurihormonal type.Materials and Methods
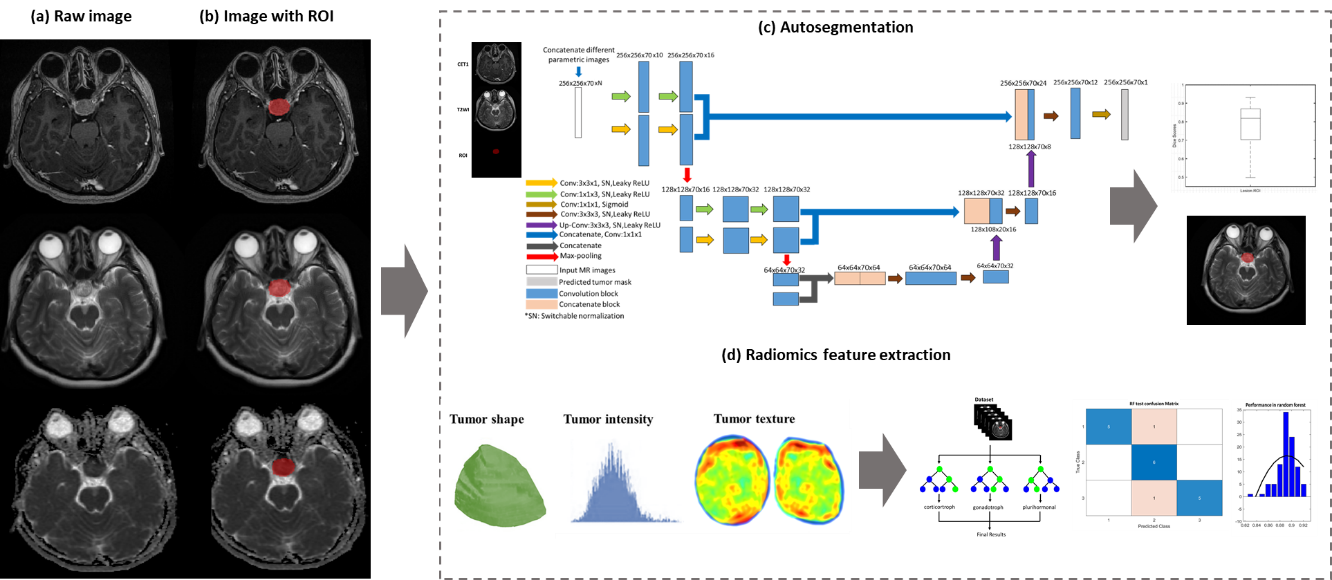
We retrospectively concluded 147 patients with pituitary adenoma and hormone pattern proved by immunohistology between 2010 and 2020 at Taipei Veterans General Hospital. MRI data include contrast-enhanced T1-weighted (CET1), T2-weighted images (T2W), and apparent diffusion coefficient (ADC).Several postprocessing steps on the MRI were applied to reduce the discrepancy of imaging parameters using our previously published MRI radiomics platform (MRP, http://www.ym.edu.tw/~cflu/MRP_MLinglioma.html) with a graphic user interface built on MATLAB programming environment [4]. The adjustment of image resolution was first performed to resample all voxel size to isotropic spatial resolution (1.00 x 1.00 x 1.00 mm3) for each MRI contrast according to Image biomarker standardisation initiative (IBSI) [5]. The PA lesions were manually delineated and used for training an automatic segmentation model followed by the extraction of 1178 radiomic features (including the gray-scale intensity patterns, lesion shape/size geometry, and texture features).
A two-pathway 3D U-Net architecture was proposed, and CET1 and T2W images were used as multi-parametric input volumes. The deep-learning segmentation model was built on MATLAB interface (with Deep Learning Toolbox and Computer Vision Toolbox in R2022a version).
N-way analysis of variance (N-way ANOVA) was performed to extract the significantly different features (p <0.05) between three types of hormone pattern in PA. Random forest (RF) classifier was utilized to extract the features and further build the classification models of PA subtype based on radiomic predictors. The dataset was randomly separated into training dataset and testing dataset with a ratio of 8:2. To assess the reproducibility of this model, we tested modeling performance with bootstrap of 100 times. Figure 1 shows the workflow of PA analysis.
Results and Discussion
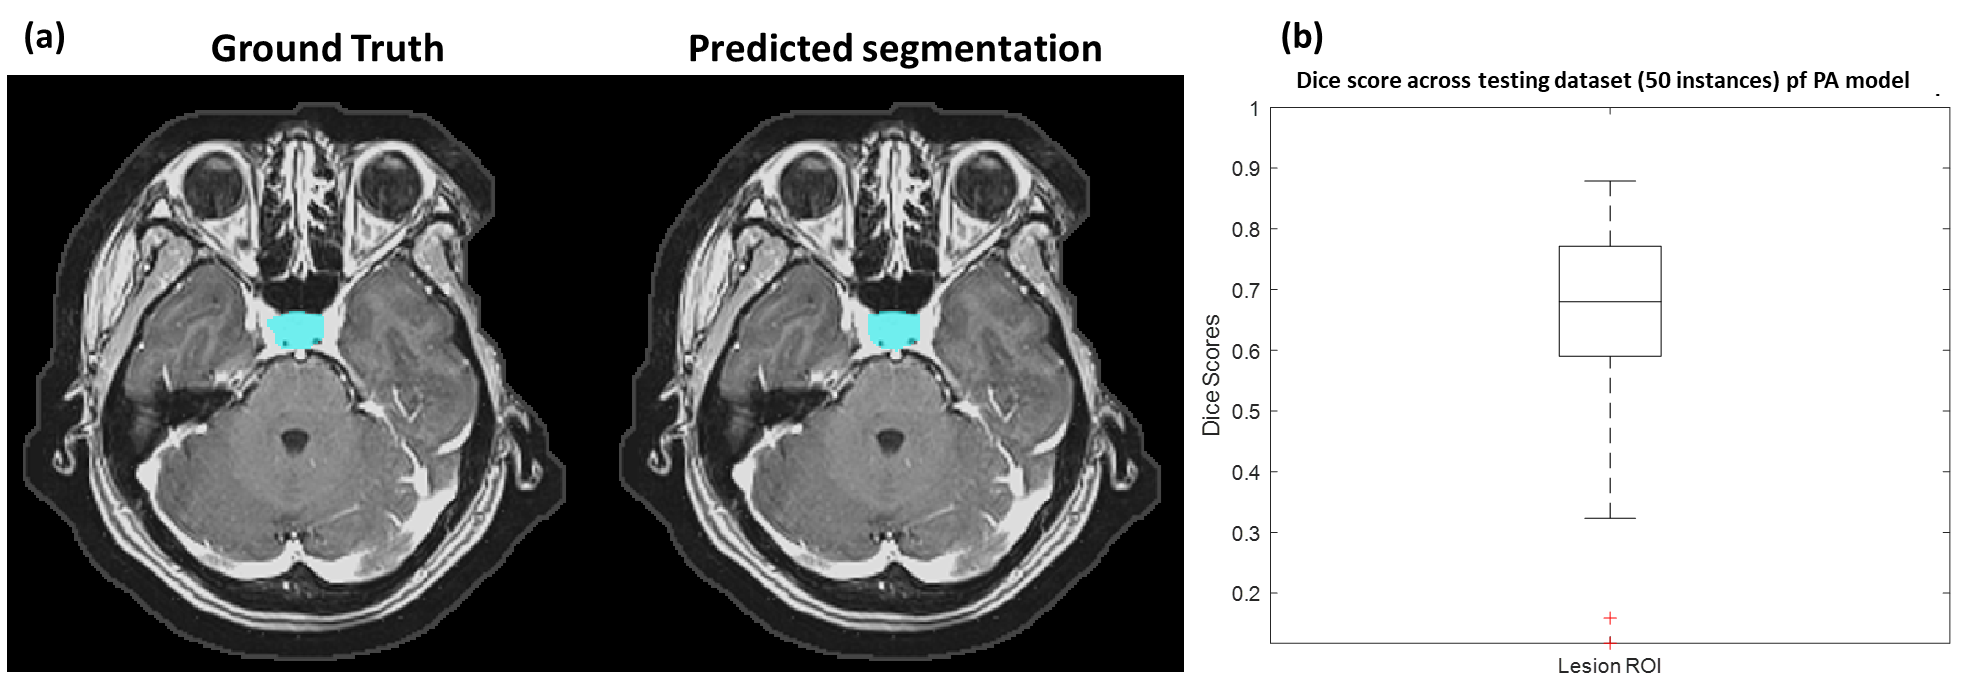
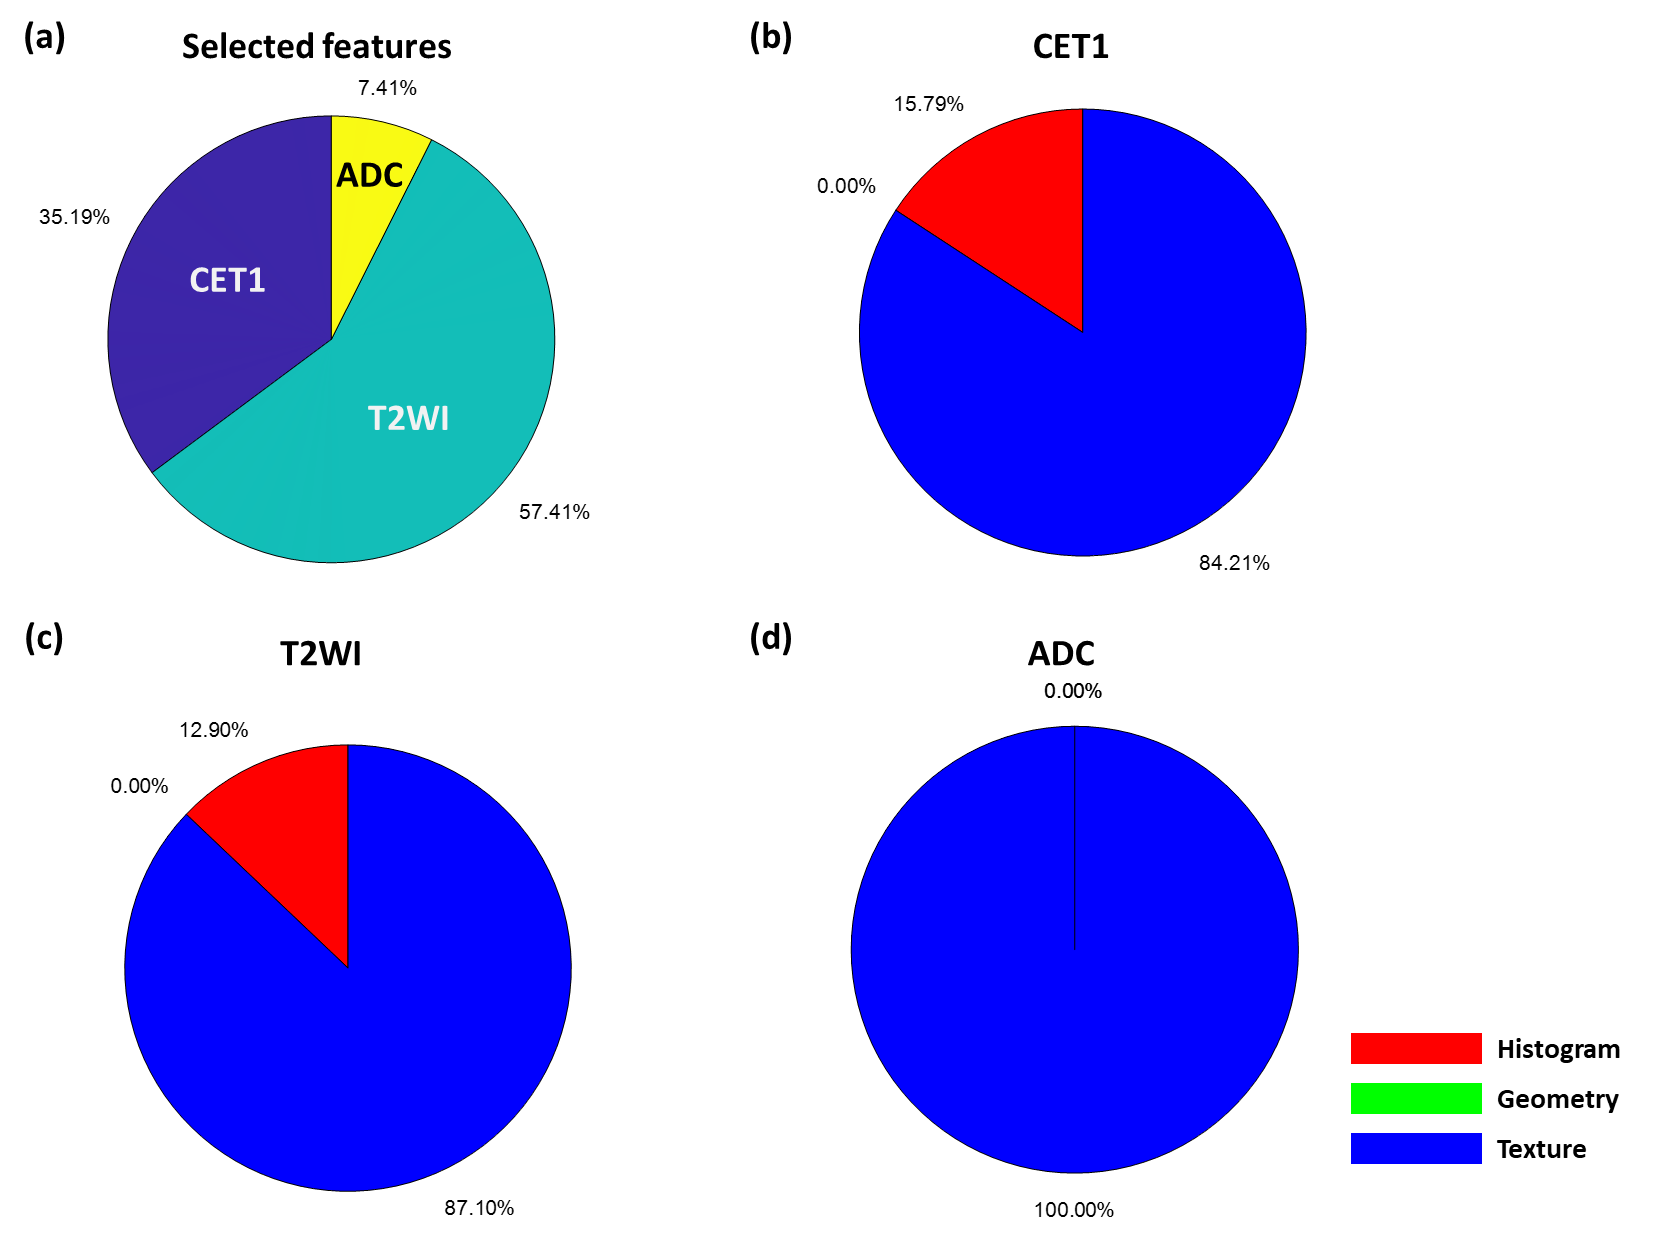
We used 100 patients’ MRI data to build up U-Net models for the automatic PA segmentation. We further applied data augmentation by flipping image left and right and rotating image with 10, 20, 30, and 40 degrees to increase sample size to 900 MRI datasets. Among these data, 850 image sets were used to train the 3D U-Net and 50 image sets were used for model evaluation. Figure 2a shows the ground truth and the predicted segmentation of a demonstrative case. Results showed that the model could achieve a dice coefficient with a median of 0.680 (Figure 2b).For the second part of this study, 90 patients' MRI data were used to identify radiomic features for classification. The predictors were extracted from CET1 (35.2%), T2WI (57.4%), and ADC (7.4%). This finding was consisted with previous study that T2WI could provide most of valuable information for subtype classification of PA model [6]. Furthermore, CET1 could also improve the model performance (Figure 3). We found most of the selected radiomic features were texture features and small part of them were histogram features, while no geometry feature was selected (Figure 3). Our PA data contained microadenoma, macroadenoma, and aggressive adenoma among three subtypes. Accordingly, we speculated that the conventional visual inspection without quantitative analysis based on radiomics could not differentiate the PA subtypes effectively.
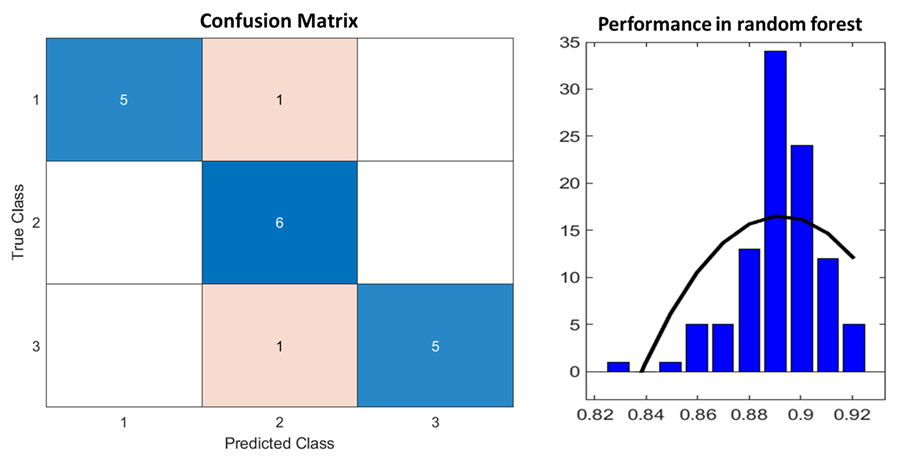
By analyzing our confusion matrix, the mistakes made by the classifier were one case of corticortroph identified as gonadotroph type, and the other case of plurihormonal identified as gonadotroph type. The overall accuracy of the RF model in the test group was 88.9% (16/18) (Figure 4). After 100 times bootstrapping, our data showed a right skewness with an accuracy of 0.89 (Figure 4). Previous studies have only classified the PA into two subtypes, such as functional vs. nonfunctional or soft vs. fibrous [3, 6]. In this study, we constructed a RF model based on MRI radiomics to classify the PA into three subtype. We suggested that multi-parametric MRI, including CET1, T2WI, and ADC, could provide sufficient image features for PA classification.
Acknowledgements
This work was supported by the Ministry of Science and Technology, Taiwan (MOST 109-2314-B-010-022-MY3).References
1. Melmed, S., Pituitary-tumor endocrinopathies. New England Journal of Medicine, 2020. 382(10): p. 937-950.
2. Melmed, S., Pathogenesis of pituitary tumors. Nature Reviews Endocrinology, 2011. 7(5): p. 257-266.
3. Zhang, Y., et al., Radiomics approach for prediction of recurrence in non-functioning pituitary macroadenomas. Frontiers in oncology, 2020. 10: p. 2913.
4. Lu, C.-F., et al., Machine Learning–Based Radiomics for Molecular Subtyping of GliomasMachine Learning for Molecular Subtyping of Gliomas. Clinical Cancer Research, 2018. 24(18): p. 4429-4436. 5. Zwanenburg, A., et al., The image biomarker standardization initiative: standardized quantitative radiomics for high-throughput image-based phenotyping. Radiology, 2020. 295(2): p. 328-338.
6. Cuocolo, R., et al., Prediction of pituitary adenoma surgical consistency: radiomic data mining and machine learning on T2-weighted MRI. Neuroradiology, 2020. 62(12): p. 1649-1656.
Figures