3602
Globally optimal region thresholding based on bimodal Gaussian distribution with physiological constraints : head MR example.1Radiology, NYU Grossman School of Medicine, New York, NY, United States
Synopsis
Keywords: Segmentation, Segmentation, Thresholding
In medical image processing thresholding of the image region is one of the most basic operations and preprocessing. While there are well-proven histogram-based partitioning methods including Otsu and Gaussian Mixture Model ) it is challenging to combine those methods with physiological constraints such as tissue volume ratio or average signal ratio to avoid anatomically invalid segmentation. We propose a new method GOTC when the distribution of the signal over the ROI is described as a bimodal Gaussian of two tissues. We describe the algorithm and validate it on brain MRI segmentation into the White Matter and Gray Matter.Introduction
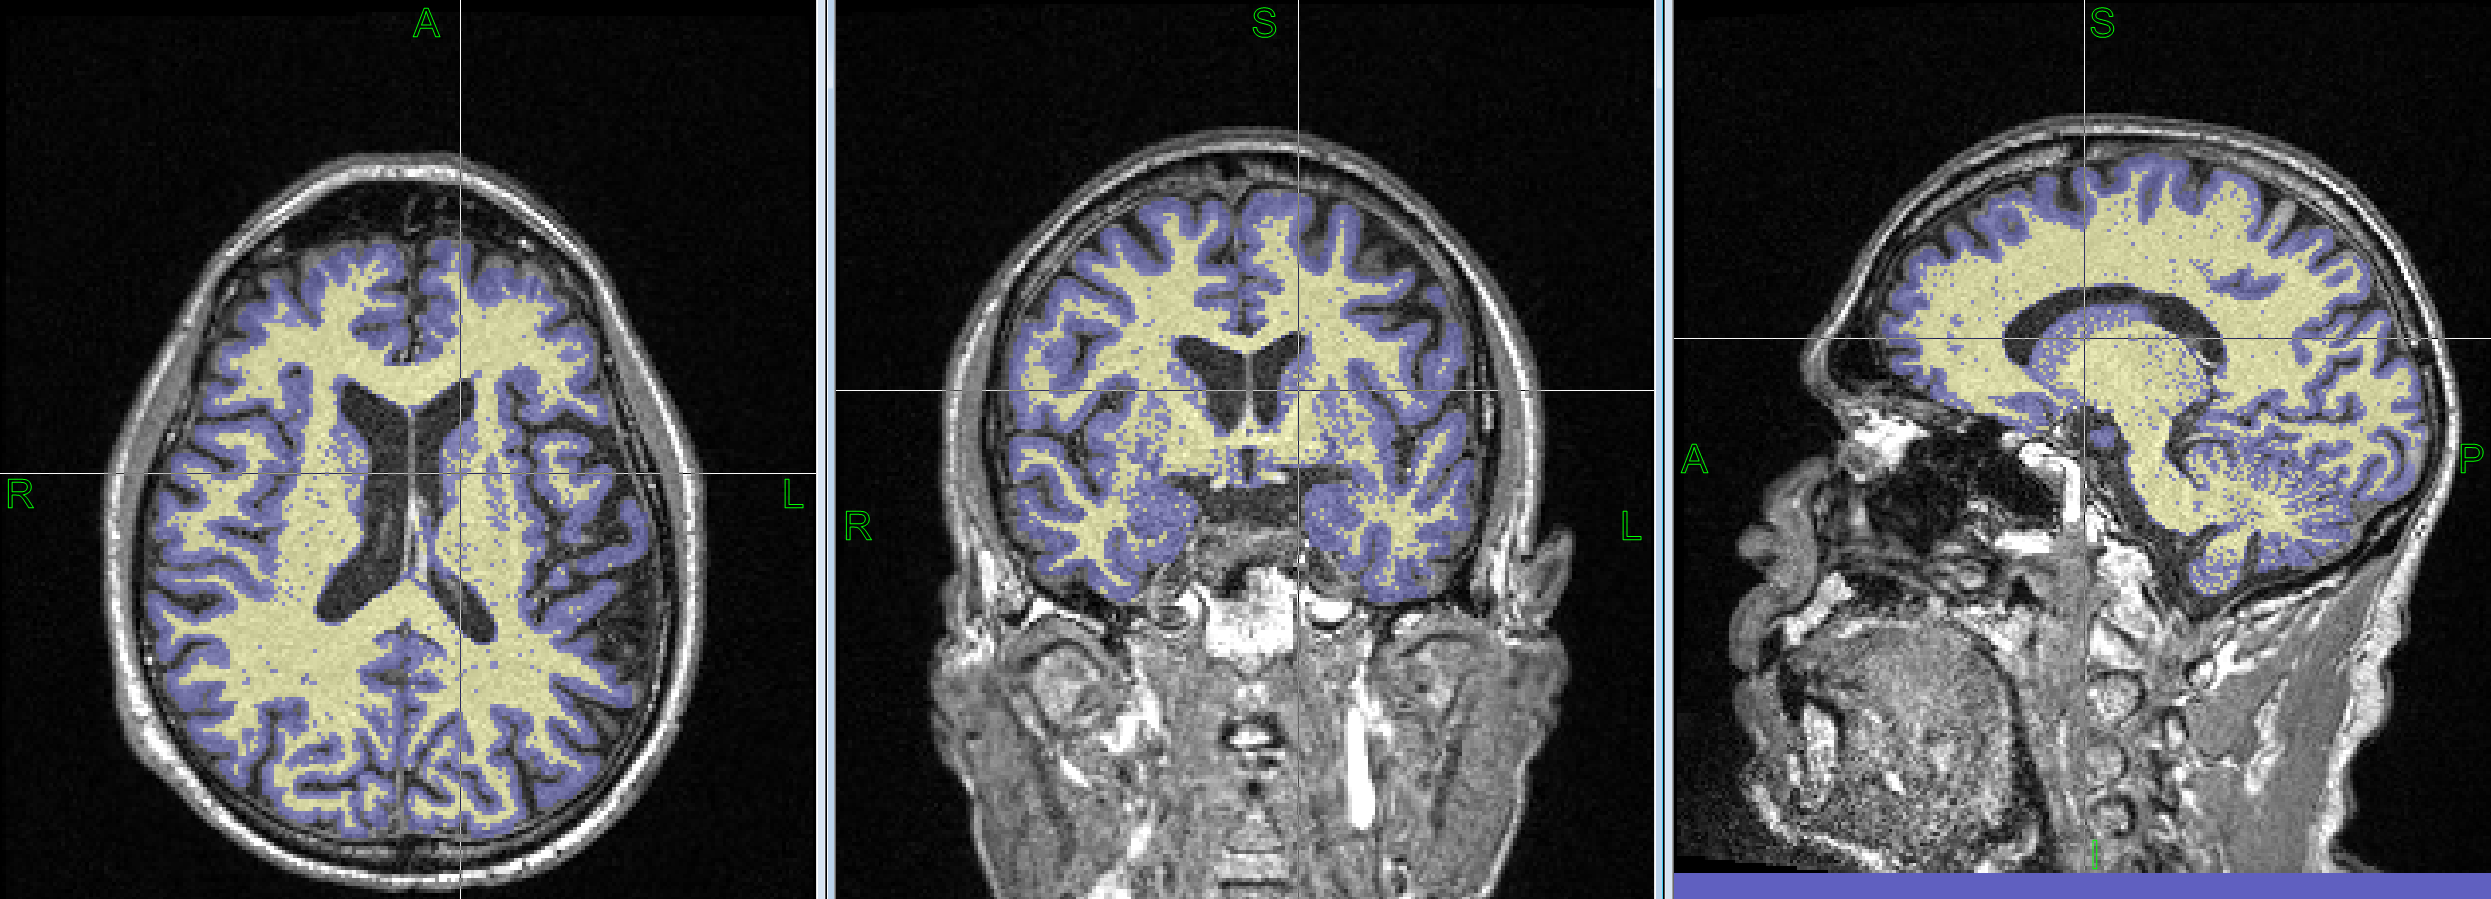
In medical image processing, thresholding of the image region is one of the most basic operations. An image has a whole-organ ROI to be partitioned into n disjoint tissue types. While there are standard histogram-based partitioning methods (including Otsu [1] and Gaussian Mixture Model [2]) it is challenging to combine those methods with physiological constraints such as tissue volume ratio or average signal ratio to avoid anatomically invalid segmentation. We propose a new method, GOTC, to model the distribution of the signal over the ROI that is described as a bimodal Gaussian. Each Gaussian corresponds to a different tissue. We describe the algorithm and validate it on brain MRI segmentation into the White Matter (WM) and Gray Matter (GM).Methods
We look for the global constrained optimum of approximating the histogram using the sum of two Gaussians. Optimization is physiologically constrained by WM/GM mass ratio range [3].We tested 6 brain images acquired using MPRAGE protocol.
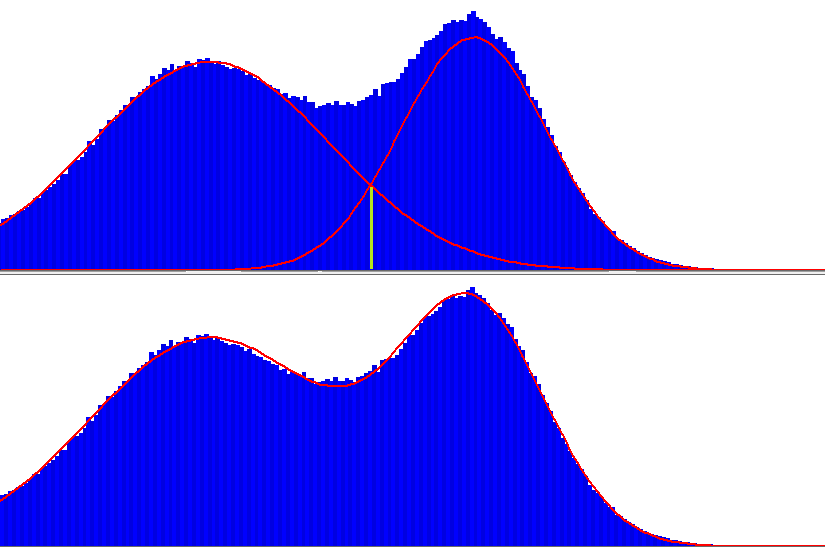
The first step is the bias field correction and the whole brain segmentation using the BridgeBurner method [4] resulting in brain mask (BM). Histogram of signal over the BM is then constructed. We attempt to approximate the histogram as a weighted sum of two Gaussian distributions. Each component is described by three parameters {pX,pY,S}: peak position (mean signal), peak value (weight) and standard deviation. We look for the globally optimal fit minimizing RMSE between modelled curve and the signal histogram, a 6-parameter nonlinear optimization {pX0, pY0, S0, pX1, pY1, S1} (where subscripts refer to GM=0, WM=1).
We use the Global Optimization Interval Arithmetic method [5]. Our first constraint is that R=pX1/pX0 is in the range [Rmin, Rmax] and is determined empirically to avoid the solutions where 2 peaks are too close or too far from each other. This constraint is easily integrated by replacing the pX1 fitted parameter with the ratio R and restricting the ratio to the specified range. The second constraint is based on the fact that the volume ratio U=WM/GM in the brain lies in the range [Umin, Umax] as shown in [3]. Before Global Optimization we use [Umin,Umax] and the ROI over the image to determine the possible range [T0,T1] for the values of the threshold so that U∊[Umin,Umax]. Then during the optimization a 6-dimensional parameter interval from the optimization stack is evaluated, resulting in the possible range of Gaussians and corresponding thresholds [t0,t1]. According to Hansen’s algorithm, for each parameter interval there is a corresponding range of attainable cost function. If the [t0,t1] is fully included in [T0,T1], we use the calculated range of the cost function : [costLow,costHigh] and put interval on the stack. If [t0,t1] is fully outside of [T0,T1] then we remove the parameter interval from the stack. If [t0,t1] partially intersects [T0,T1] we assign the cost range [costLow,INFINITY] to the parameter interval and put it back on the stack. Hansen's algorithm proceeds till the maximum number of iterations is reached or guaranteed spread of optimal parameters is within very small epsilon.
Resulting threshold is calculated as the X-coordinate of the intersection of two weighted Gaussian curves.
Algorithm was implemented using VC++ 2019 and is fully parallel. It was tested on a 16-core AMD processor with 32 threads running in parallel.
Results
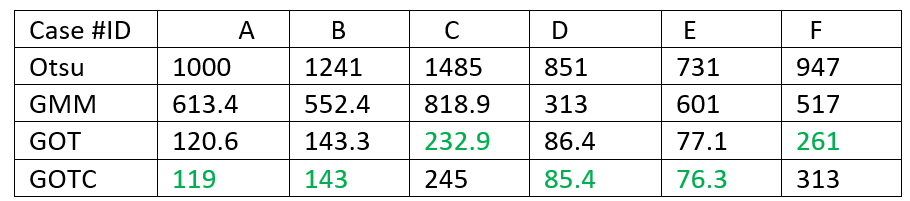
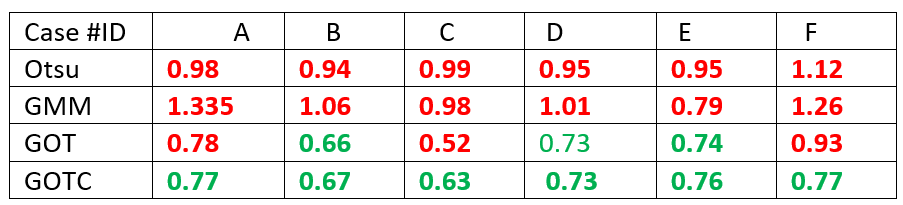
We tested on six different volumes using R = [1.2,3], U = [0.59,0.77]. We compared the values of the fitting RMSE and WM/GM volume ratio for 4 different methods : Otsu, Gaussian Mixture Models, Global optimization thresholding without constraints (GOT) and GOTC (with constraints), On all 6 volumes the GOTC fitting residual was much lower than the other methods: average RMSE for Otsu = 1042.7, Gaussian Mixture Model = 569.3, GOTC = 163.5. Otsu and GMM failed on all 6 volumes to ensure that WM/GM volume ratio is in a suitable range while GOTC satisfied constrains on all of them. In 2 cases GOTC (constrained) method achieved lower RMSE comparing to GOT (unconstrained) because the same number of iterations was used.Discussion
GOTC is a stable method that always converges and easily constrained. It is directly generalized to more than 2 Gaussian components at an additional computational cost. We also implemented the bimodal Laplace option of the same algorithm.Acknowledgements
No acknowledgement found.References
[1] Nobuyuki Otsu (1979). "A threshold selection method from gray-level histograms". IEEE Trans. Sys. Man. Cyber. 9 (1): 62–66. doi:10.1109/TSMC.1979.4310076.
[2] Published: 06 March 2012 Gaussian mixture model based segmentation methods for brain MRI images M. A. Balafar Artificial Intelligence Review volume 41, pages429–439 (2014)
[3] Age-Related Total Gray Matter and White Matter Changes in Normal Adult Brain. Part I: Volumetric MR Imaging Analysis. Yulin Ge, Robert I. Grossman, James S. Babb, Marcie L. Rabin, Lois J. Mannon and Dennis L. Kolson American Journal of Neuroradiology September 2002, 23 (8) 1327-1333;
[4] J Magn Reson Imaging. 2008 Jun;27(6):1235-41. doi: 10.1002/jmri.21372. Fully automatic segmentation of the brain from T1-weighted MRI using Bridge Burner algorithm. Artem Mikheev 1, Gregory Nevsky, Siddharth Govindan, Robert Grossman, Henry Rusinek.
[5] Eldon Hansen. Global Optimization Using Interval Analysis: Revised And Expanded. ISBN-10 : 0824740599
Figures