3600
Intensity-Based Segmentation of Tumor on Multiparametric MRI to Aid Response Assessment of High-Grade Gliomas Treated with Immunoradiotherapy1Moffitt Cancer Center and Research Center, Tampa, FL, United States, 2Department of Computer Science, Bradley University, Peoria, IL, United States, 3Quantitative Imaging Core, Moffitt Cancer Center and Research Institute, Tampa,, FL, United States, 4Behavioral and Community Health Sciences,, LSU Health School of Public Health, New Orleans, LA, United States, 5Department of Radiology, Moffitt Cancer Center and Research Center, Tampa,, FL, United States, 6Department of Integrated Mathematical Oncology, Moffitt Cancer Center and Research Institute, Tampa,, FL, United States, 7Department of Oncologic Sciences, University of South Florida, Tampa, FL, United States, 8Department of Radiation Oncology, Moffitt Cancer Center and Research Center, Tampa,, FL, United States, 9National Cancer Institute, National Institutes of Health, Bethesda, MD, United States, 10Department of Neuro-Oncology, Moffitt Cancer Center and Research Center, Tampa,, FL, United States
Synopsis
Keywords: Segmentation, Machine Learning/Artificial Intelligence, Glioblastoma, immunotherapy, radiotherapy
Confounding appearance of radiographic changes in recurrent high grade glioma (HGG) patients treated with multimodality immunotherapy presents a challenge to the neuro-radiologist. A clinical need exists to improve upon conventional criteria for assessment of GBM on standard-of-care (SOC; T1w, T2w, FLAIR, and T1w-enhanced) MRI to help distinguish treatment-related effects from true disease progression. We have investigated the feasibility of intensity-based segmentation of tumor tissue types on multiparametric MRI (mpMRI) to inform response assessment in HGG patients treated with bevacizumab, hypofractionated stereotactic radiotherapy, and pembrolizumab.Introduction:
Glioblastoma (GBM) is one of the most aggressive diseases, with an incidence rate is 3.21 per 100,000 persons1 and a 5-year survival rate of less than 10%2. Novel immunotherapeutics are being investigated to treat GBM3-5. Even as immunotherapy-containing multimodality therapeutic regimens are investigated in recurrent high-grade glioma (HGG), the challenge remains for the neuroradiologist to make timely interpretations of MRI imaging findings suggestive of disease progression, to prevent the premature termination of a patient's participation in a potentially beneficial clinical trial. A clinical need exists to improve upon conventional criteria for assessment of GBM on standard-of-care (SOC; T1w, T2w, FLAIR, and T1w-enhanced) MRI to help distinguish treatment-related effects from true disease progression. We have investigated the feasibility of intensity-based segmentation of tumor tissue types on multiparametric MRI (mpMRI) to inform response assessment in HGG patients treated with bevacizumab, hypofractionated stereotactic radiotherapy, and pembrolizumab.Methods:
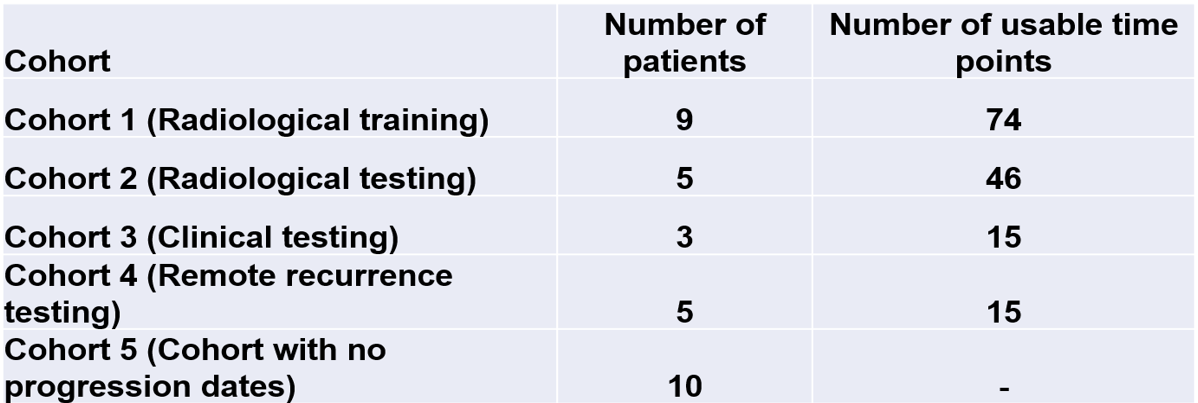
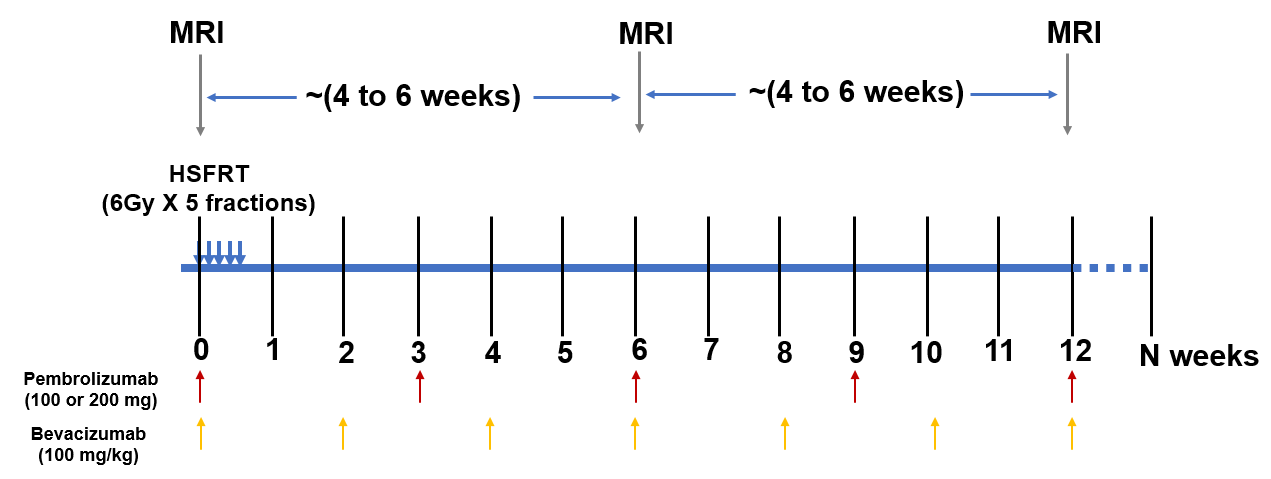
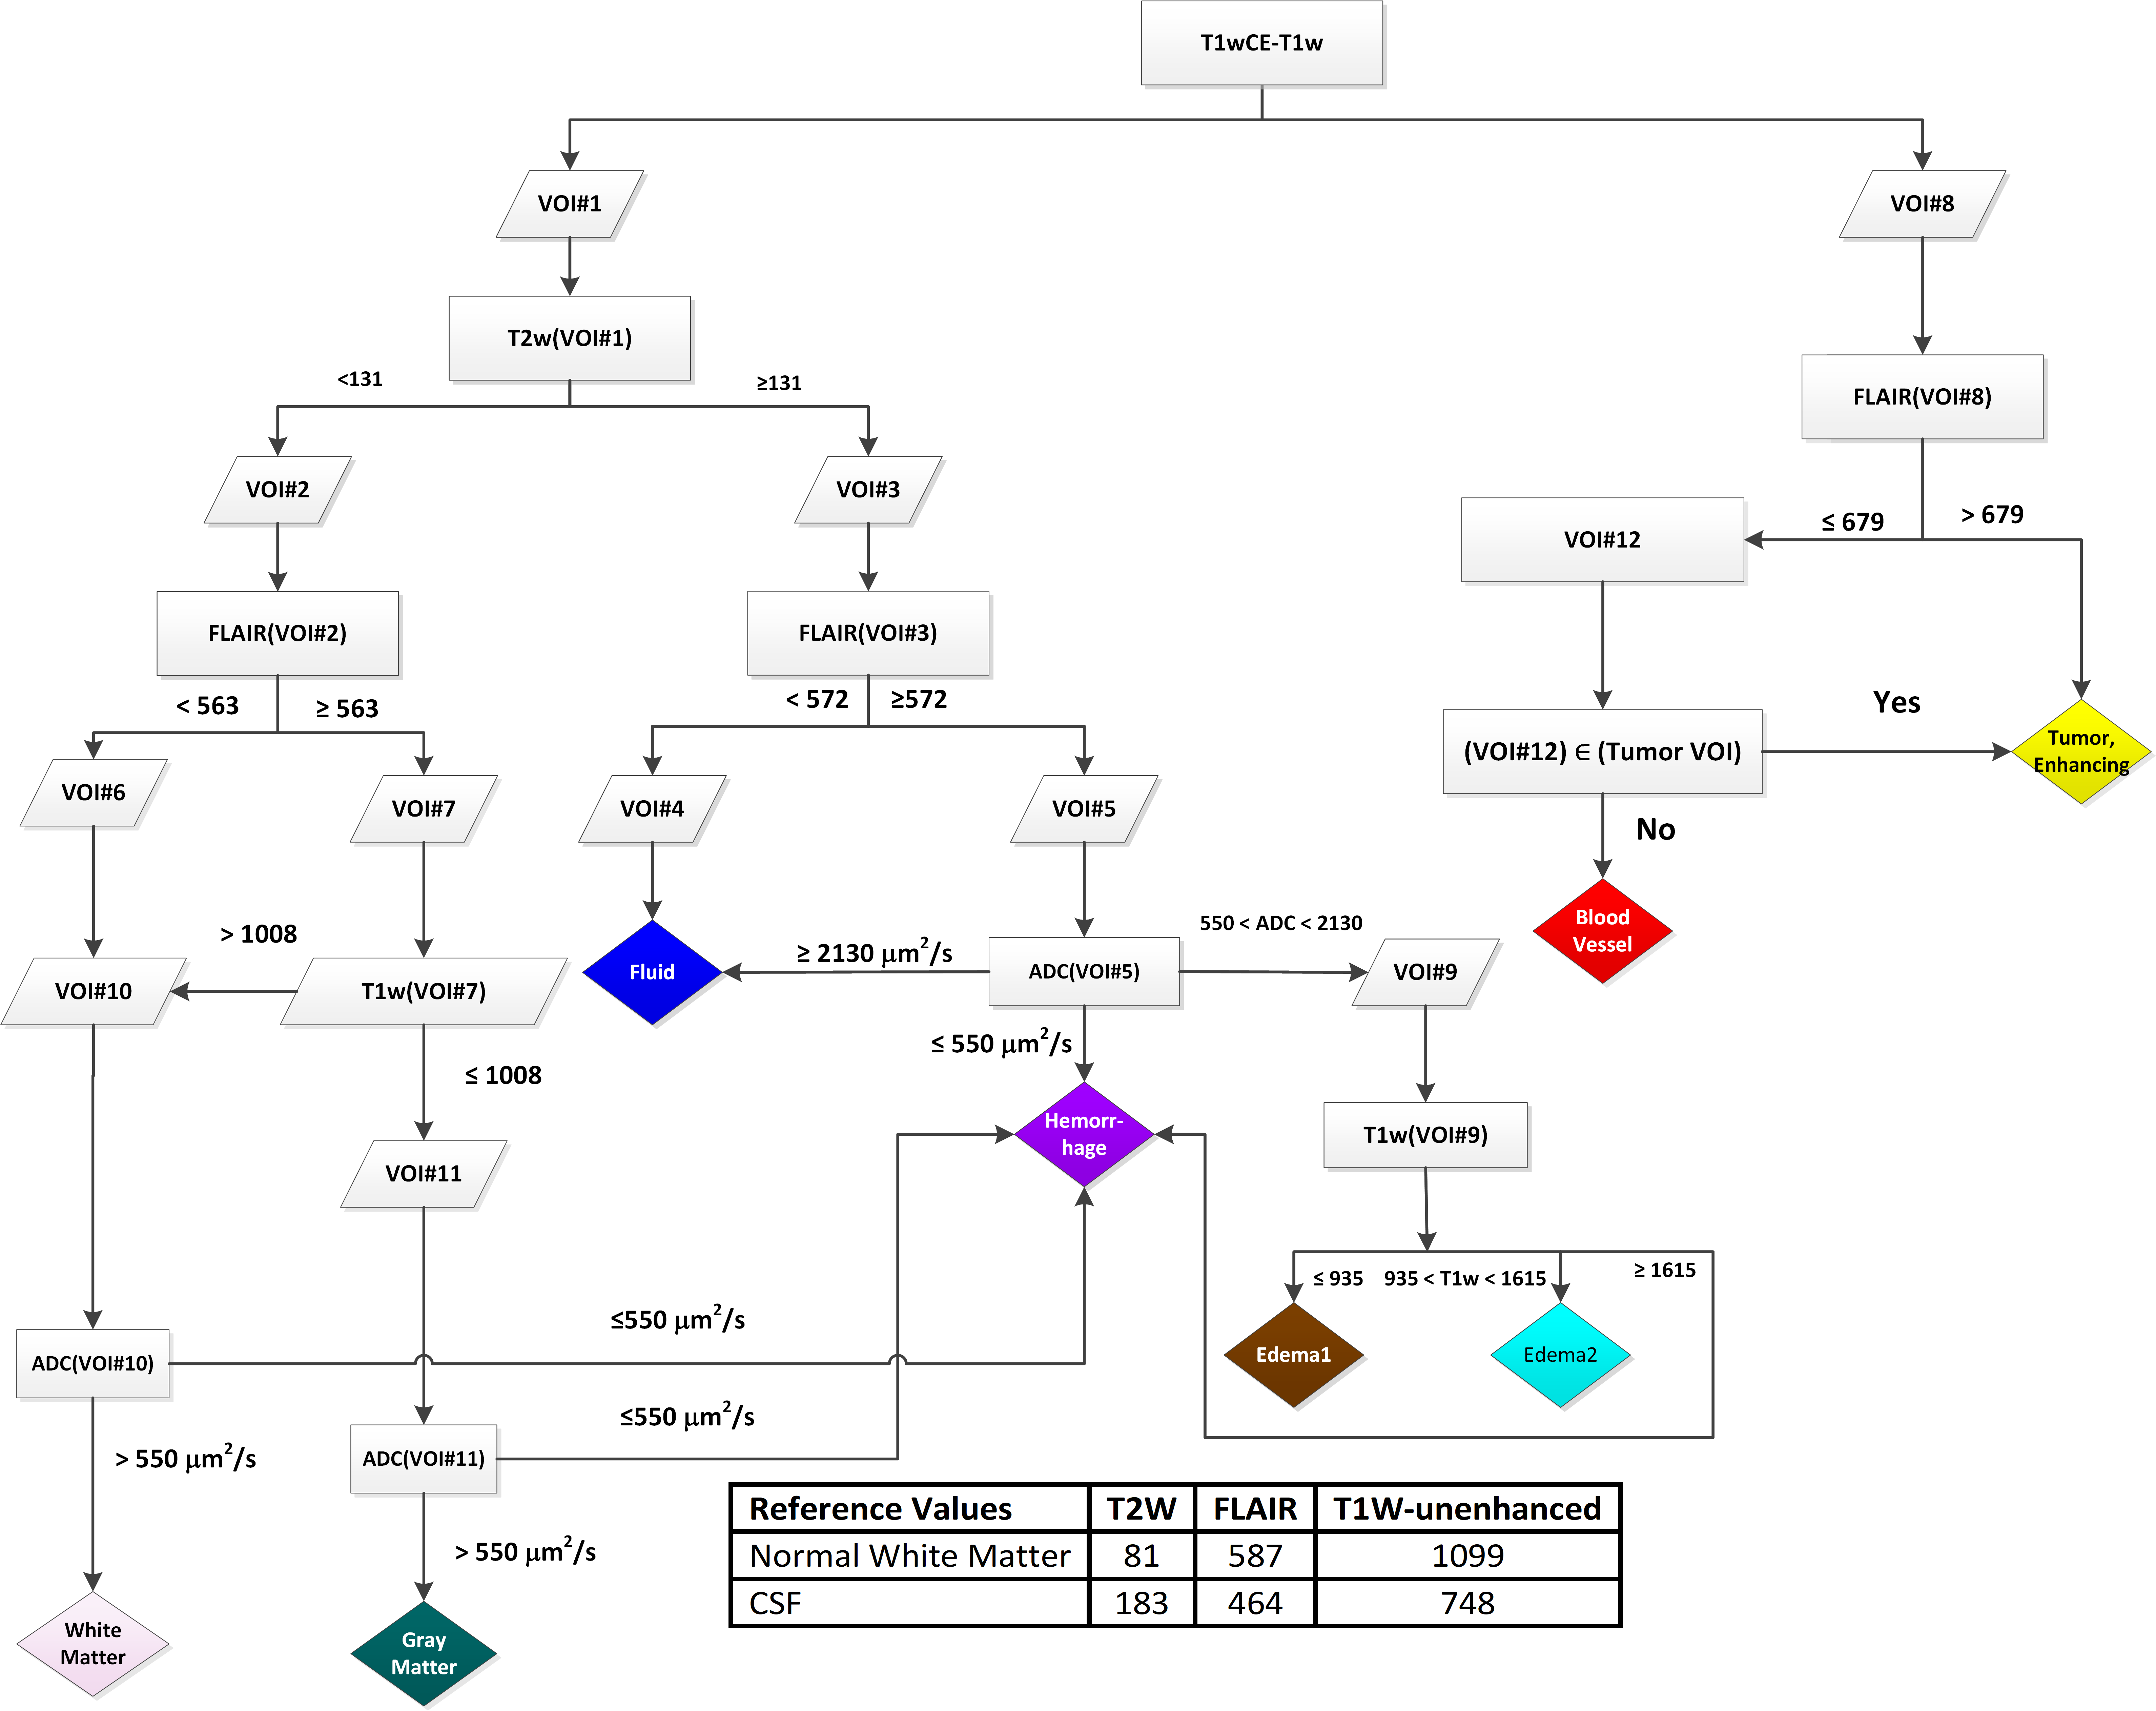
A total of 32 recurrent high-grade glioma (HGG) patients participated in a phase I clinical study of HGG treated with immunoradiotherapy. The treatment and imaging study schema is shown in Figure 1. The patients were divided into 5 cohorts for this imaging study (Table 1).Preprocessing: Intra- and inter-session registration was performed on SOC and ADC images followed by intensity-calibratroin of SOC images using two reference tissues (inset table in Figure 2)6.
mpMRI segmentation: Calibrated intensity thresholds at each decision node were iteratively adjusted, followed by the neuroradiologist's visual inspection of the resulting tissue type maps to converge on the decision tree presented in Figure 2. All pixels within a manually-defined VOI that were classified as contrast-enhancing tumor (CE), blood vessel (BV), Edema1, Edema2, or Fluid tissuetypes were combined into an "Abnormal Volume-of-Interest" (abVOI).
Linear regression model: Developed to relate the time remaining to progression (TTP) at a particular scan date to the volumes of tissue types CE, Edema1, Edema2, Edema1+Edema2, and Fluid within the abVOI, and time elapsed since day 1 of cycle 1 of treatment (t_C1D1). 74-time points from cohort 1 were used in the training data, and the performance of the trained model was tested on 46-time points in Cohort 2. We have investigated each predictor's relative importance.
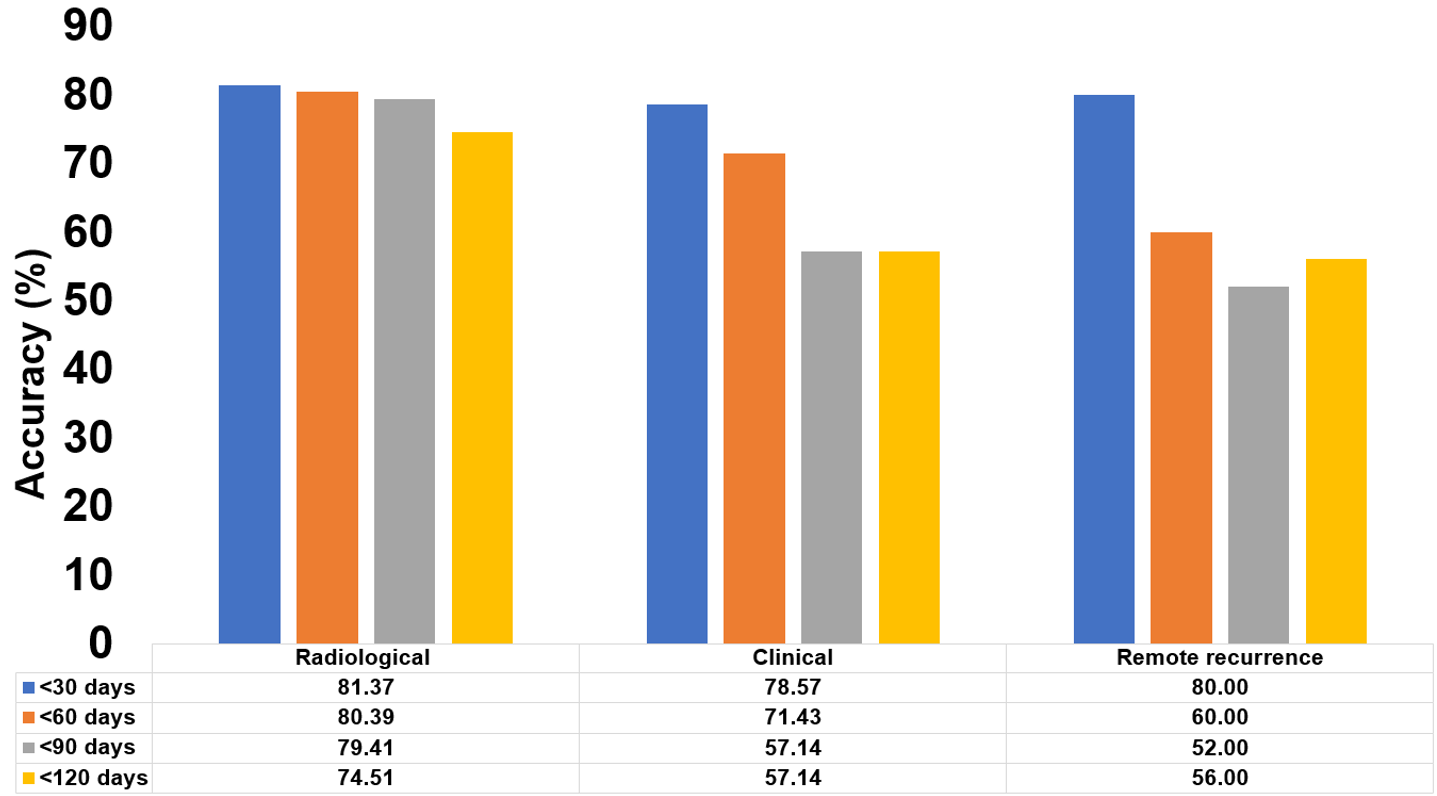
Model Performance: for predicting whether progression would occur within ≤30, ≤60, ≤90, or ≤120 days days following the scan date were computed as follows: the entries of each cohort were labeled 1 if the TTP was within the given threshold and 0 otherwise. The correctly identified labels on the true and predicted TTP were quantified for each cohort using equation [1]
$$Accuracy_{threshold,cohort}=\frac{correctly identified labels for an interval threshold in a cohort}{total number of labels in a cohort} {[1]}$$
Results:
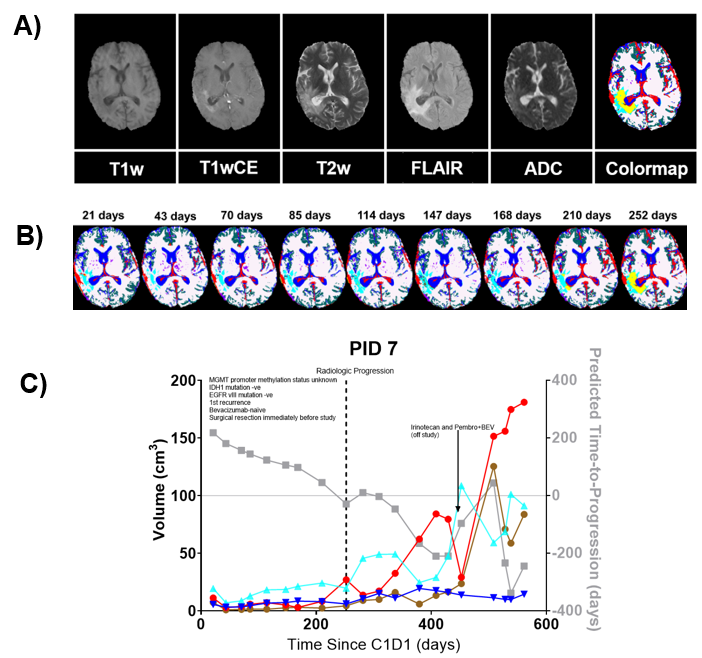
Visual inspection of segmentation volumes: Figure 3A) illustrates a representative patient's co-registered mpMRI images and the corresponding tissue type map (color). Segmentations of Gray matter (green), white matter (white), Fluid (blue), and vasculature (red) in non-tumor areas and around the tumor are classified as CE (yellow) and Edema2 (cyan), which aligns with the expectations of imaging signatures on mpMRI images. Dynamic changes in the tissue type map across various time points post-C1D1 in the same patient are shown in figure 3B. In this patient, the pathologic areas of the brain are characterized primarily by Edema2 (cyan) tissuetype through 168 days post-C1D1. The appearance of the enhancing tumor (CE, yellow) tissue type is noticeable at 210 days post-C1D1, with a significant increase by 252 days post-C1D1 when radiologic progression was called. Figure 3C illustrates temporal changes in volumes of tissuetypes within the abVOI across scan dates for the same subject.TTP Model optimization and performance: We included six independent variables: the abVOI volumes of CE, Edema1, Edema2, Edema1+Edema2, and Fluid tissue types, and t_C1D1 to train a linear regression model to predict the time remaining to progression at each scan date (TTP). The final form of the model, per the AIC criterion, optimized on the training data, is given in Equation [2]:
$$TTP=209.98(–)0.87*(t_C1D1)(–)2.15*(CE)(+)4.52*(Edema1)(+)3.23*(FLUID)[2] $$
The model had a goodness-of-fit (R2) for predicting TTP of 0.73 on training data, dropping to 0.46 on test data. Increases in t_C1D1 and CE volume were associated with decreases in TTP (negative indicators for patient outcome), while increases in Edema1 and Fluid volumes were weakly associated with increases in TTP (positive indicators for patient outcome). t_C1D1 (59%) and the CE volume (28%) contributed 87% to model R2. The model's average accuracy was 80% across all analyzed subjects for predicting progression within 30 days of a given scan date (Figure 4). Model accuracy for predicting progression within 30 days of the scan date was comparable between the radiological and remote response cohorts, suggesting that changes within the abVOI precede actual progression outside the abVOI.
Conclusion:
We show the feasibility of a linear regression model comprising 3 specific tissuetype volumes computed off mpMRI acquired at a single scan date and t_C1D1 to predict TTP. The model had reasonable goodness-of-fit on training (0.73) and testing data (0.46) and predicted TTP with good accuracy (80%) within a 30-day time interval of a given scan date.Acknowledgements
No acknowledgement found.References
1. Ostrom QT, Patil N, Cioffi G, Waite K, Kruchko C, Barnholtz-Sloan JS. CBTRUS Statistical Report: Primary Brain and Other Central Nervous System Tumors Diagnosed in the United States in 2013-2017. Neuro Oncol. 2020; 22(12 Suppl 2):iv1-iv96.
2. Avril T, Vauleon E, Tanguy-Royer S, Mosser J, Quillien V. Mechanisms of immunomodulation in human glioblastoma. Immunotherapy. 2011; 3(4 Suppl):42-44.
3. Nayak L, Molinaro AM, Peters K, et al. Randomized Phase II and Biomarker Study of Pembrolizumab plus Bevacizumab versus Pembrolizumab Alone for Patients with Recurrent Glioblastoma. Clin Cancer Res. 2021; 27(4):1048-1057.
4. Reardon DA, Brandes AA, Omuro A, et al. Effect of Nivolumab vs Bevacizumab in Patients With Recurrent Glioblastoma: The CheckMate 143 Phase 3 Randomized Clinical Trial. JAMA Oncol. 2020; 6(7):1003-1010.
5. Sahebjam S, Forsyth PA, Tran ND, et al. Hypofractionated stereotactic re-irradiation with pembrolizumab and bevacizumab in patients with recurrent high-grade gliomas: results from a phase I study. Neuro Oncol. 2021; 23(4):677-686.
6. Stringfield O, Arrington JA, Johnston SK, et al. Multiparameter MRI Predictors of Long-Term Survival in Glioblastoma Multiforme. Tomography. 2019; 5(1):135-144.
Figures