3598
Comparison of whole brain parenchyma fraction (BPF) from T1W and diffusion MRI in the assessment of CLN3, a neurodegenerative disease1Laboratory on Quantitative Medical Imaging, NIBIB, NIH, Bethesda, MD, United States, 2Henry Jackson Foundation for Advancement of Military Medicine, Bethesda, MD, United States, 3Division of Translational Medicine, NICHD,NIH, Bethesda, MD, United States, 4Office of Clinical Director, NIMH,NIH, Bethesda, MD, United States, 5Office of Clinical Director, NINDS,NIH, Bethesda, MD, United States
Synopsis
Keywords: Segmentation, Quantitative Imaging, Neurodegeneration, Neurodegeneration diseases, aging, T1-weighted segmentation, T1W, DTI, Diffusion Tensor Imaging, brain parenchyma volume, brain atrophy
In this work, we have compared if whole brain parenchyma fraction (BPF) measured from conventionally used T1-weighted (T1W) based brain segmentation method is comparable to signal fraction attributable to parenchymal water (Par-SF) measured from method using diffusion MRI, in assessing the overall disease state of participants with CLN3, a pediatric neurodegenerative disease.Introduction
Global brain atrophy has been used as a surrogate marker to monitor disease progression in various neurodegenerative diseases and normal aging1.Typically, neurodegenerative, and normal aging studies use T1-weighted (T1W) images to measure regional and global brain atrophy, with diffusion tensor imaging (DTI) used mainly to study microstructural changes in the brain. In T1W brain segmentation, regional and global brain atrophy is measured after the classification of white, gray matter tissue from cerebrospinal fluid (CSF) based on the signal intensity measured from each tissue type and CSF. Thereafter, brain parenchyma volume (BPV) ratio to the respective total intracranial volume (TIV) estimates the brain parenchyma fraction (BPF) that gives a measure of brain atrophy2. With diffusion imaging, however, it is possible to use a dual compartment model that could extract a signal fraction attributable to fast diffusing CSF-like water (CSF-SF), and signal fraction attributable to parenchymal water (Par-SF), with the requirement that diffusion data is acquired with an additional shell comprising of intermediate b-values to avoid the model from being ill posed3. CSF-SF is expected to account for contributions from small pockets of water such as lacunes or perivascular spaces, as well as capillary blood flow. A reduction in Par-SF and a corresponding increase in CSF-SF should be observed in presence of brain atrophy. We reason that Par-SF computed from whole brain using this strategy could provide a new metric akin to BPF measured with T1W imaging, that can correlate with clinical score to monitor brain atrophy with disease progression. Previous studies have shown that CLN3, a pediatric neurodegenerative disease, is accompanied by atrophy of cortical gray and regional white matter volume, and the measured regional brain atrophy is a sensitive parameter in monitoring disease progression 4-8. In this work, we will evaluate if there is a correlation between the measured T1W BPF and DTI Par-SF, from whole brain, with CLN3 participants’ disease state (physical, where higher scores =more impairment and capability with actual vision, where lower scores=more impairment) as measured by the Unified Batten Disease Rating Scale (UBDRS)9, and adaptive behavior as measured by Vineland-3 adaptive behavior composite (ABC)10 scores, where lower scores=more impairment. In parallel, we will evaluate if there is a correlation between T1W BPF and DTI Par-SF measurements.Materials and Methods
T1W Turbo Field Echo (TFE) images and Diffusion data (with 180 DWI volumes, 4 phase encoding directions, b=300s/mm^2 and b=1000s/mm^2) on 18 participants [female (n=9), male (n=9), median age = 9.76 yrs, range 6.8-17.5 yrs] with CLN3 were acquired on a Philips Achieva 3T system. Resampled 1mm T1W images were used in Sienax11 to generate brain parenchyma volume, which is adjusted for head size automatically by the software, to generate BPF (T1W BPF Sienax) in mm3. Par-SF was calculated from 1mm isotropic diffusion data using TORTOISE 12-14, where processed diffusion data was fit with a dual compartment model3 to extract a whole brain Par-SF map (DTI Par-SF TORTOISE). Since each voxel within the Par-SF map contains the distribution of SF contribution from only parenchyma water, averaging the voxels from the whole brain Par-SF map measures the parenchymal signal fraction ratio with respect to the total brain volume. Linear regression was used to compare between BPF derived from each method and in addition, BPF from each method with UBDRS and Vineland-3 scores measured in CLN3 participants.Results and conclusions
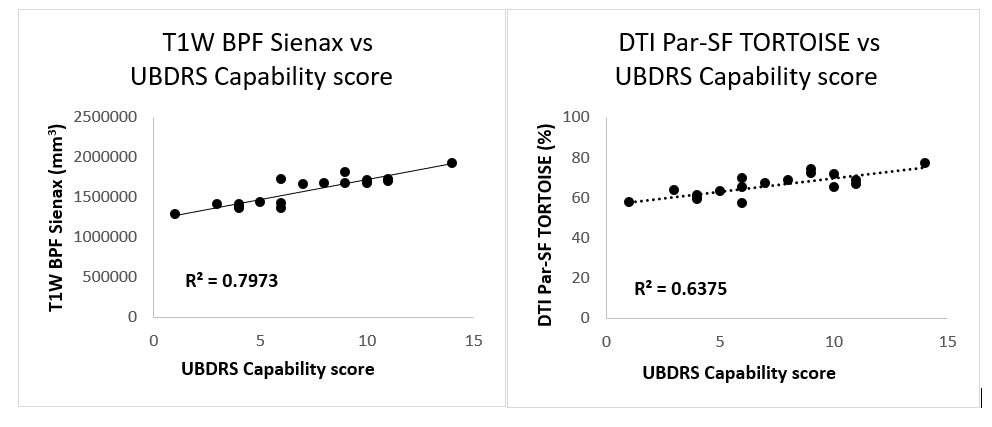
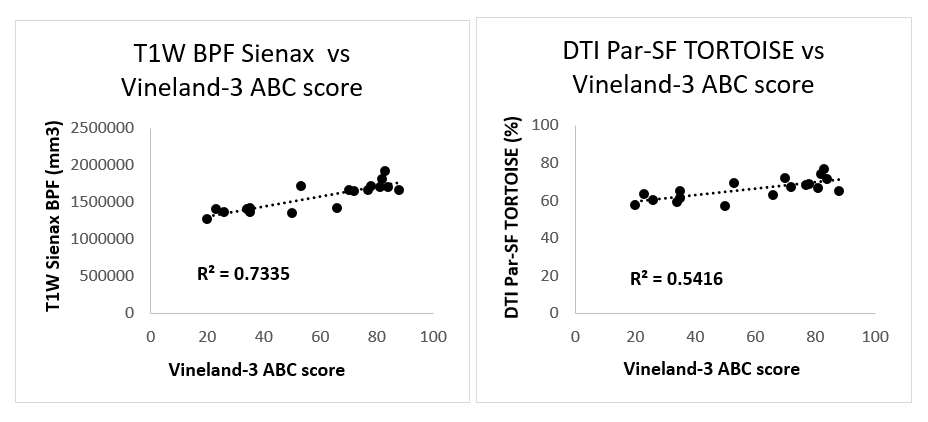
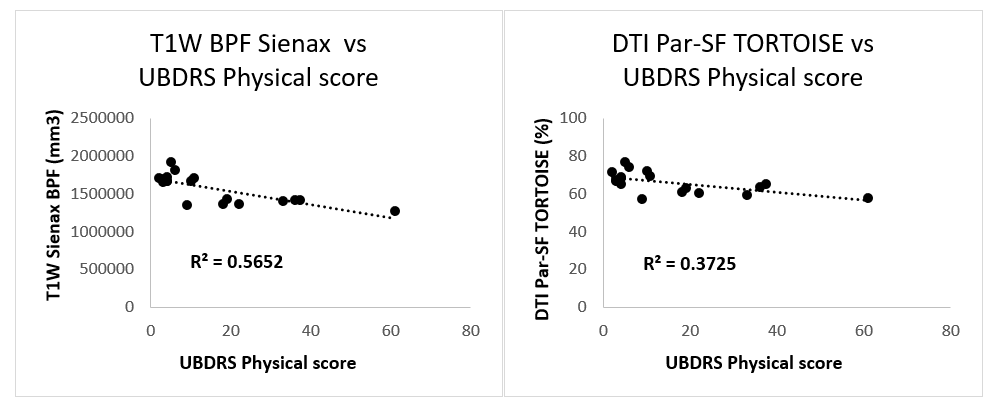
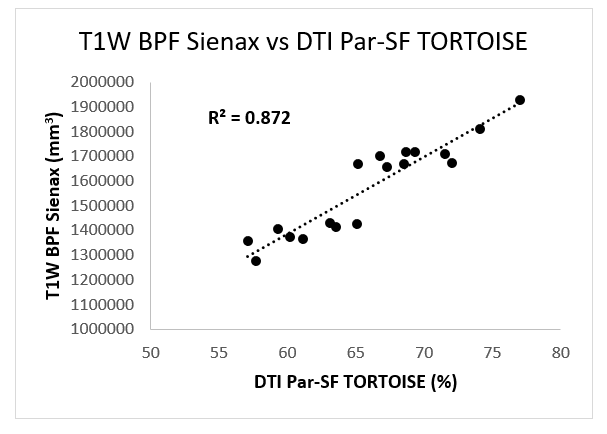
Our results show that: 1) There is a high to moderate correlation between T1W BPF Sienax (R2=0.79) and DTI Par-SF TORTOISE(R2=0.64) with UBDRS capability score (Fig1), and Vineland-3 ABC scores [T1W BPF Sienax (R2=0.73), DTI Par-SF TORTOISE (R2=0.54)] (Fig2). The UBDRS physical scores correlate less strongly with T1W BPF Sienax (R2=0.57) and DTI Par-SF TORTOISE (R2=0.37) (Fig3). 2) There is a high correlation between DTI Par-SF TORTOISE and T1W BPF Sienax (R2=0.87) (Fig4). From the results, we observe that a reduced global BPF or increased global brain atrophy associated correspondingly with changes in disease state (UBDRS physical and capability) and adaptive behavior (Vineland-3) in CLN3 participants. This observation is reproducible between measured BPF using two imaging modalities and software. The lower correlation between the measured global BPF and the UBDRS physical suggests that perhaps these scores need to be assessed using T1W BPF or DTI Par-SF measured from regions specific to motor function rather than global brain atrophy. While it is encouraging to observe that DTI Par-SF is comparably sensitive as T1W BPF in potentially measuring brain atrophy in these patients, we must consider that these measurements are calculated from approximations of brain parenchyma volume, and dependent on accurate classification of tissue into gray matter, white matter, and CSF. In addition, brain atrophy is measured with respect to TIV. T1W method of TIV estimation is less reliable due to the poor contrast between CSF and skull, while the estimation of TIV in DTI is dependent on the brain mask used in the tensor computation. Thus, we need to evaluate these findings with a more accurate measurement of TIV that is consistent between methods. Until then, we must consider the global atrophy measurements from T1W, with complimentary or confirmatory information from diffusion-based method, as proxy measures in evaluating neurodegenerative disease such as CLN3.Acknowledgements
No acknowledgement found.References
1. Camila Orellana PM, Hilkka Soininen, Daniel Ferreira a Bruno Vellas, Lars-Olof Wahlund, J.-Sebastian Muehlboeck, Magda Tsolaki, Simon Lovestone, Eric Westman, Andrew Simmons, Lars-Olof Wahlund, AddNeuronMed consortium and for the Alzheimer''s Disease Neuroimaging Initiative. Measuring Global Brain Atrophy with the Brain Volume/Cerebrospinal Fluid Index: Normative Values, Cut-Offs and Clinical Associations. Neuro-degenerative Diseases 2016.
2. R.A. Rudick MEF, PhD; J.-C. Lee, MS; J. Simon, MD, PhD; L. Jacobs, MD; and the Multiple Sclerosis Collaborative Research Group. Use of the brain parenchymal fraction to measure whole brain atrophy in relapsing-remitting MS. NEUROLOGY 1999.
3. C. Pierpaoli DKJ. Removing CSF Contamination in Brain DT-MRIs by Using a Two-Compartment Tensor Model. Proc Intl Soc Mag Reson Med 11 2004.
4. Autti TH, Hamalainen J, Mannerkoski M, Van Leemput KV, Aberg LE. JNCL patients show marked brain volume alterations on longitudinal MRI in adolescence. J Neurol 2008;255(8):1226-30. DOI: 10.1007/s00415-008-0891-x.
5. Hochstein JN, Schulz A, Nickel M, et al. Natural history of MRI brain volumes in patients with neuronal ceroid lipofuscinosis 3: a sensitive imaging biomarker. Neuroradiology 2022;64(10):2059-2067. DOI: 10.1007/s00234-022-02988-9.
6. Roine U, Roine TJ, Hakkarainen A, et al. Global and Widespread Local White Matter Abnormalities in Juvenile Neuronal Ceroid Lipofuscinosis. AJNR Am J Neuroradiol 2018;39(7):1349-1354. DOI: 10.3174/ajnr.A5687.
7. Tokola AM, Salli EK, Aberg LE, Autti TH. Hippocampal volumes in juvenile neuronal ceroid lipofuscinosis: a longitudinal magnetic resonance imaging study. Pediatr Neurol 2014;50(2):158-63. DOI: 10.1016/j.pediatrneurol.2013.10.013.
8. T. Autti JHmli, L.A˚ bergb, L. Lauronenc, J. Tyynela¨d and K. Van Leemputa. Thalami and corona radiata in juvenile NCL (CLN3): a voxel-based morphometric study. European Journal of Neurology 2007. DOI: 10.1111/j.1468-1331.2006.01692.x.
9. Wibbeler E, Nickel M, Schwering C, Schulz A, Mink JW. The Unified Batten Disease Rating Scale (UBDRS): Validation and reliability in an independent CLN3 disease sample. European Journal of Paediatric Neurology 2022;38:62-65. DOI: 10.1016/j.ejpn.2022.03.005.
10. Sparrow, S., Cicchetti, D., & Saulnier, C. (2016). Vineland adaptive behavior scales (3rd ed. (Vineland-3). Pearson.
11. Smith SM, Zhang Y, Jenkinson M, et al. Accurate, robust, and automated longitudinal and cross-sectional brain change analysis. Neuroimage 2002;17(1):479-89. DOI: 10.1006/nimg.2002.1040.
12. M. Okan Irfanoglu, Amritha Nayak, Elizabeth B. Hutchinson,Joelle Sarlls, Carlo Pierpaoli. DR-BUDDI: Diffeomorphic Registration for Blip Up-Down Diffusion Imaging. NeuroImage 2015.
13. C. Pierpaoli LW, M. O. Irfanoglu, A. Barnett, P. Basser, L-C. Chang, C. Koay, S. Pajevic, G. Rohde, J. Sarlls, and M. Wu. TORTOISE: an integrated software package for processing of diffusion MRI data ISMRM 18th annual meeting, Stockholm, Sweden 2010.
14. M. Okan Irfanoglu, Amritha Nayak, Jeffrey Jenkins,and Carlo Pierpaoli. TORTOISE v3: Improvements and New Features of the NIH Diffusion MRI Processing Pipeline. ISMRM 25th annual meeting, Honolulu, HI, abstract #3540 2018.
Figures