3597
Reliability of brain volume measurements on 3D-FLAIR is similar to 3D-T1 in multiple sclerosis1Radiology and nuclear medicine, MS Center Amsterdam, Radiology and Nuclear Medicine, Vrije Universiteit Amsterdam, Amsterdam Neuroscience, Amsterdam UMC location VUmc, Amsterdam, The Netherlands, Amsterdam, Netherlands, 2Anatomy and Neurosciences, MS Center Amsterdam, Anatomy and Neurosciences, Vrije Universiteit Amsterdam, Amsterdam Neuroscience, Amsterdam UMC location VUmc, Amsterdam, The Netherlands, Amsterdam, Netherlands, 3MS Center Amsterdam, Neurology, Vrije Universiteit Amsterdam, Amsterdam Neuroscience, Amsterdam UMC location VUmc, Amsterdam, The Netherlands, Amsterdam, Netherlands, 4Queen Square Institute of Neurology and Centre for Medical Image Computing, University College London, UK, London, United Kingdom
Synopsis
Keywords: Segmentation, Multiple Sclerosis
New methods have enabled segmentation on sequences other than T1 for brain volume measurements in multiple sclerosis (MS), such as those more readily available in clinic as FLAIR and PD. However, reliability studies have not been performed yet in MS, limiting their use. Here, we assessed within-scanner and between-scanner reliability of FLAIR segmentations in 30 people with MS on three different MR scanners. We found similar reliability compared to T1w scans, with high intra-scanner reliability but systematic differences between scanners. This suggests that within-scanner volume measurements of FLAIR are possible, but standardization is needed for between-scanner single patient measurements.Introduction
Studies have shown that brain atrophy measurements using magnetic resonance imaging (MRI) are a useful measure to assess disease progression in multiple sclerosis (MS)1-3. Automated brain segmentation techniques have generally been developed for 3D-T1-weighted (T1w) scans,4-7 given the superior contrast between gray and white matter compared to other sequences. However, clinical MS protocols do not always feature 3D-T1w imaging. In addition, the presence of lesions, and differences between scanner-vendor, field strength, acquisition protocol and analyses software all influence T1w segmentation performance4,8. Recently, brain volumetry has become possible on additional sequences. Two of these tools are Sequence Adaptive Multimodal SEGmentation (SAMSEG) and SynthSeg9,10. In recent work, it has been demonstrated that these methods could be used to segment on 3D-FLuid Attenuated Inversion Recovery (3D-FLAIR) images, which often are more frequently present in older research datasets and are a standard recommendation for clinical protocols in MS11, 12. Moreover, initial work has shown that associations between brain atrophy and disability were similar between 3D-T1w and 3D-FLAIR11. However, within-scanner repeatability and between-scanner reproducibility of 3D-FLAIR brain volumetry has not been compared to 3D-T1w before, which limits current use of this promising technique. The current study focusses on within-scanner repeatability and between-scanner reproducibility of FLAIR segmentation, comparing three different MR-scanners with varying field strength.Methods
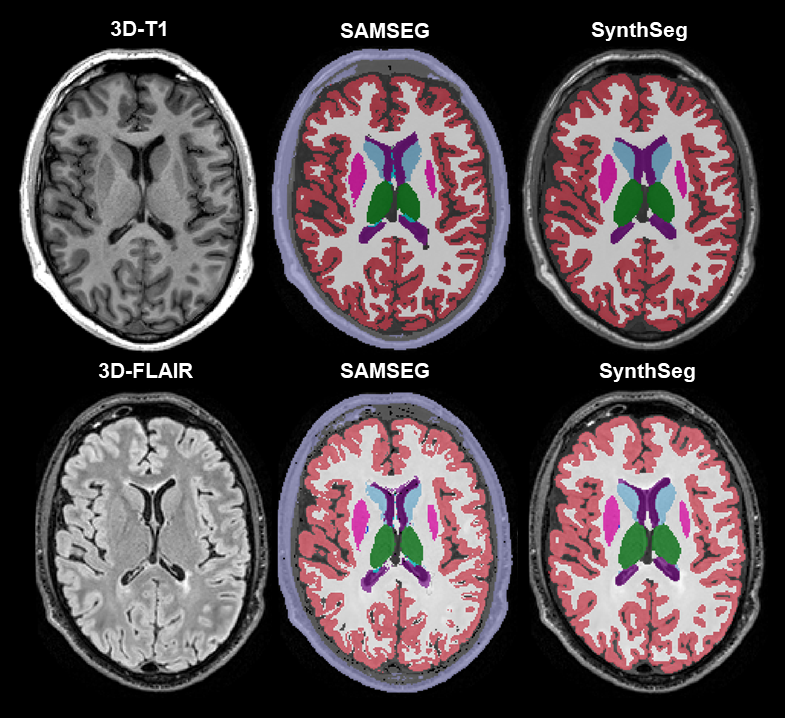
30 subjects with MS (relapsing remitting MS n=25; secondary progressive MS n=2; and primary progressive MS n=3), underwent a scan and immediate rescan on three MRI scanners (GE Discovery MR750 (3T), Siemens Sola (1.5T) and Siemens Vida (3T)) on the same day. Between the scan and rescan participants were asked to leave the scanner table and wait for a minute before performing the rescan. We acquired a 3D-FLAIR and 3D-T1w for all participants on each scanner consecutively. Locally optimized protocol were used, where attention was given to provide optimal gray-white matter contrast when developing the 3D-FLAIR protocols for the clinic (Table 1). Images were visually inspected for artifacts (e.g. motion and ghosting) at the time of scanning and were re-acquired if deemed necessary. Both T1w and FLAIR images were segmented with SynthSeg and SAMSEG using recommended settings (no preprocessing but with –pallidum-separate flag for the SAMSEG-FLAIR segmentation, Figure 1). Subsequently, whole brain, cortical, ventricular, deep gray matter (DGM) and thalamic volumes were obtained. We assessed within-scanner repeatability with the intra-class correlation coefficient (ICC) for absolute agreement and between-scanner reproducibility with the ICC for consistency for both 3D-FLAIR and 3D-T1w derrived volumes. These ICC-values were classified according to the existing standards13. Reproducibility was additionally assessed with a repeated measures ANOVA. If appropriate, post-hoc testing was performed using pairwise t-tests or Wilcoxon signed rank tests. Reported p-values are Bonferroni corrected.Results
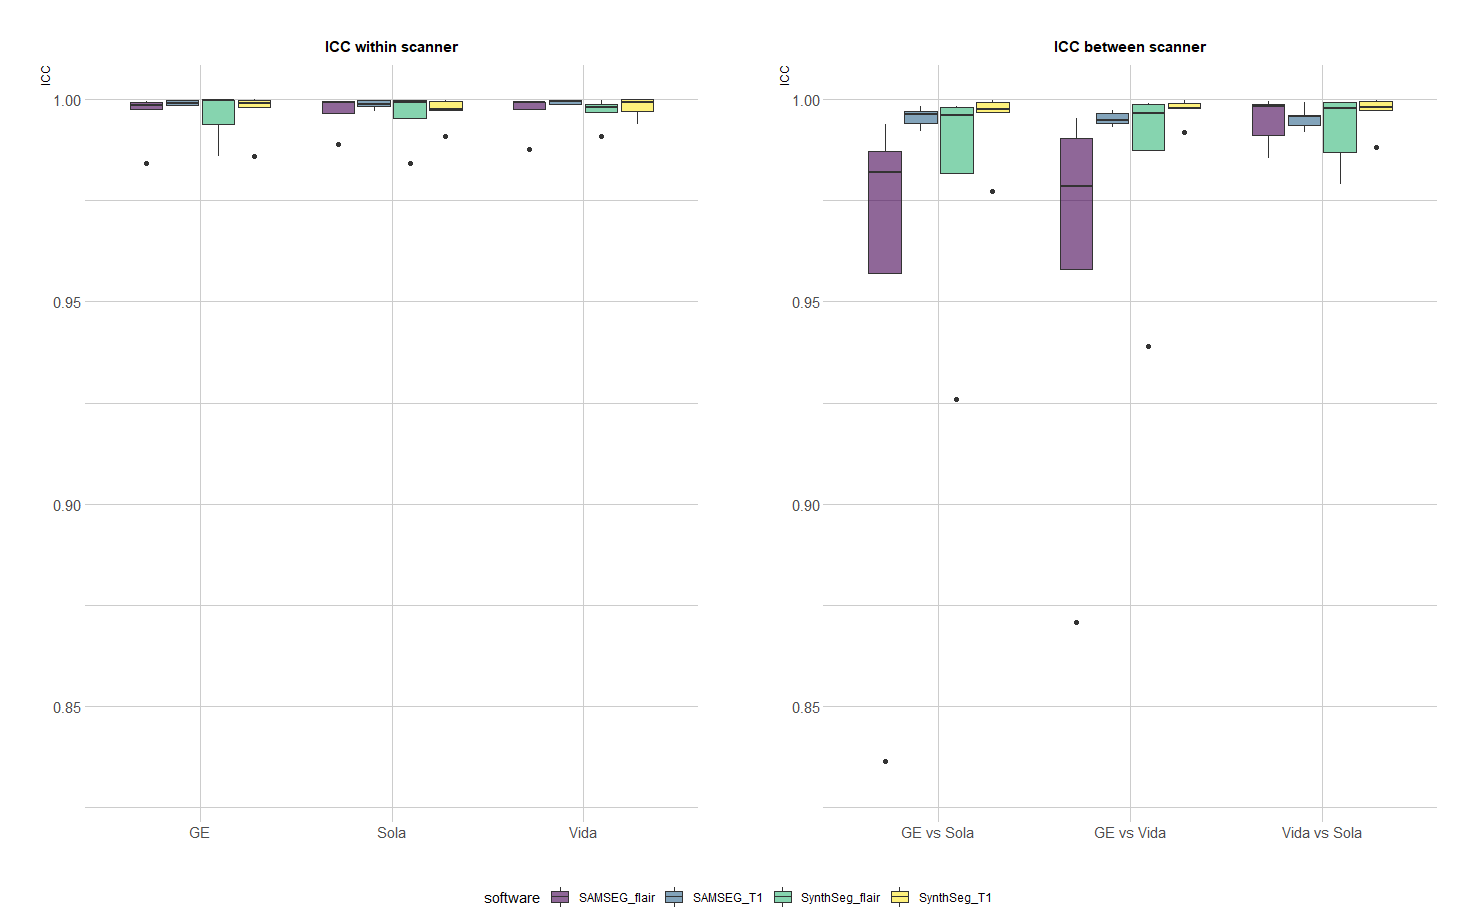
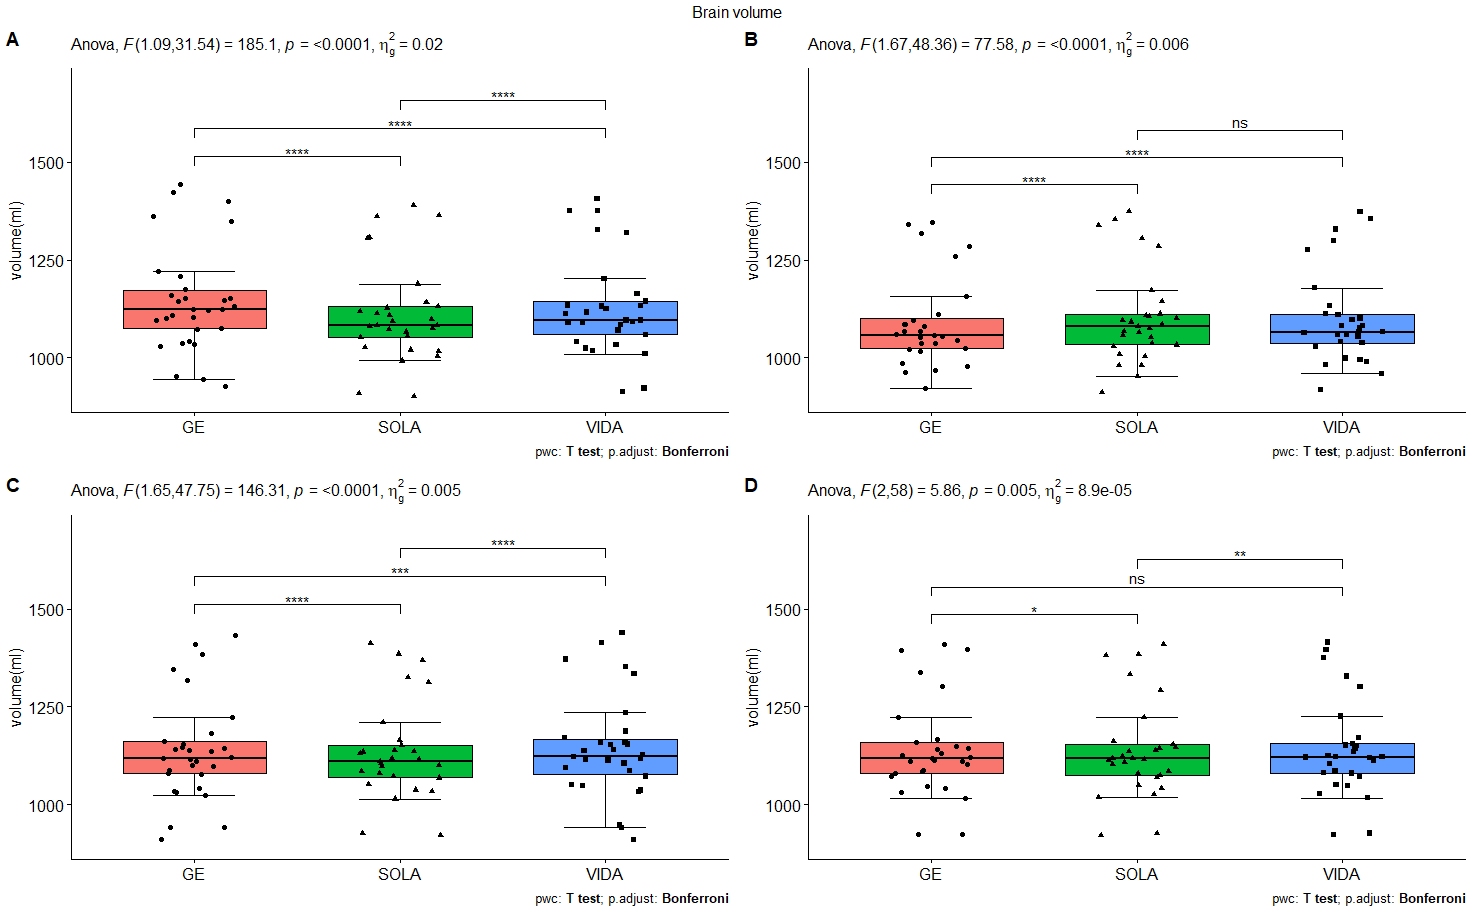
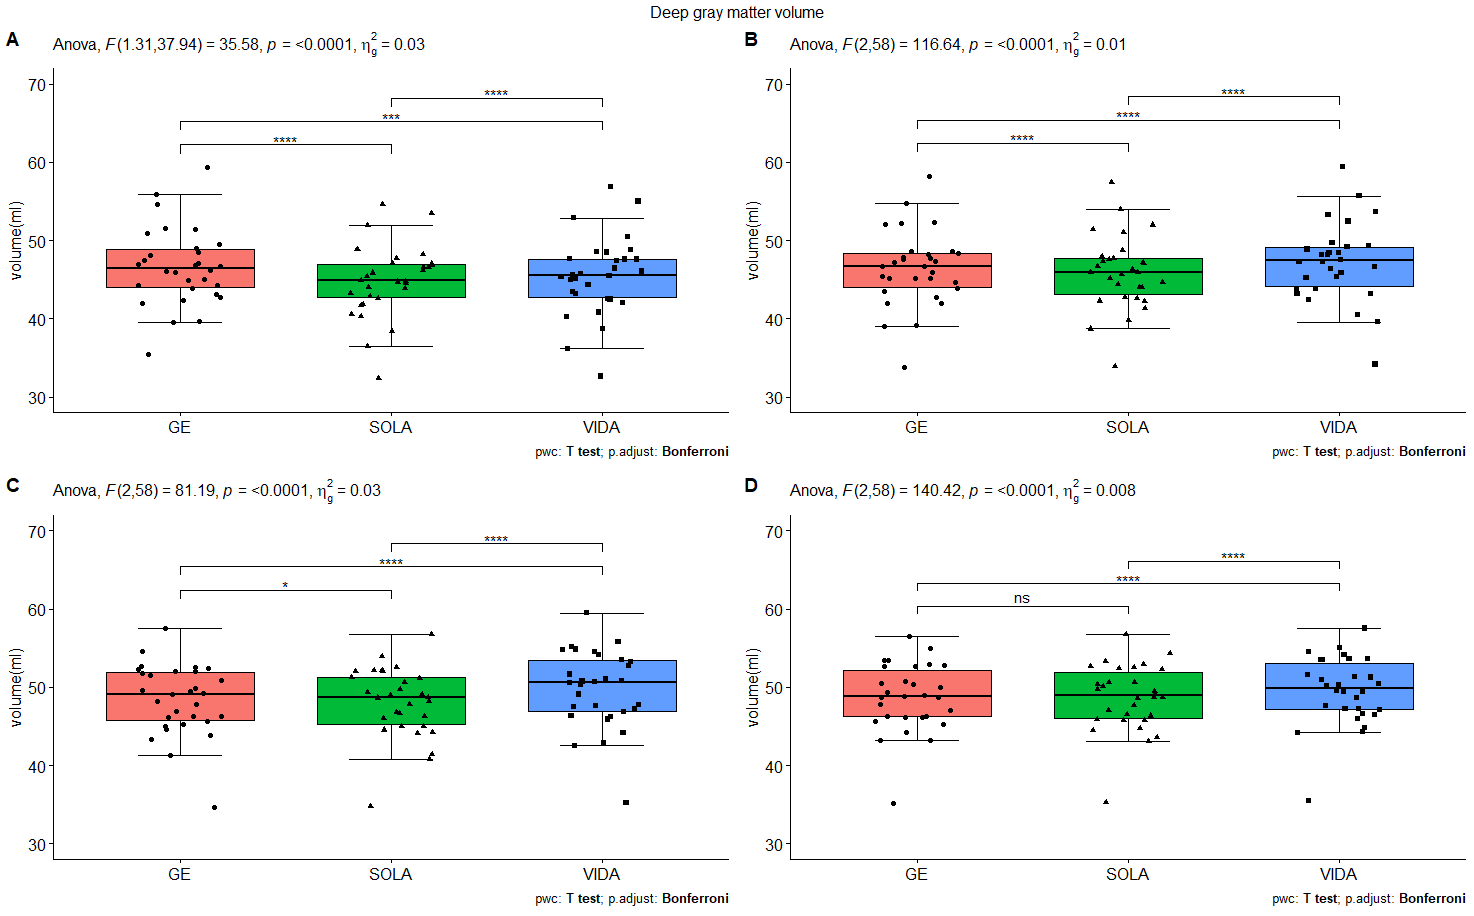
Within-scanner repeatability was excellent (ICC for absolute agreement>0.98) for all structures on both 3D-T1w and 3D-FLAIR and for both tools (Figure 2). In addition, the between-scanner ICC for consistency was good to excellent (>0.84) for both sequences and software packages. Lowest ICC scores (>0.84) were found for the thalamus for all software and scanners. However, similar to T1w brain volumetry (p<0.05), significant differences, depending on scanner comparison, were found for both software (Figure 3) for the FLAIR segmentation (p<0.001). Comparable results, dependent on sequence, software and scanner, were found for the other structures such as the DGM volume (Figure 4).Discussion
Here we compared the repeatability and reliability of 3D-FLAIR segmentation within and between three different MR-scanners with varying field strengths, using two freely available software packages. As expected, between-scanner reproducibility was lower compared to within scanner repeatability, but both indicated good to excellent agreement. However, similar to T1w scans, systematic difference were present for most structures between scanners. Given these systematic differences and the small yearly atrophy rates of MS patients, individual tracking of brain atrophy has to be performed on the same scanner14. Moreover, for multi-center and multi-scanner studies, scanner effects need to be accounted for brain volume measurements on both 3D-FLAIR and 3D-T1w scans. The slight difference in reliability between FLAIR and T1w scans could be due to a larger difference in resolution between the FLAIR scans compared to the T1w scans (T1w: all 1mm3 isotropic, FLAIR: between 1.0, 1.2 and 1.37mm slices). In this study there were no manual outlined segmentations to serve as a gold standard. There was no clear difference between the two software packages in ICC both within and between scanners. This is the first time within- and between-scanner has been quantified on 3D-FLAIR scans, although, our main findings are similar and consistent with previous studies in MS which were performed on 3D-T1 only15-17.Conclusion
FLAIR-based brain volume measurements demonstrate similar reliability compared to T1w segmentation. As systematic difference between scanners were present for and comparable between both sequences, the need for standardization within studies remains crucial.Acknowledgements
No acknowledgement found.References
1. Andravizou, A., et al., Brain atrophy in multiple sclerosis: mechanisms, clinical relevance and treatment options. Autoimmunity Highlights, 2019. 10(1): p. 7.
2. Liu, Y., et al., Different patterns of longitudinal brain and spinal cord changes and their associations with disability progression in NMO and MS. Eur Radiol, 2018. 28(1): p. 96-103.
3. Cagol, A., et al., Association of Brain Atrophy With Disease Progression Independent of Relapse Activity in Patients With Relapsing Multiple Sclerosis. JAMA Neurology, 2022.
4. Amiri, H., et al., Urgent challenges in quantification and interpretation of brain grey matter atrophy in individual MS patients using MRI. Neuroimage Clin, 2018. 19: p. 466-475.
5. Dale, A.M., B. Fischl, and M.I. Sereno, Cortical surface-based analysis. I. Segmentation and surface reconstruction. Neuroimage, 1999. 9(2): p. 179-94.
6. Fischl, B., M.I. Sereno, and A.M. Dale, Cortical surface-based analysis. II: Inflation, flattening, and a surface-based coordinate system. Neuroimage, 1999. 9(2): p. 195-207.
7. Smith, S.M., et al., Accurate, robust, and automated longitudinal and cross-sectional brain change analysis. Neuroimage, 2002. 17(1): p. 479-89.
8. Guo, C., et al., Repeatability and reproducibility of FreeSurfer, FSL-SIENAX and SPM brain volumetric measurements and the effect of lesion filling in multiple sclerosis. European Radiology, 2019. 29(3): p. 1355-1364.
9. Billot, B., et al., SynthSeg: Domain Randomisation for Segmentation of Brain MRI Scans of any Contrast and Resolution. arXiv e-prints, 2021: p. arXiv: 2107.09559.
10. Puonti, O., J.E. Iglesias, and K. Van Leemput, Fast and sequence-adaptive whole-brain segmentation using parametric Bayesian modeling. NeuroImage, 2016. 143: p. 235-249.
11. Noteboom, S., Steenwijk, M.D., Nederpelt, van, D.R., Strijbis, E.M.M., Moraal, B., Barkhof F., Geurts, J.J.G., Caan, M.W.A., Vrenken H., Schoonheim, M.M., Brain tissue segmentation on 3D-FLAIR weighted images in multiple sclerosis. 2022, Annual Meeting International Society for Magnetic Resonance in Medicine: London, United Kingdom. p. 886.
12. Wattjes, M.P., et al., 2021 MAGNIMS-CMSC-NAIMS consensus recommendations on the use of MRI in patients with multiple sclerosis. Lancet Neurol, 2021. 20(8): p. 653-670.
13. Koo, T.K. and M.Y. Li, A Guideline of Selecting and Reporting Intraclass Correlation Coefficients for Reliability Research. J Chiropr Med, 2016. 15(2): p. 155-63.
14. De Stefano, N., et al., Establishing pathological cut-offs of brain atrophy rates in multiple sclerosis. Journal of Neurology, Neurosurgery & Psychiatry, 2016. 87(1): p. 93-99.
15. Guo, C., et al., Repeatability and reproducibility of FreeSurfer, FSL-SIENAX and SPM brain volumetric measurements and the effect of lesion filling in multiple sclerosis. Eur Radiol, 2019. 29(3): p. 1355-1364.
16. Biberacher, V., et al., Intra- and interscanner variability of magnetic resonance imaging based volumetry in multiple sclerosis. NeuroImage, 2016. 142: p. 188-197.
17. Nederpelt, v., D.R., Amiri, H., Mariyampillai, A., Brouwer, I., Noteboom, S., Barkhof, F., Kuijer, J.P.A., Vrenken, H. , Cross-sectional robustness of 6 freely available software packages for brain volume measurements in multiple sclerosis 2020, Annual Meeting International Society for Magnetic Resonance in Medicine: London, United Kingdom. p. 2229.
Figures
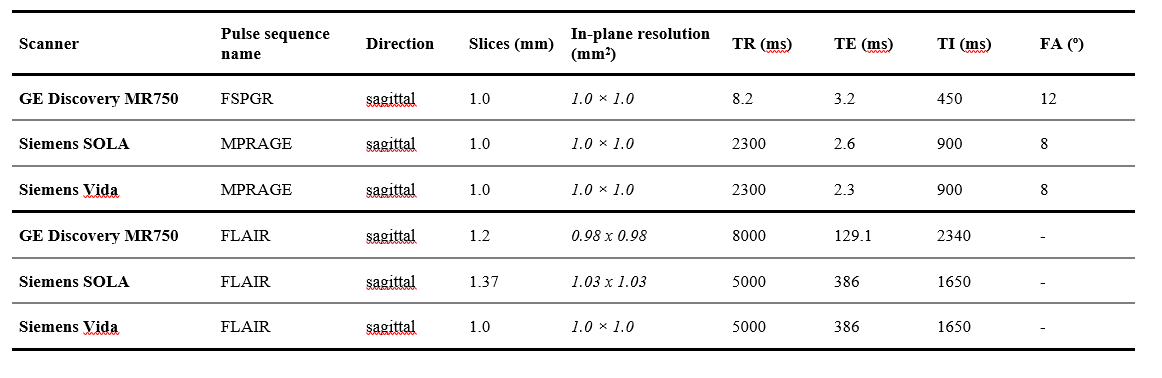
Table 1. MRI acquisition parameters: FSPGR=Fast SPoiled GRadient Echo, MPRAGE=Magnetization Prepared RApid Gradient Echo, FLAIR=FLuid Attenuated Inversion Recovery, TR = Repetition Time, TE = Echo Time, TI = Inversion Time, FA=Flip Angle