3595
Validation of a Semi-Automated Method to Quantify Lesion Volume Changes in Multiple Sclerosis Using Subtraction Images
Rozemarijn M. Mattiesing1, Serena Stel1, Alysha S. Mangroe1, Iman Brouwer1, Adriaan Versteeg1, Ronald A. van Schijndel1, Bernard M.J. Uitdehaag2, Frederik Barkhof1,3, Hugo Vrenken1, and Joost P.A. Kuijer1
1MS Center Amsterdam, Radiology and Nuclear Medicine, Amsterdam Neuroscience, Amsterdam UMC location VUmc, Amsterdam, Netherlands, 2MS Center Amsterdam, Neurology, Amsterdam Neuroscience, Amsterdam UMC location VUmc, Amsterdam, Netherlands, 3UCL London, Institutes of Neurology and Healthcare Engineering, London, United Kingdom
1MS Center Amsterdam, Radiology and Nuclear Medicine, Amsterdam Neuroscience, Amsterdam UMC location VUmc, Amsterdam, Netherlands, 2MS Center Amsterdam, Neurology, Amsterdam Neuroscience, Amsterdam UMC location VUmc, Amsterdam, Netherlands, 3UCL London, Institutes of Neurology and Healthcare Engineering, London, United Kingdom
Synopsis
Keywords: Segmentation, Multiple Sclerosis
Monitoring changes in white matter lesions with MRI is important to evaluate the effects of treatment in multiple sclerosis. In this study a validation of a semi-automated method to quantify lesion volume changes based on 2D proton-density-weighted images and image subtraction was performed. With this method new and enlarging but also disappearing and shrinking lesion activity can be quantified. As assessed with the intraclass correlation coefficient for absolute agreement, we found that the reproducibility was excellent and the accuracy was good overall. This semi-automated subtraction method can reliably quantify lesion volume changes in patients with (early) multiple sclerosis.Introduction
The detection and quantification of changes in white matter lesions in the brain is important to monitor the effects of treatment in patients with multiple sclerosis1. Performing this manually is a labor intensive process but existing automatic tools predominantly require FLAIR images as input, or only focus on new/enlarging activity2. To be able to obtain more sensitive quantitative information when advanced imaging is unavailable, we developed and validated a semi-automated method to quantify such lesion volume changes on the basis of 2D proton-density (PD)-weighted images and image subtraction. This semi-automated method provides insight in the whole spectrum of changes, both “positive” activity (defined as new and enlarging lesions) and “negative” activity (disappearing and shrinking lesions).Methods
Yearly MRI scans with a maximum follow-up period of 5 years from a clinical trial dataset of patients with early multiple sclerosis were used. Two PD-weighted images were normalized, registered to a common halfway-space, intensity-matched, and subsequently subtracted to create a subtraction image (Figure 1). Within manual lesion masks, lesion volume change was quantified using a subtraction intensity threshold on a Z-score map (Figure 2). Total lesion volume change was calculated by subtracting the sum of negative activity (disappearing + shrinking) from the positive activity (new + enlarging). Reproducibility was measured by assessing transitivity, specifically, we calculated the intraclass correlation coefficient for the absolute agreement (ICCtrans) and the difference (Δtrans) between the direct one-step and indirect multi-step measurements of total lesion volume change between two visits. Accuracy was assessed by calculating both the intraclass correlation coefficient for absolute agreement (ICCacc) and the difference (Δacc) between the one-step semi-automated total lesion volume change and manually measured lesion volume change (numerical difference) between two visits. Spearman’s correlations (ρ) were used to assess the relation of global and central atrophy, manually measured PD/T2 lesion volume, and lesion volume change with the method’s performance as reflected by the difference measures |Δtrans| and Δacc. For all analyses p < 0.05 was considered significant.Results
The semi-automated method showed an excellent reproducibility with ICCtrans values ranging from 0.90 to 0.96. Accuracy was good overall, with ICCacc values ranging from 0.67 to 0.86 (Figure 3). The standard deviation of Δtrans ranged from 0.25 to 0.86 mL. The mean of Δacc ranged from 0.11 to 0.37 mL and was significantly different from zero. Both global and central atrophy significantly correlated with lower reproducibility (correlation of |Δtrans| with global atrophy, ρ = −0.19 to −0.28, and correlation of |Δtrans| with central atrophy, ρ = 0.22 to 0.34). There was generally no significant correlation between global/central atrophy and accuracy. Higher lesion volume was significantly correlated with lower reproducibility (ρ = 0.62). Higher lesion volume change correlated with lower reproducibility (ρ = 0.22) and lower accuracy (correlation of Δacc with lesion volume change, ρ = −0.52).Discussion
The semi-automated method to quantify lesion volume changes has excellent reproducibility and overall good accuracy. The total lesion volume change as quantified by the semi-automated method is systematically higher than the manually measured lesion volume change. The amount of atrophy and especially lesion volume (change) should be taken into account when applying this method, as an increase in these variables might affect the quality of the results.Conclusion
Overall, the semi-automated subtraction method allows a valid and reliable quantitative investigation of lesion volume changes over time in (early) multiple sclerosis for follow-up periods up to 5 years.Acknowledgements
RMM has received research support from Merck KGaA, Darmstadt, Germany. IB has received research support from Merck, Novartis, Teva, and the Dutch MS Research Foundation. BMJU reports research support and/or consultancy fees from Biogen Idec, Genzyme, Merck Serono, Novartis, Roche, Teva, and Immunic Therapeutics. FB is supported by the NIHR Biomedical Research Centre at UCLH and is a consultant to Biogen, Combinostics, IXICO, Merck, and Roche. HV has received research support from Merck, Novartis, Pfizer, and Teva, consulting fees from Merck, and speaker honoraria from Novartis; all funds were paid to his institution. SS, ASM, AV, RAvS, and JPAK have nothing to disclose.References
1. Inglese M, Grossman RI, Filippi M. Magnetic resonance imaging monitoring of multiple sclerosis lesion evolution. J Neuroimaging. 2005;15(4 Suppl):22S-29S.2. Lladó X, Ganiler O, Oliver A, et al. Automated detection of multiple sclerosis lesions in serial brain MRI. Neuroradiology. 2012;54(8):787-807.
Figures
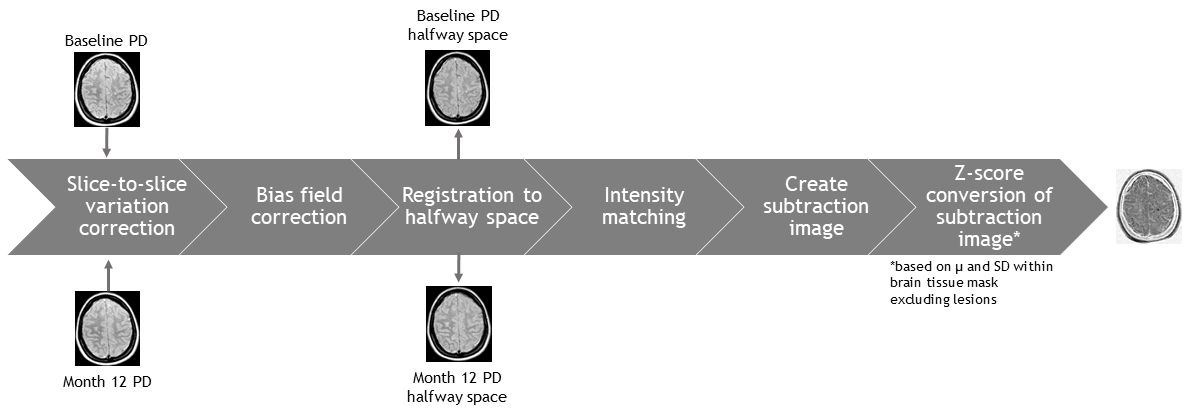
Figure 1. Schematized depiction of the processing pipeline of the semi-automated
method.
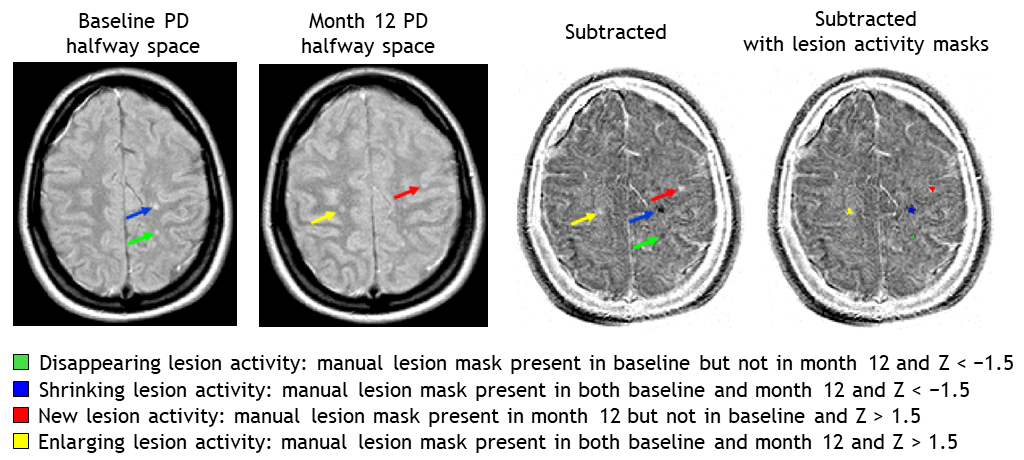
Figure 2. Quantification of
different categories of lesion change based on manual lesion masks and the
subtraction image converted in Z-scores.
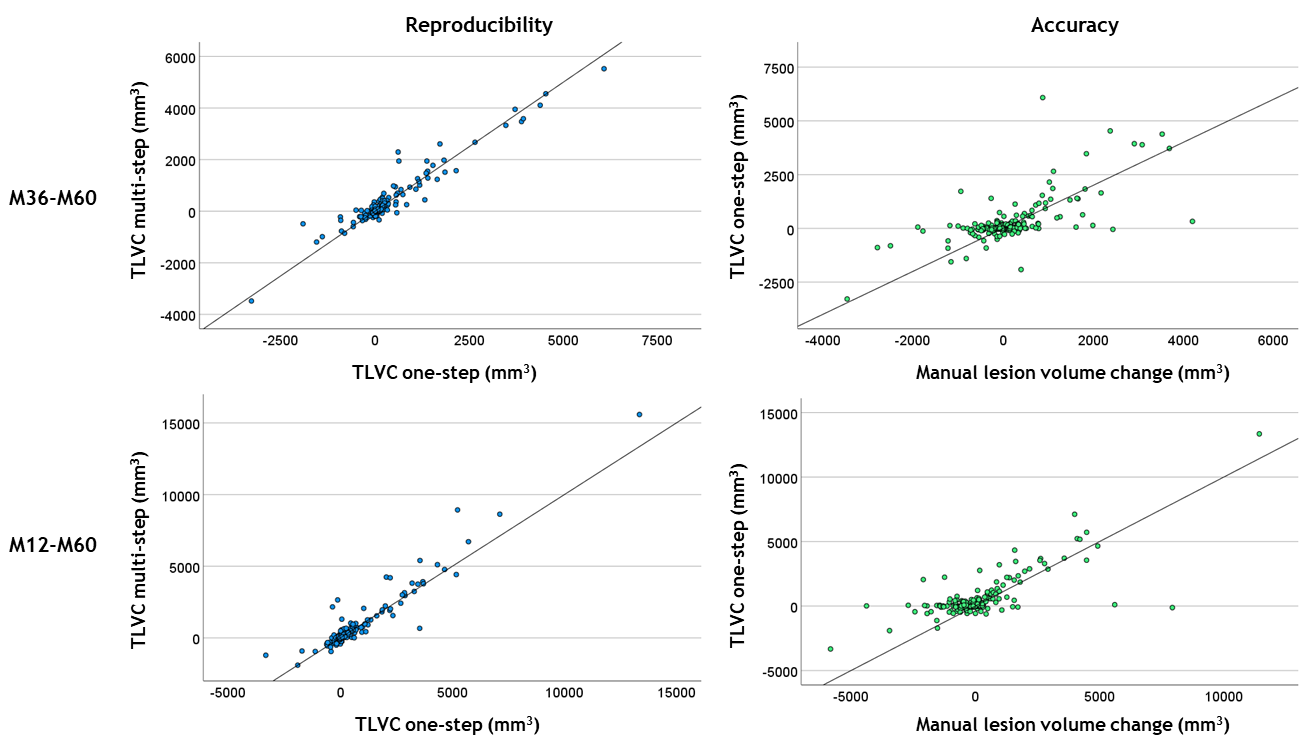
Figure 3. Scatterplots
showing the agreement between the one-step and multi-step measurements of total
lesion volume change (TLVC; in mm3) as an indication of
reproducibility in the two-yearly interval month 36-month 60 (M36-M60; top
left) and four-yearly interval month 12-month 60 (M12-M60; bottom left). The
agreement between the one-step semi-automated measurement and manually measured
lesion volume change (in mm3) as an indication of accuracy is also
shown for the same intervals (top and bottom right). Identity lines, reflecting
perfect agreement, are shown for reference.
DOI: https://doi.org/10.58530/2023/3595