3593
Imaging The Thalamic Reticular Nucleus at 7T1University of Nottingham, Nottingham, United Kingdom, 2Physics, University of Nottingham, Nottingham, United Kingdom
Synopsis
Keywords: Segmentation, Contrast Mechanisms, Thalamus
The Thalamic Reticular Nucleus is a micro-structure surrounding the dorsal edge of the thalamus that is of fundamental significance to understanding many neurological disorders in the brain. Here we present methods to visualise the TRN using various imaging modalities to explore different sources of contrast at the edge of the thalamus.Introduction
The thalamus is the start point for sensory information entering the brain. Any signal passing from thalamus to cortex or vice-versa also branches to the Thalamic Reticular Nucleus (TRN), a thin sheet of inhibitory GABAergic cells which covers the dorsal edge of the thalamus. The activity of the TRN is linked to both responsiveness during sleep and attention during wakefulness. As such the study of TRN activity in-vivo is of fundamental interest as well as being relevant to the study of several common neurological and psychiatric disorders, including schizophrenia and epilepsy.Unlike most internal thalamic nuclei there is no robust segmentation technique for exploring structural and functional features of the TRN in-vivo. This is due in part to the fact that it is around 2-4mm in thickness and has a complex structure of many crossing neurones connecting the thalamus to the rest of the brain. The advantage of UHF imaging is an increase in spatial resolution, SNR and CNR which if utilised effectively may overcome the difficulties faced in imaging the TRN.
Here different sources of MR contrast are explored through a variety of imaging modalities to investigate the best route for reliable imaging of the TRN in humans.
Method
T1, T2 and T2* weighted contrasts were explored in an attempt to image the TRN, including MPRAGE, Fast Low Angle Shot (FLASH) imaging, Fast Spin Echo (FSE), Phase Sensitive Inversion Recovery (PSIR) and Inversion Recovery Turbo Spin Echo (IR TSE). 12 subjects were scanned in total on a Philips Achieva 7T scanner with the sequences acquired, and imaging parameters modified, between sessions to optimise the contrast between the TRN and surrounding structures. Post processing methods to produce T1 maps and Susceptibility weighted Images (SWI) were also explored.The contribution of T1 to contrast at the TRN was explored using the IR-TSE scan. In a single session six IR-TSE images were acquired for TI= 100, 250, 500, 1000, 2500 and 4750 ms with TR fixed at 15000ms. The data was fitted to a simple inversion recovery allowing for incomplete inversion (and taking account of signals) to give an approximate T1 curve.
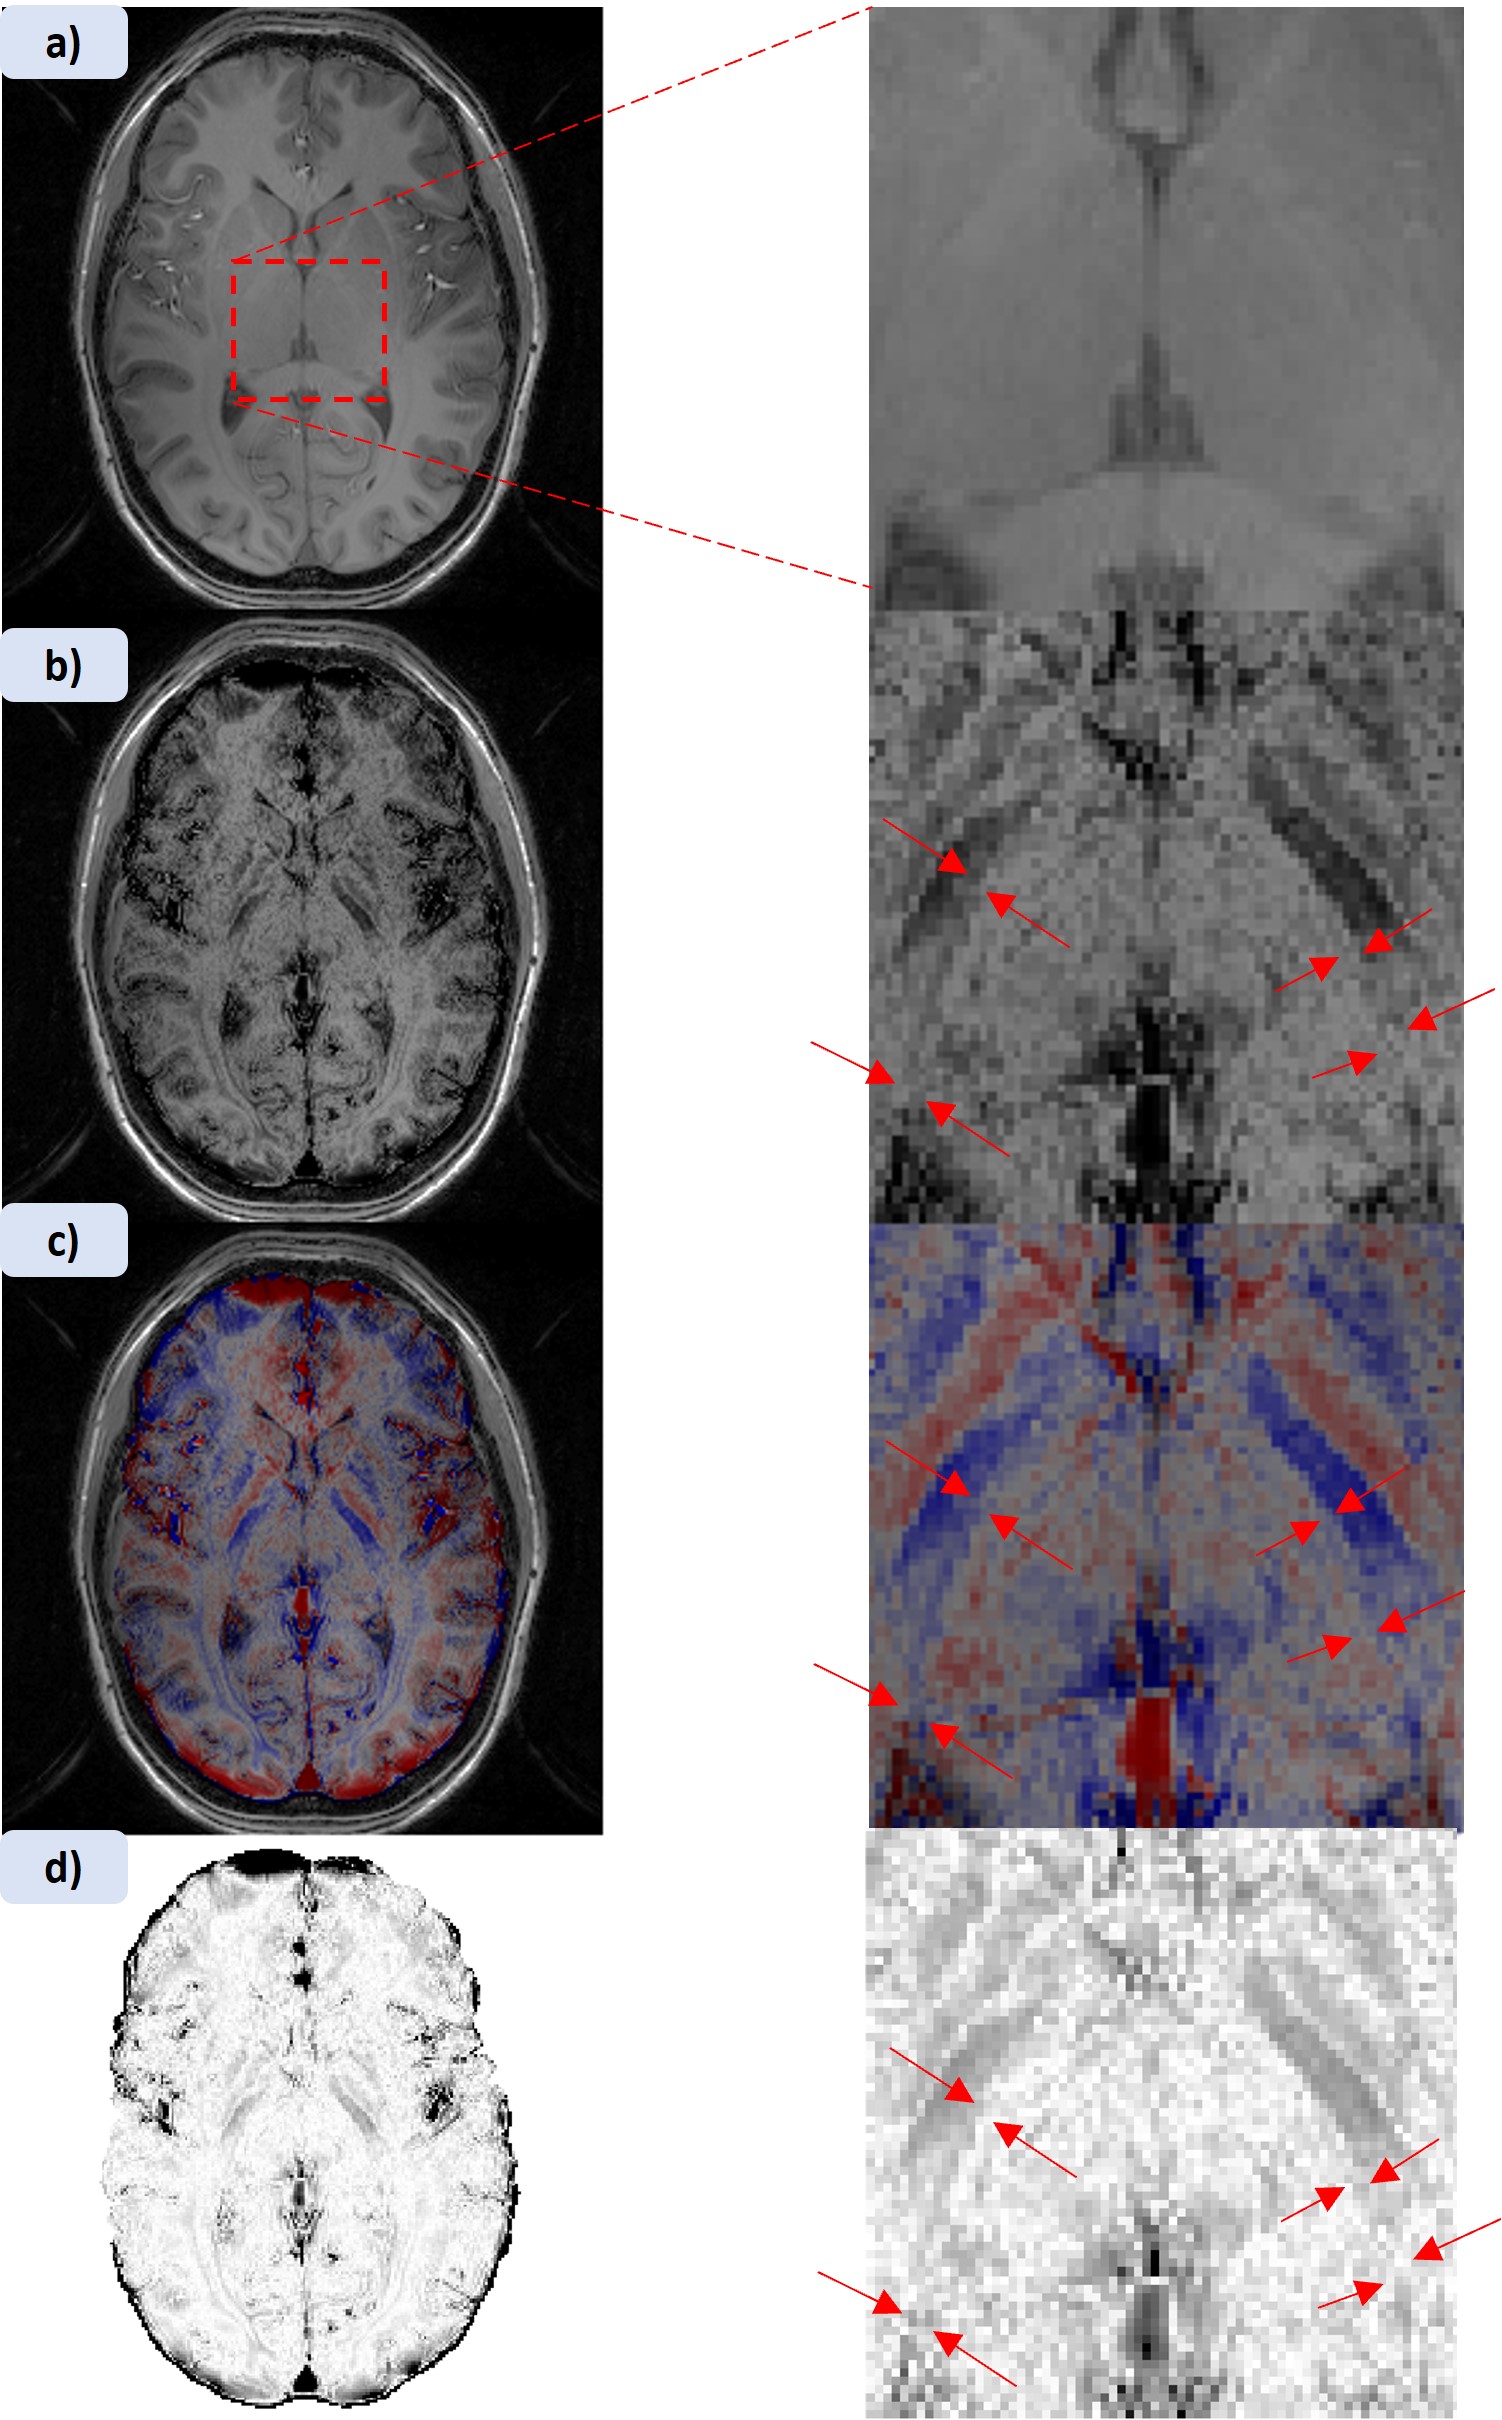
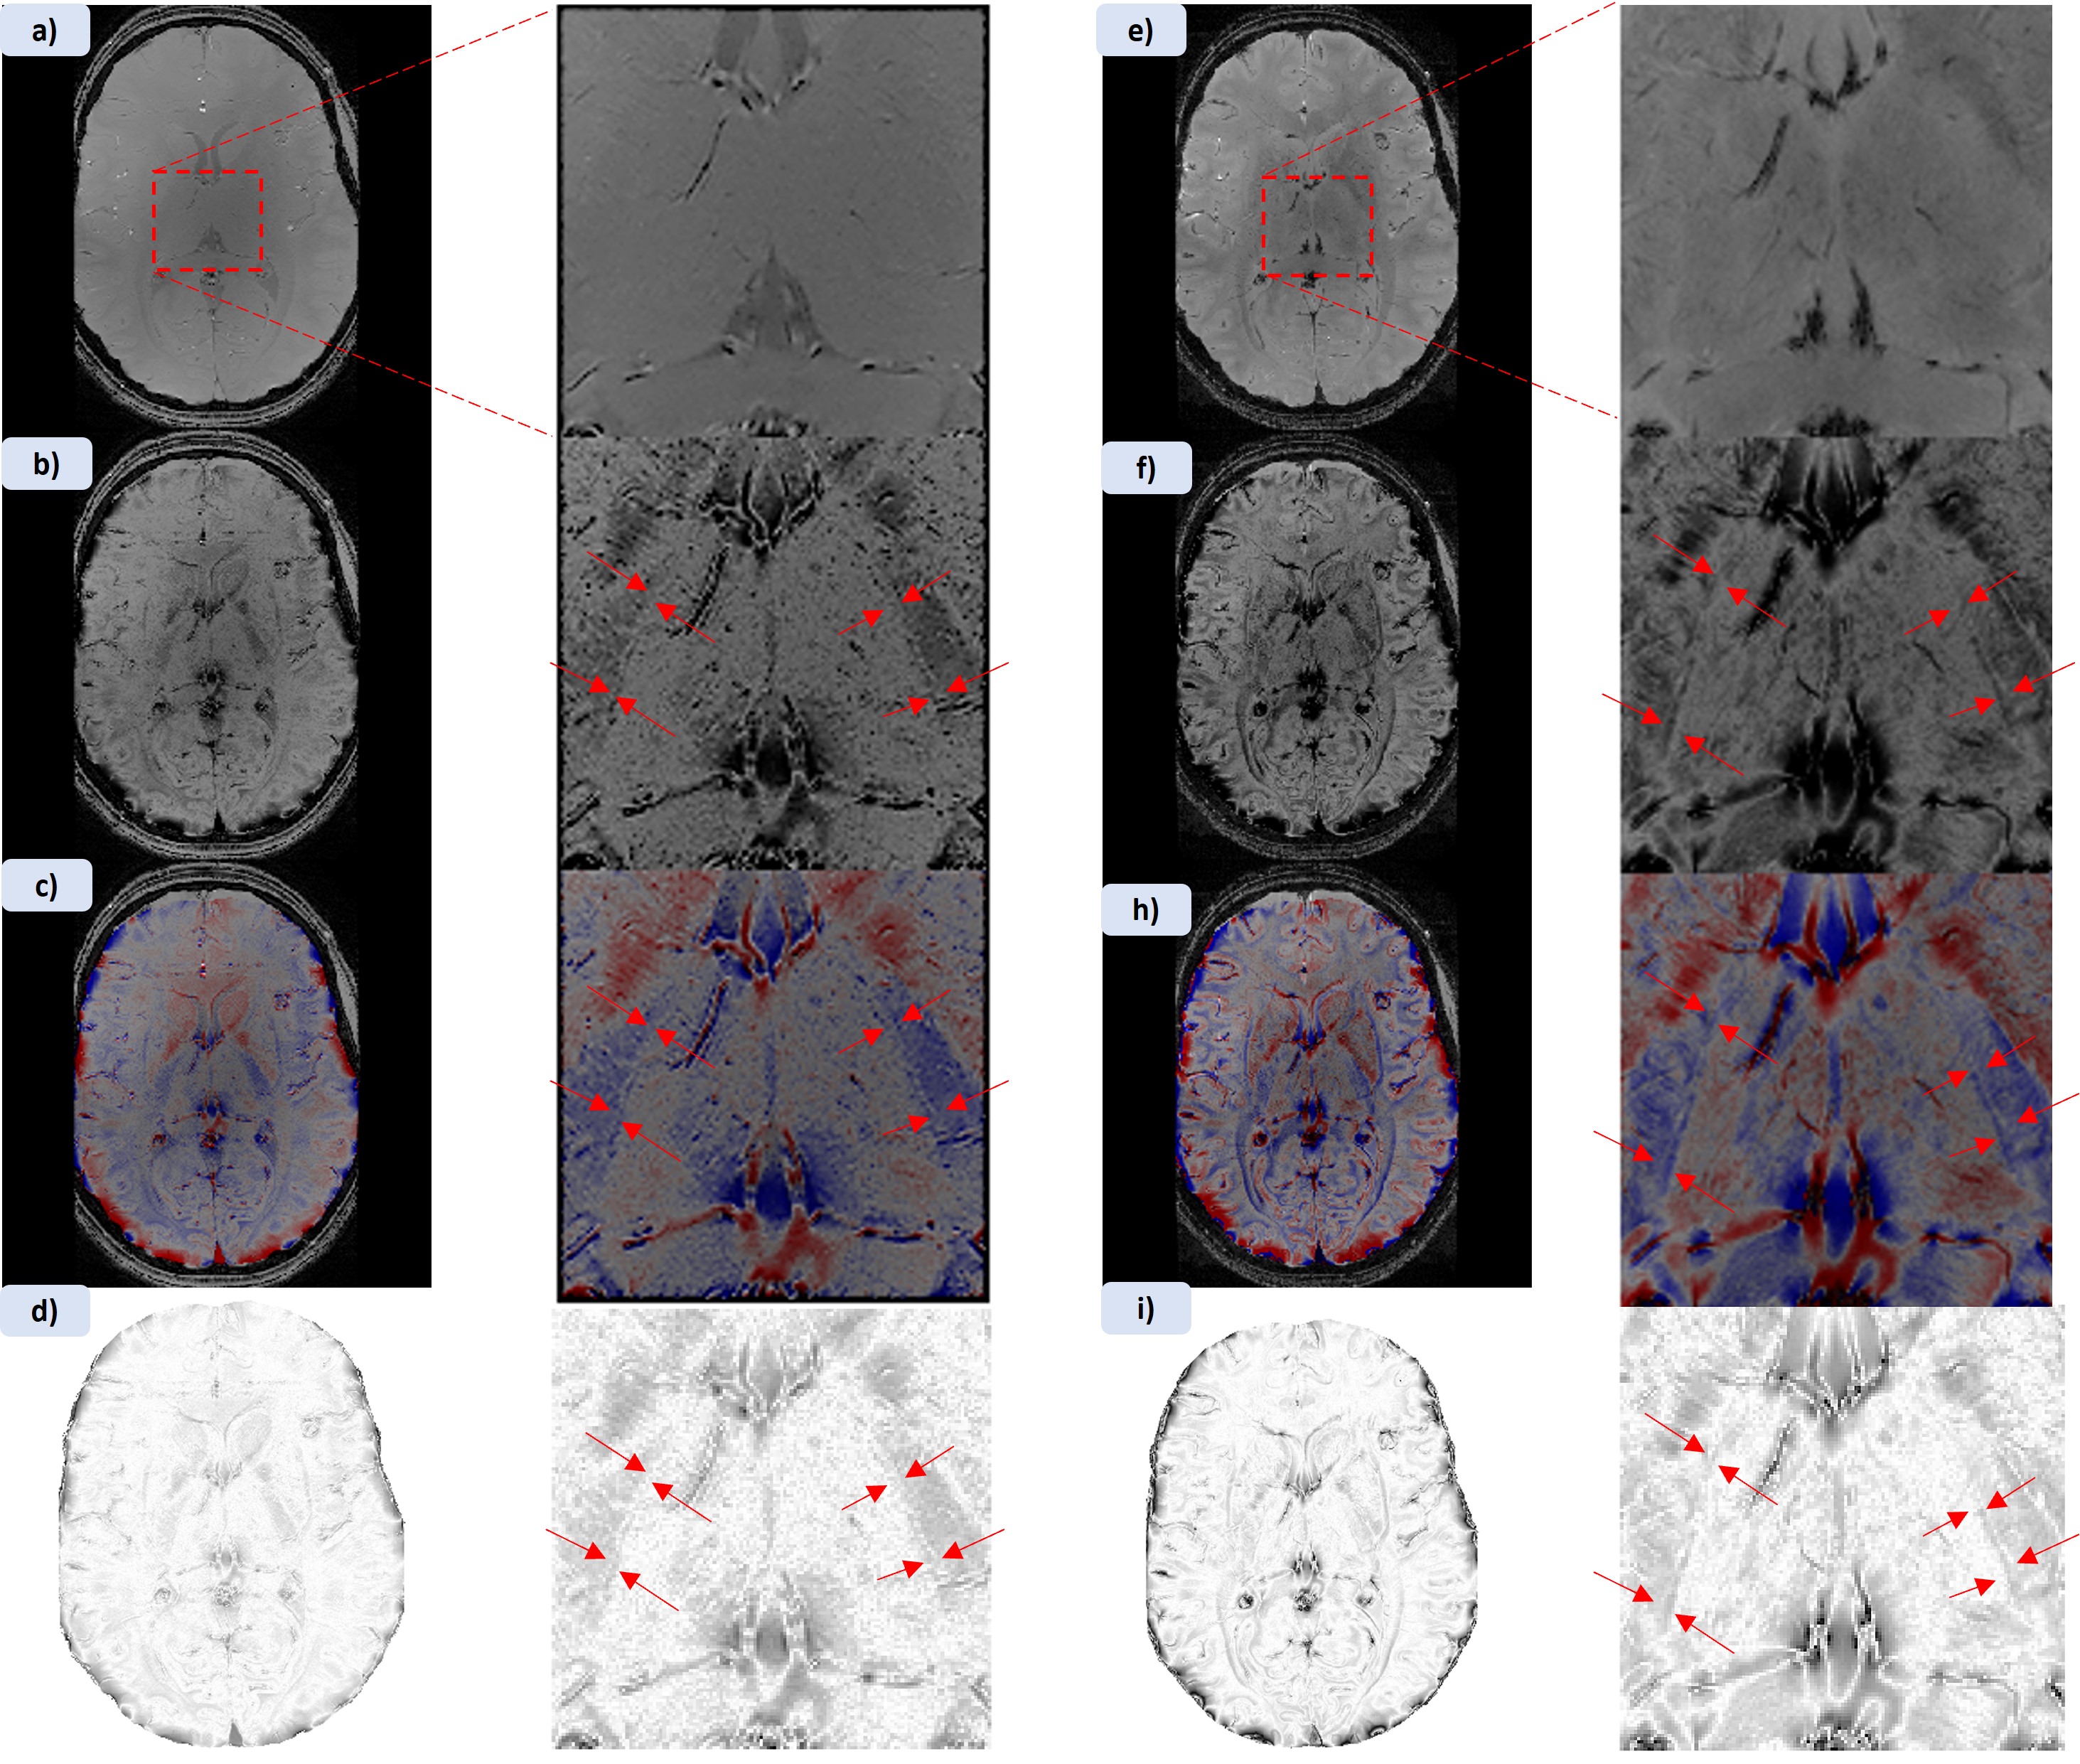
The FLASH and MPRAGE images were processed using a bespoke SWI pipeline. SWI combines a high pass filtered phase map with the corresponding magnitude T2* weighted image, to enhance the effects of susceptibility variations in T2* and phase data. These images are produced from the low pass filtered phase and magnitude by a simple multiplication as shown in equation 1,
$$inverted SWI = Mag*filtered phase mask^{num}$$
where 'num' is a multiplier to increase the weighting of the phase mask to control how heavily it is applied to the magnitude data. For a right-handed reconstruction such as that used by Philips scanners, images yield a positive phase in white-matter regions with low iron content and negative phase in structures with higher iron content like deep grey matter. Further contrast beyond standard SWI can be achieved by separating out the positive and negative phase contributions such that boundaries between tissues with different underlying contributions to the tissue susceptibility are enhanced.
Results
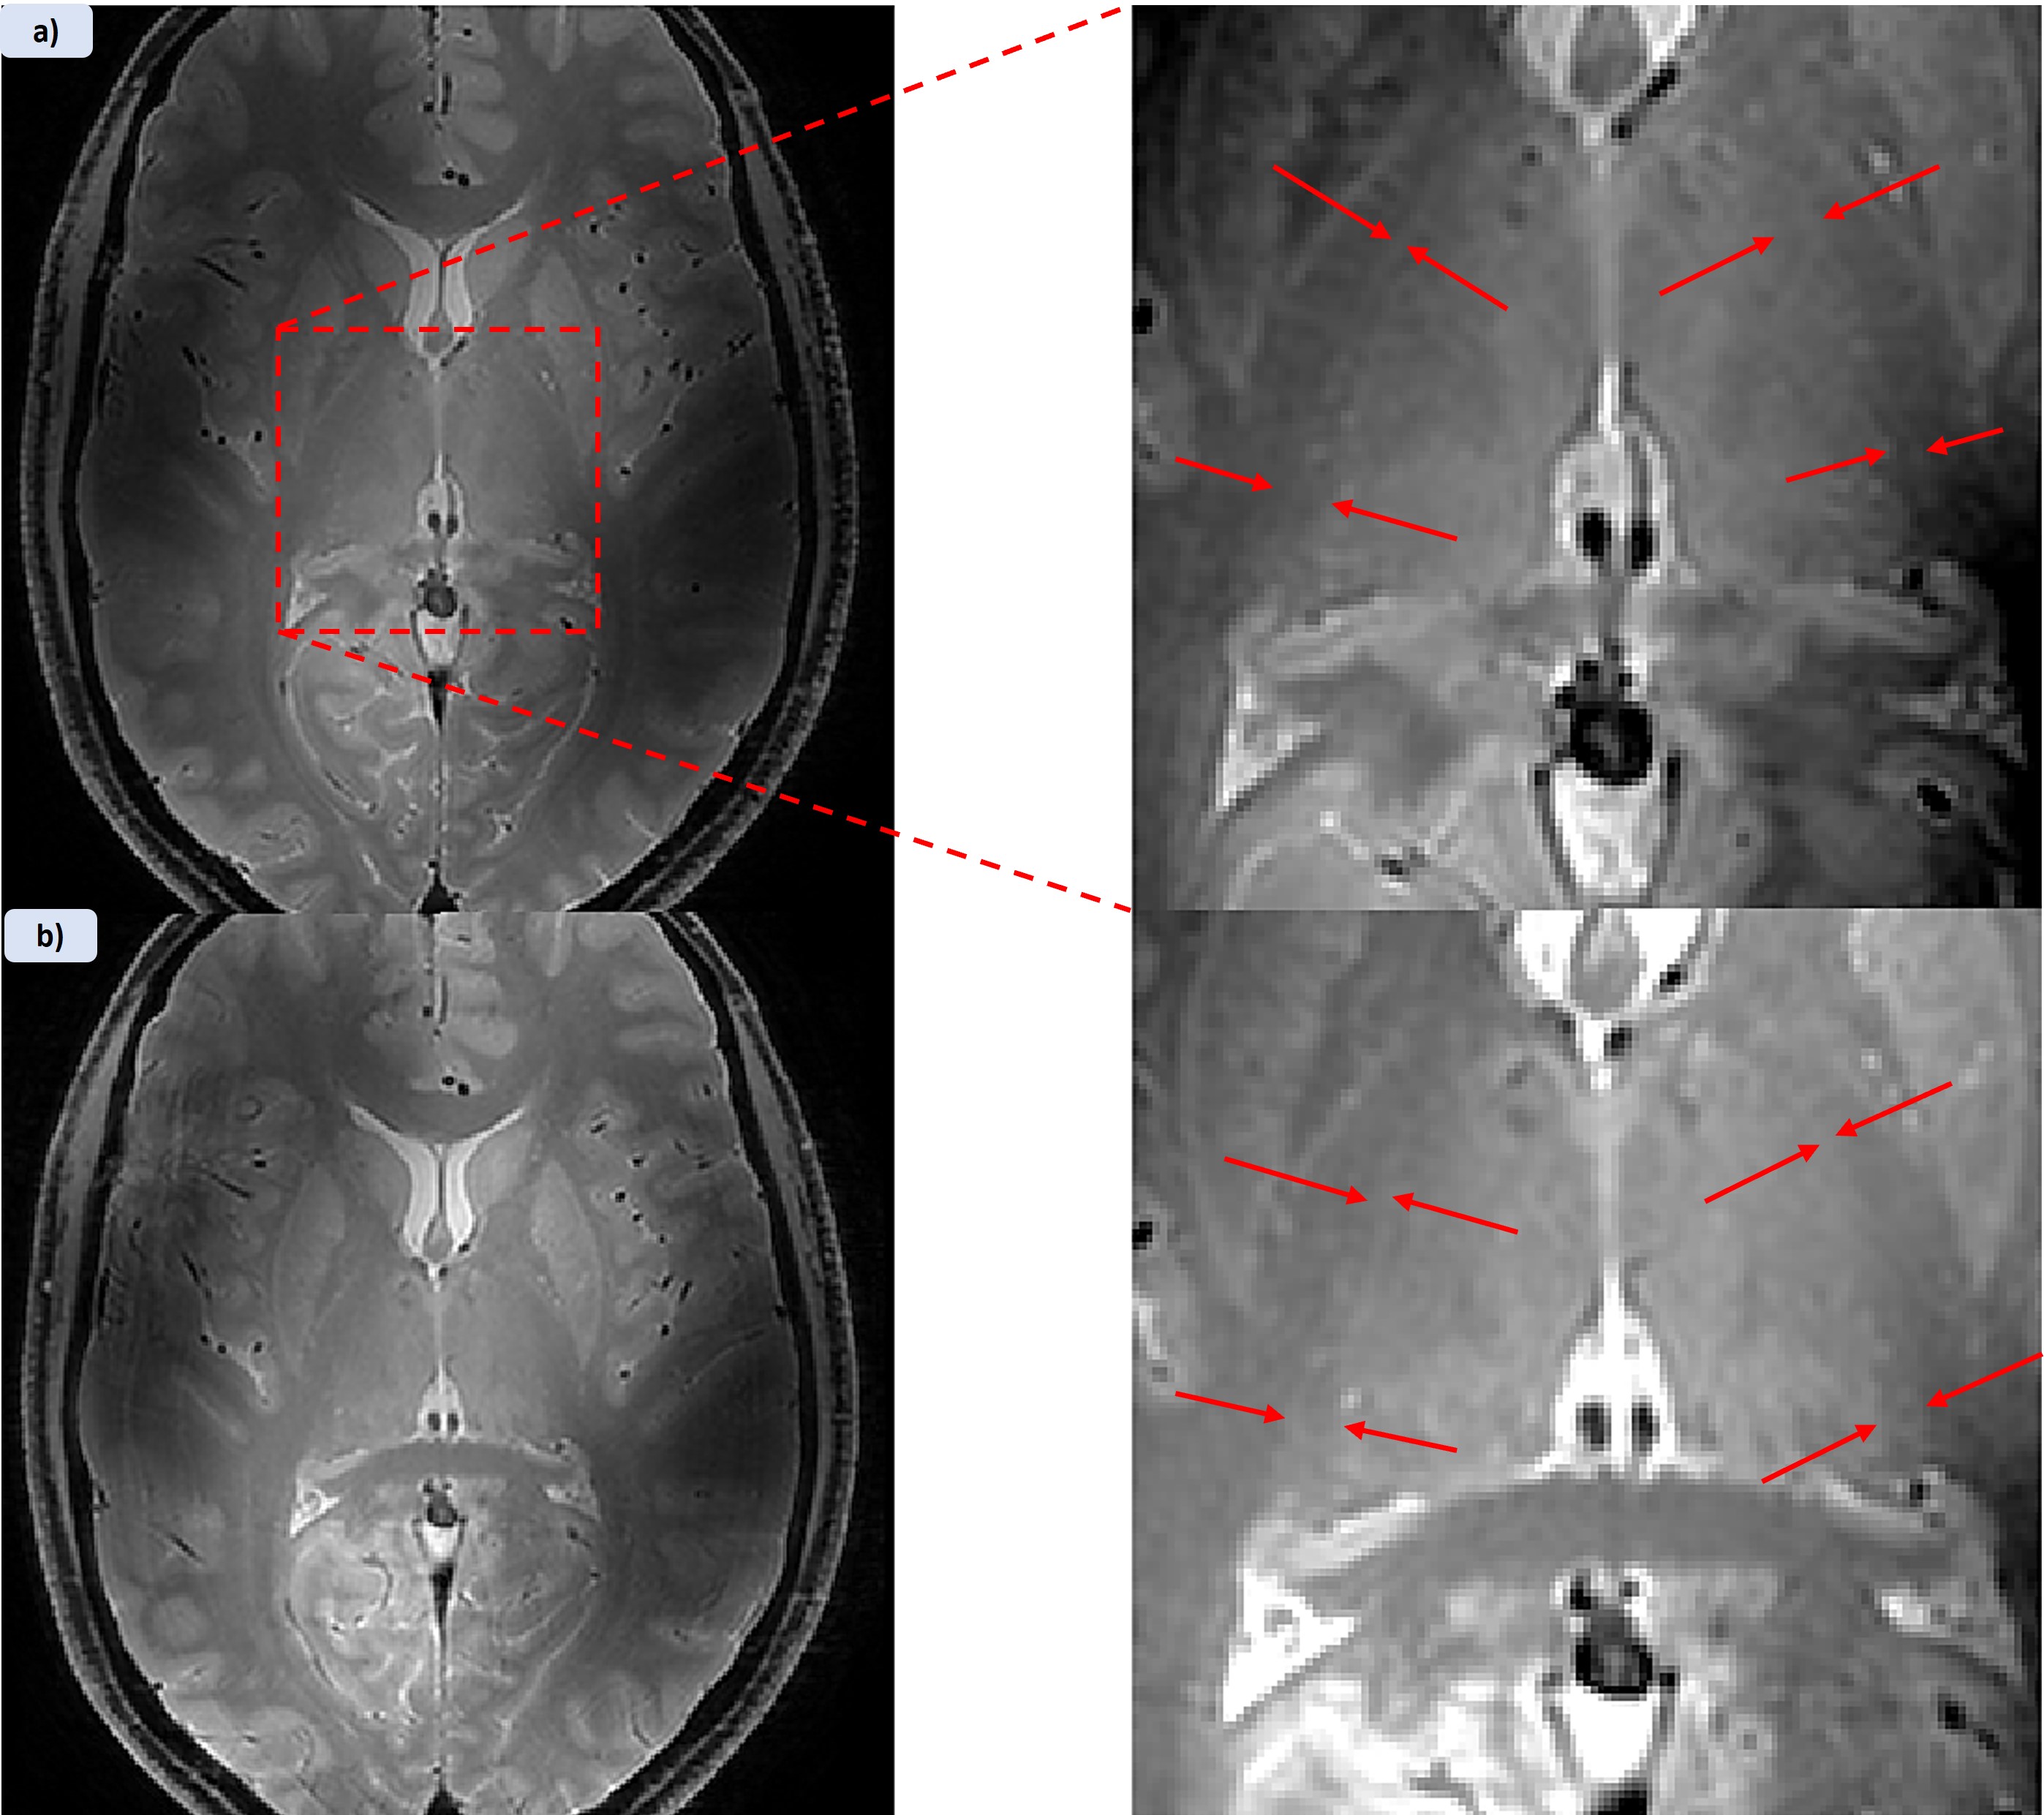
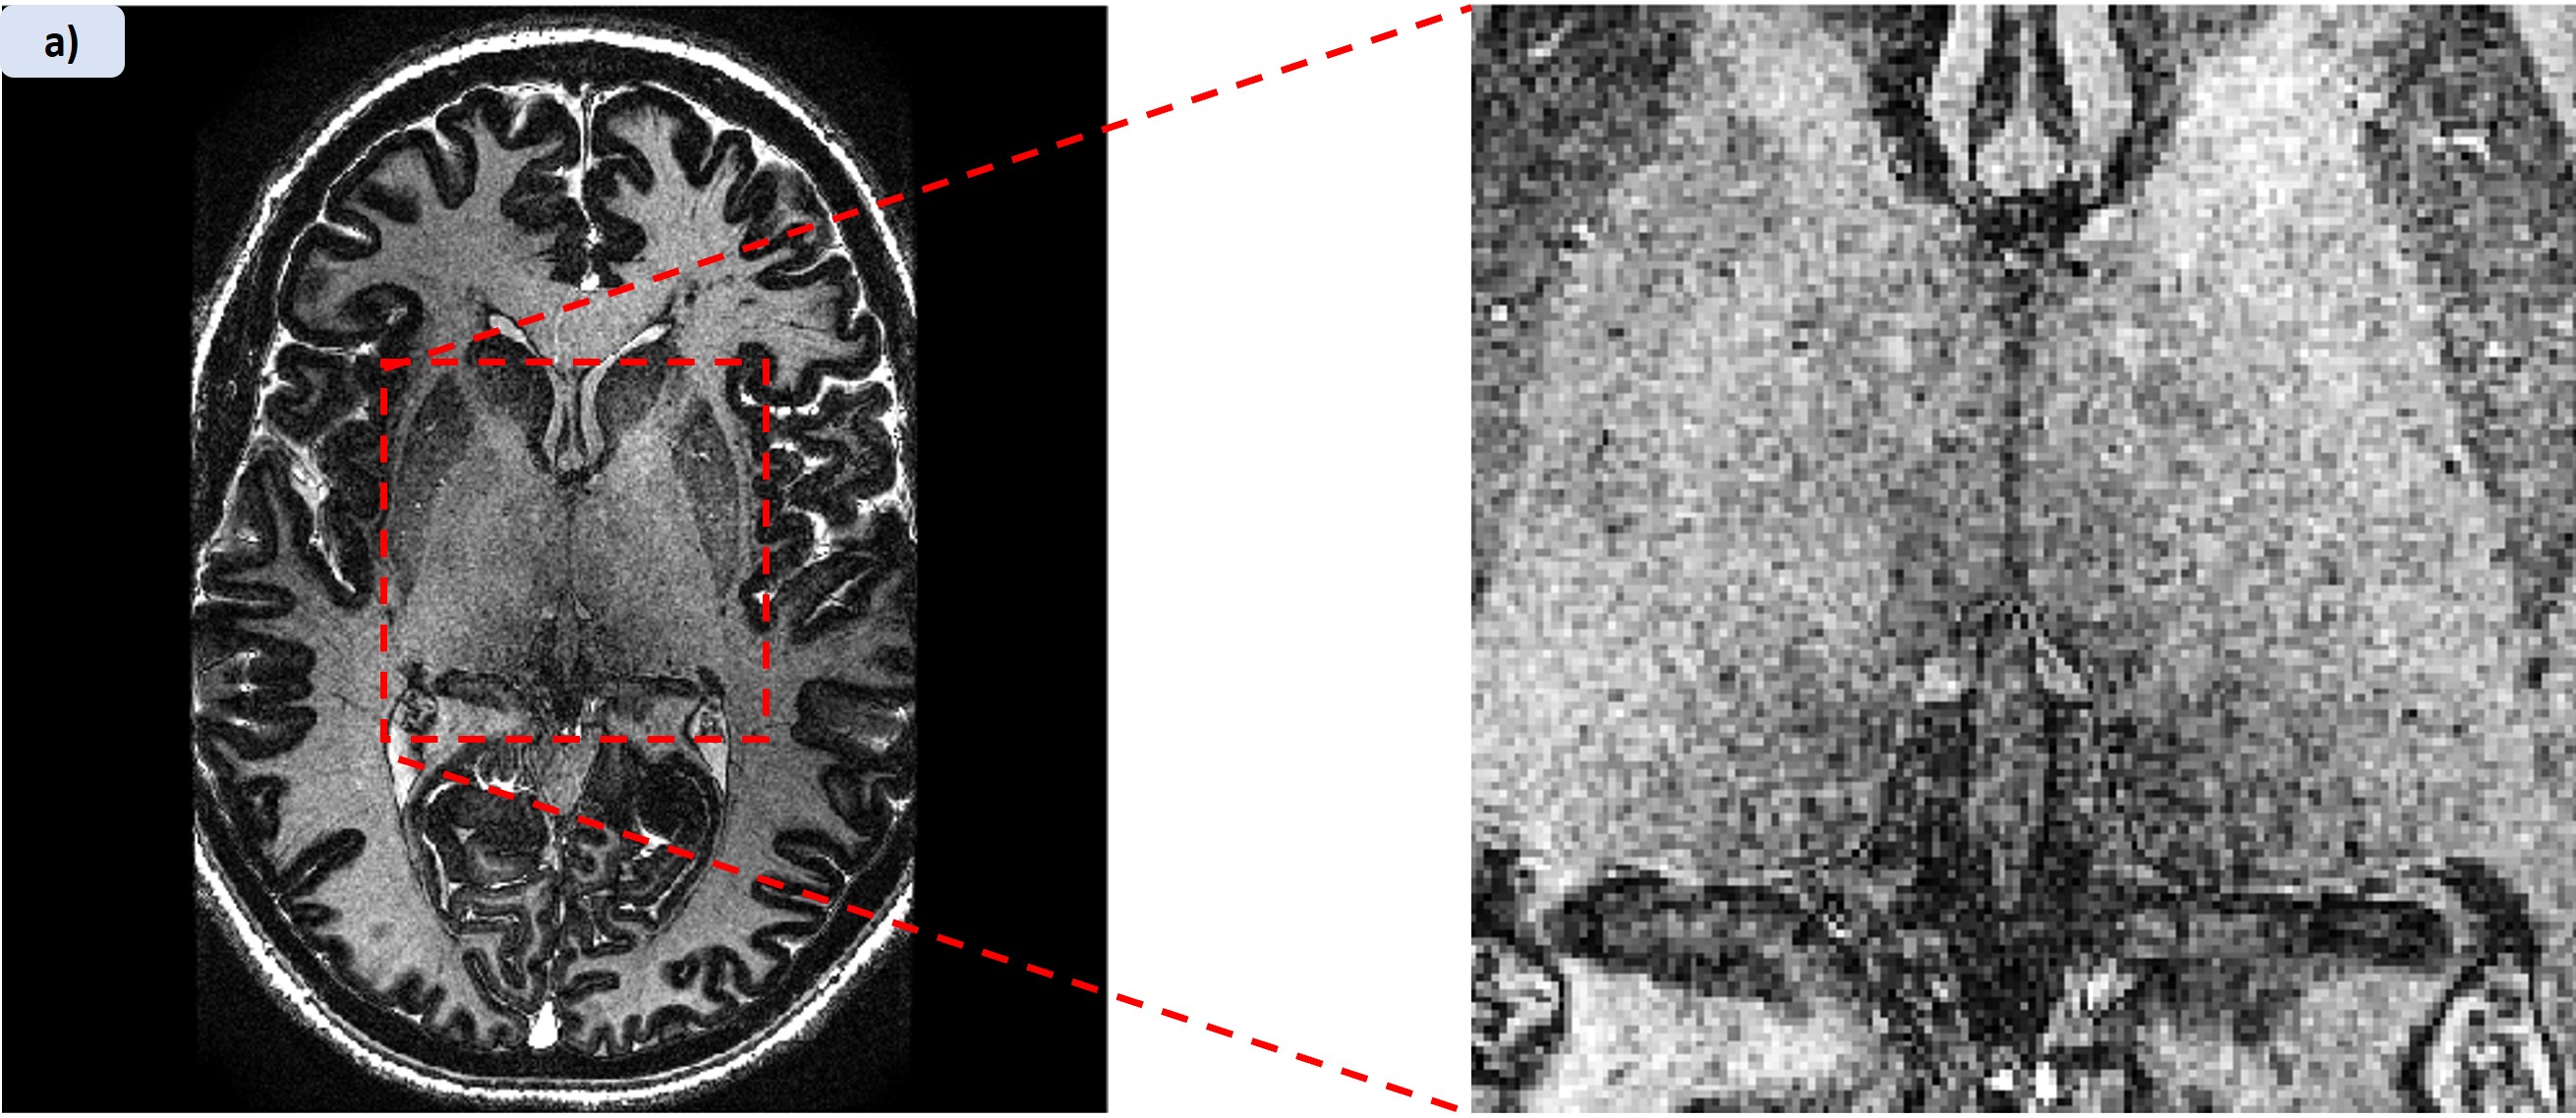
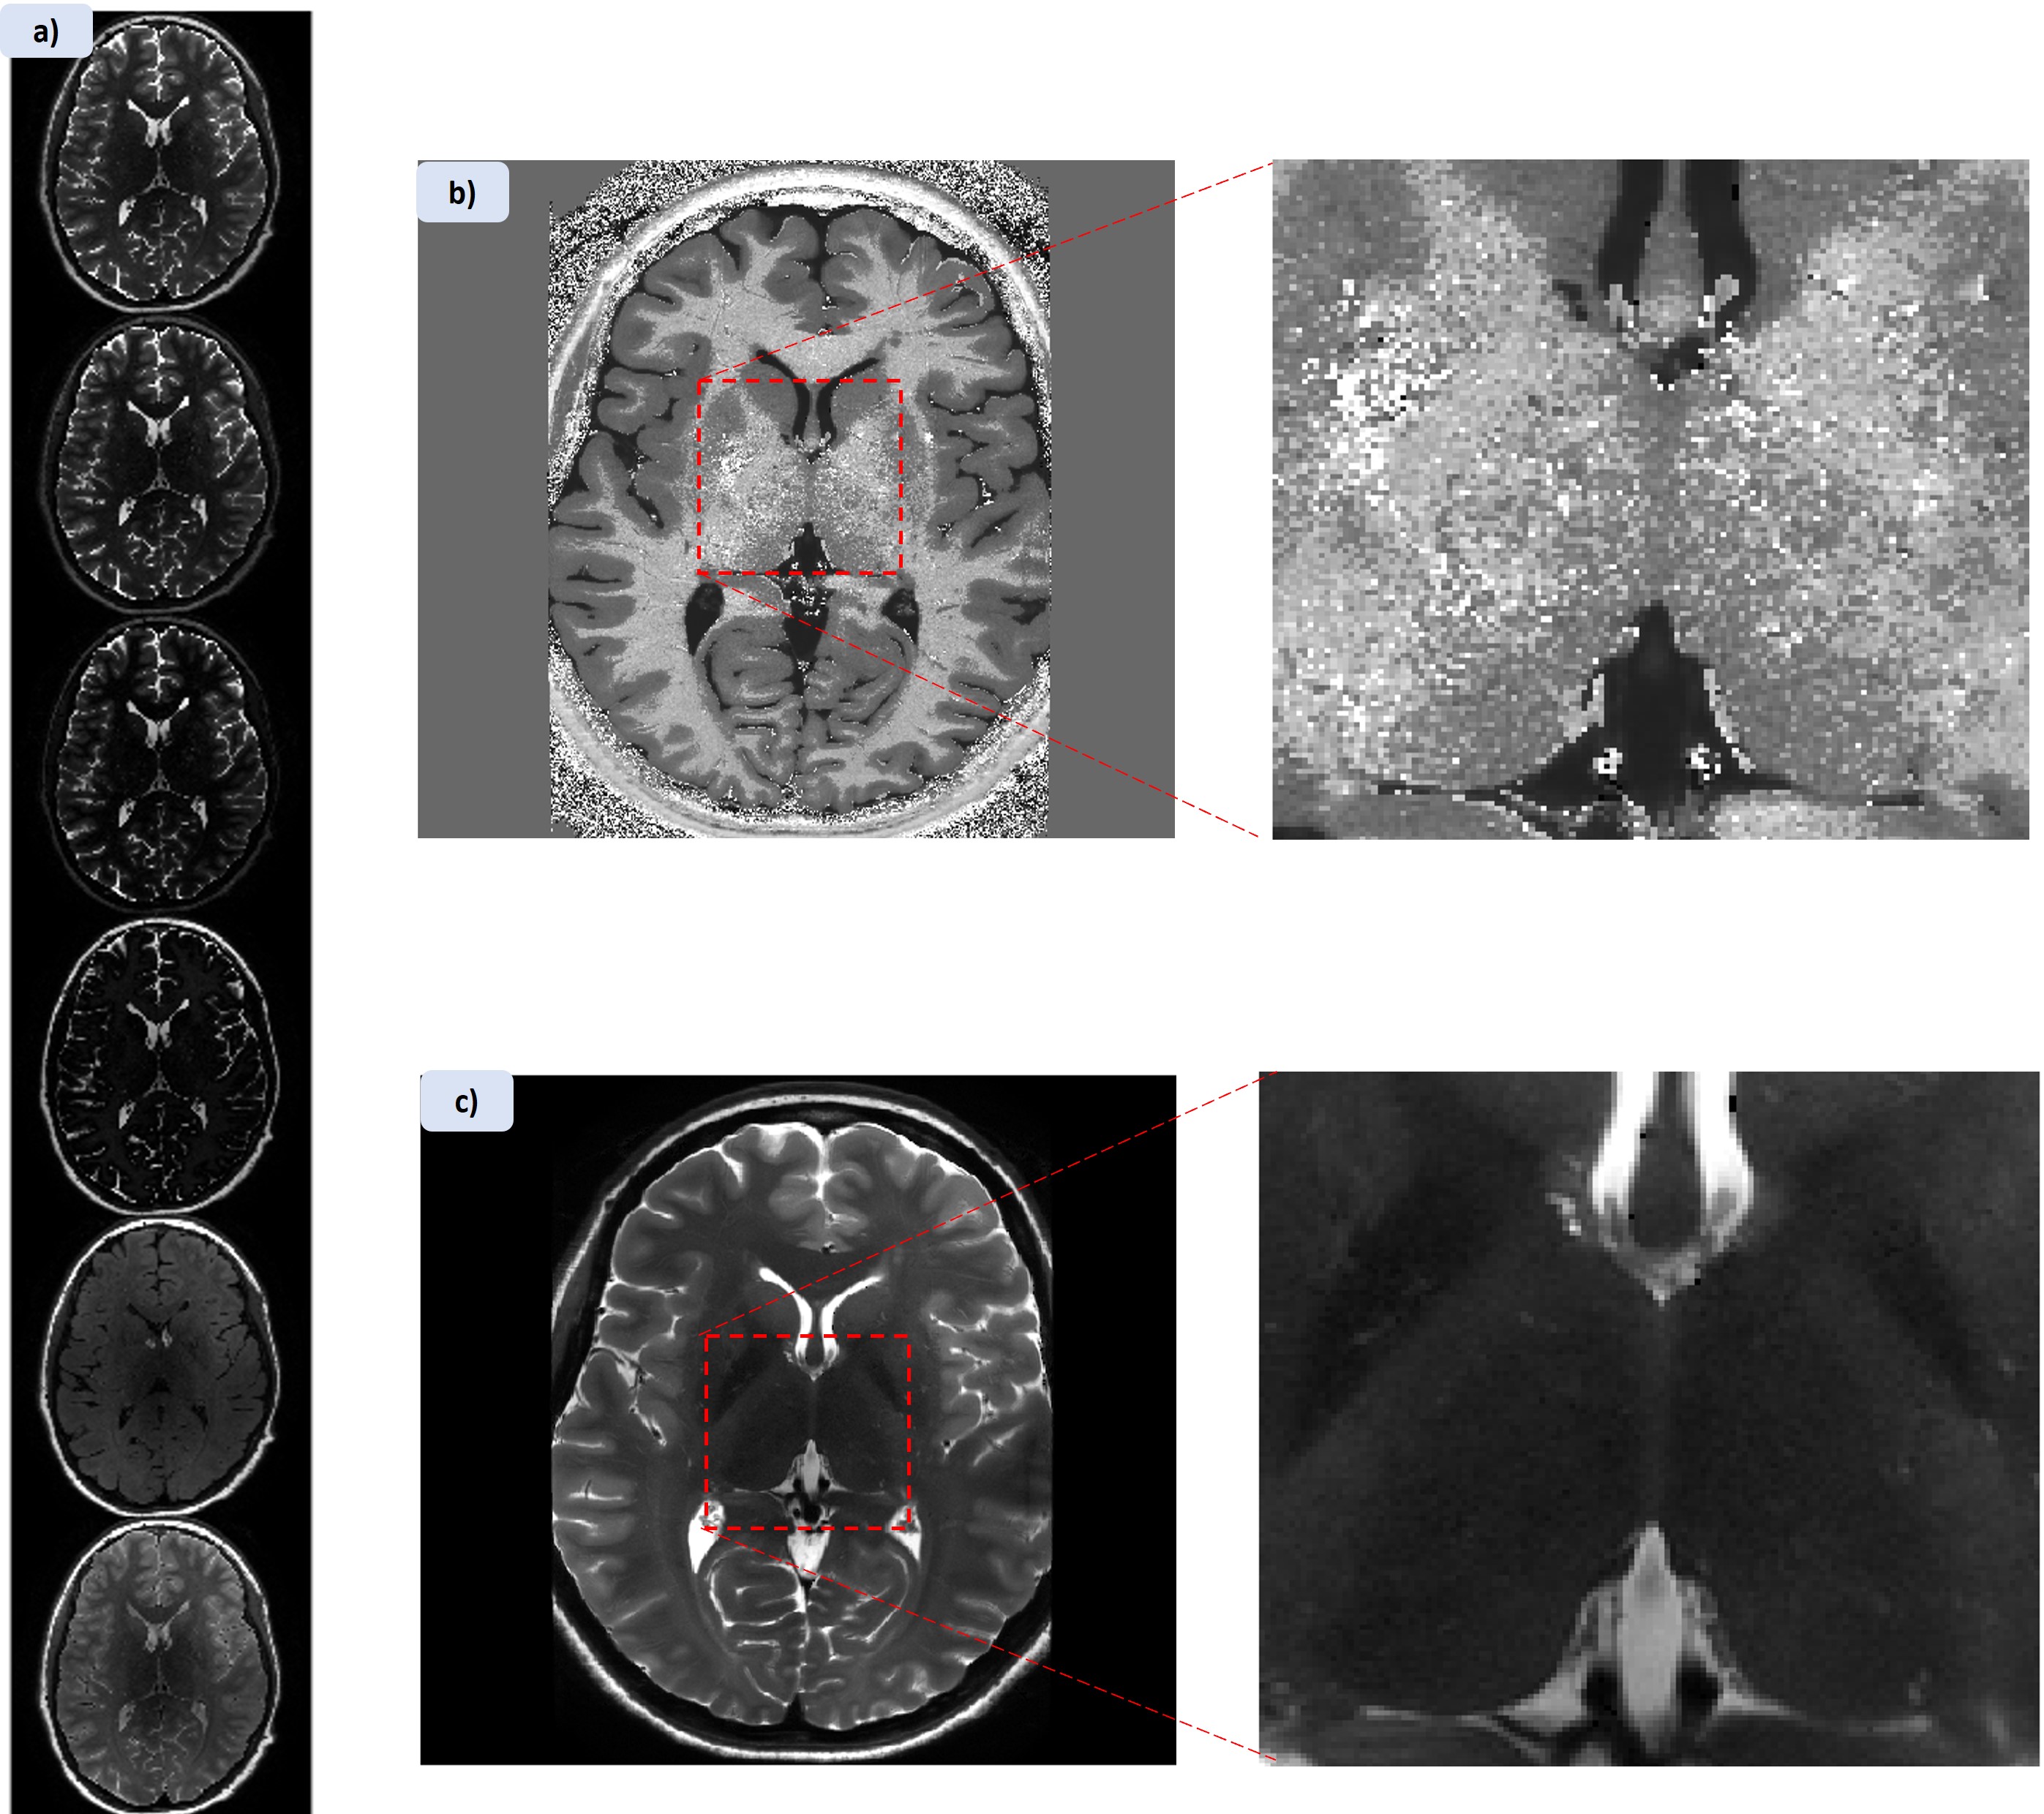
Figure 1 shows MPRAGE and both applied MPRAGE-SWI with all phase contributions and sign separated phase (red=positive, blue=negative) as well as the filtered phase mask used in equation 1 to generate the images. Figure 2 shows two FSE acquisitions with a refocussing flip angle of 60° and 90° respectively. Figure 3 shows FLASH for both SWI using all the phase and SWI with phase sign contribution separated by colour along with the filtered phase map for two echoes. These images were acquired at 0.4mm in-plane resolution with the echo times at 4.66ms and 19.7ms. Figure 4 shows the T1 contribution to TRN contrast through PSIR which is demonstrated again in Figure 5 which shows an IR-TSE series and resultant fitted T1 and S0 map.Discussion
Figure 1 demonstrates that MPRAGE offers little in the way of contrast over the thalamus, however applying the phase mask, particularly with the phase sign separated by colour vastly improves the visual differentiation between the thalamus and surrounding tissue. Despite this it des not capture the thickness of the TRN to the extend we see in the FSE images in figure 2. Both acquisitions without any post-processing allow for visual identification of the TRN, with slightly greater contrast coming from higher refocussing flip angle which unlocks greater SNR but removes T1 weighting. The two echoes of the FLASH shown in figure 3 only have slight contrast around the TRN in the raw magnitude but again this contrast is enhanced by the application of the phase mask. This is seen particularly in figure 4h where the alternate polarities of the phase mark out either side of the TRN. Figures 4 and 5 demonstrate that T1 offers no contrast at the TRN.Ultimately, the purely T2 weighted FSE image offers the strongest and easiest route to visualising the TRN in-vivo. However, the exploration of SWI strongly suggests that susceptibility is also a source of contrast at this boundary and further exploration could prove it to be an effective imaging modality for identification of this structure.
Acknowledgements
I would like to acknowledge the MRC for funding my PhD programmeReferences
Hobson, J. A. & Pace-Schott, E. F. The cognitive neuroscience of sleep: neuronal systems, consciousness and learning. Nat. Rev. Neurosci. 3, 679–93 (2002).
Crabtree JW, Garraghty PE, Schneider K, Halassa MM, Guido W, Campbell PW. Functional Diversity of Thalamic Reticular Subnetworks. Front Syst Neurosci [Internet]. 2018;12:41. Available from: www.frontiersin.org
Su JH, Thomas FT, Kasoff WS, Tourdias T, Choi EY, Rutt BK, et al. Thalamus Optimized Multi Atlas Segmentation (THOMAS): fast, fully automated segmentation of thalamic nuclei from structural MRI. 2019; Available from: https://doi.org/10.1016/j.neuroimage.2019.03.021
Pfefferbaum A, Adalsteinsson E, Rohlfing T, Sullivan E V. MRI estimates of brain iron concentration in normal aging: Comparison of field-dependent (FDRI) and phase (SWI) methods. Vol. 47, NeuroImage. 2009. p. 493–500.
Haacke EM, Mittal S, Wu Z, Neelavalli J, Cheng YCN. Susceptibility-weighted imaging: Technical aspects and clinical applications, part 1. Am J Neuroradiol. 2009;30(1):19–30.
Figures