3592
Improving Early Post-Operative Glioblastoma Segmentation With Semi-Supervised Deep Learning1Department of Physics and Computational Radiology, Oslo University Hospital, Oslo, Norway, 2Department of Physics, University of Oslo, Oslo, Norway, 3Computational Radiology and Artificial Intelligence (CRAI), Oslo University Hospital, Oslo, Norway, 4Department of Radiology and Nuclear Medicine, Oslo University Hospital, Oslo, Norway, 5Department of Medical Biophysics, University of Toronto, Toronto, ON, Canada, 6Sandra E Black Centre for Brain Resilience and Recovery, Sunnybrook Research Institute, Toronto, ON, Canada, 7Department of Neurosurgery, Oslo University Hospital, Oslo, Norway
Synopsis
Keywords: Segmentation, Machine Learning/Artificial Intelligence, Semi-supervision
Improving automatic segmentation of glioblastoma on early post-operative MRI is key to study the effect of resection volumes on patient outcomes. We curate a dataset of over 700 MRI examinations, of which 87 include annotations, and train a supervised and a semi-supervised deep-learning model. Semi-supervision improves the segmentation of the high-intensity FLAIR signal with 3% to a Dice score of 0.83 (p=0.031), while the segmentation of the enhancing tumor increases with 9% to 0.55 (p=0.056). However, enhancing tumor segmentations show high variability, possibly due to imperfect annotations. Segmentation of enhancing tumor on early post-operative MRI remains a challenging task.Introduction
Glioblastoma multiforme (GBM) is the most common form of adult primary brain tumor 1. It is an aggressive brain tumor, with a median overall survival of 14-15 months despite comprehensive treatment, which includes surgery followed by chemoradiation 2. The extent of resection of the tumor is a key prognostic factor 3. Currently, the standard of care is to remove as much of the contrast-enhancing tumor tissue as deemed safe during surgery 4. Recent literature, however, suggests that extending the resection to include some of the high-intensity FLAIR signal could improve overall survival, but more robust evidence is needed 5-7. There is at present a lack of automatic segmentation models that work on early post-operative MRI scans. The current study attempts to address this imaging ‘bottleneck’ by curating a post-operative dataset, training a supervised and a semi-supervised deep learning model, and evaluating whether these approaches can help improve post-operative GBM segmentation.Dataset and methods
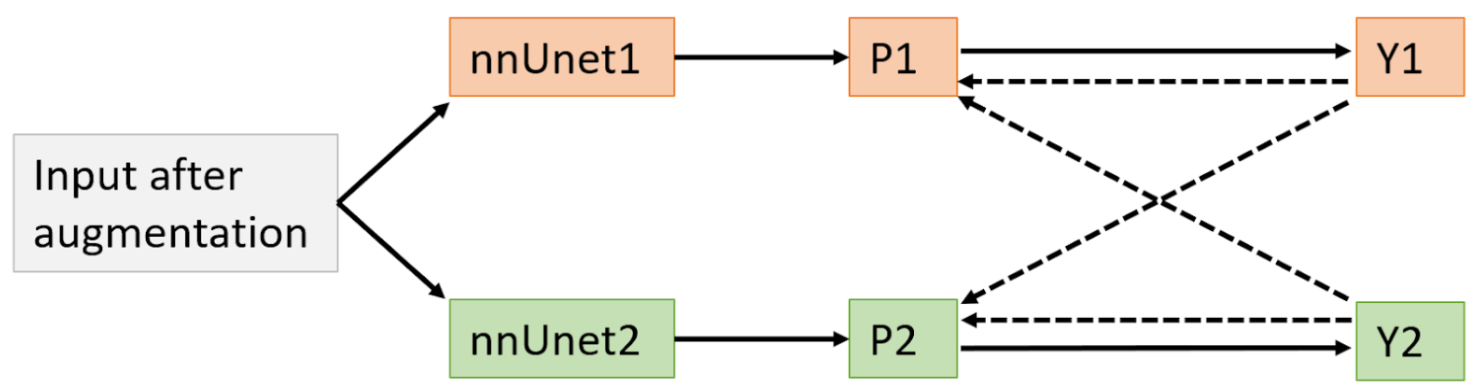
The dataset consisted of 791 MRI examinations of GBM patients taken within 48h following resection surgery. Examinations include T1-weighted scans taken before (T1) and after intravenous injection of a Gadolinium-based contrast (T1c), T2-weighted (T2), and fluid attenuated inversion recovery (FLAIR) scans. The image quality varied greatly, in part due to the longstanding data collection between 2003 and 2020. Pre-processing of the dataset included co-registration, bias correction, skull-stripping, and re-sampling to a 1x1x1mm isotropic voxel space. A neuroradiologist outlined the ground truth segmentations for the high-intensity FLAIR signal and the remaining contrast-enhancing tumor in a subset of 87 scans. These scans were chosen so that the T1, T1c and FLAIR sequences had been acquired with an isotropic resolution of at least 1x1x1mm in order to provide high-quality data to the annotator.To utilize the large unannotated dataset, we adapted a state-of-the-art semi-supervised training method, called “cross-pseudo supervision” (CPS), to perform 3D tumor segmentation. The nnUnet architecture8 that won the 2021 BraTS challenge was used as the models' backbone. As shown in figure 1, the proposed semi-supervised model consisted of two nnUnets that were each trained on the annotated dataset in a supervised manner, but also on the predictions from the other network on the whole dataset -including the unlabeled volumes. Each of the networks was separately pre-trained on the BraTS dataset 9. We compared the accuracy of this semi-supervised model to the nnUnet pretrained on BraTS and subsequently trained on our annotated dataset in a fully-supervised manner. The models were evaluated with 5-fold cross-validation using the Dice similarity coefficient (DSC) as the performance metric.
Results
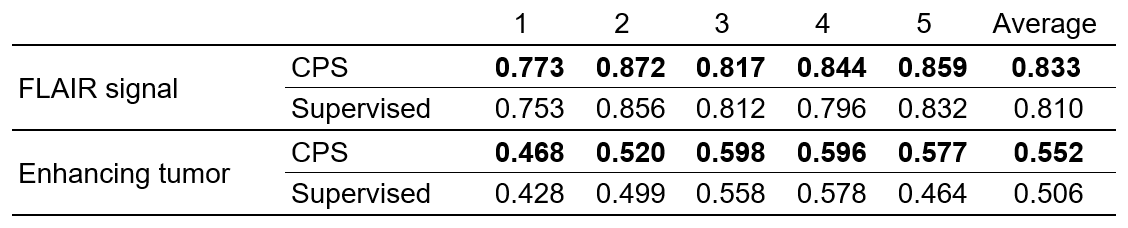
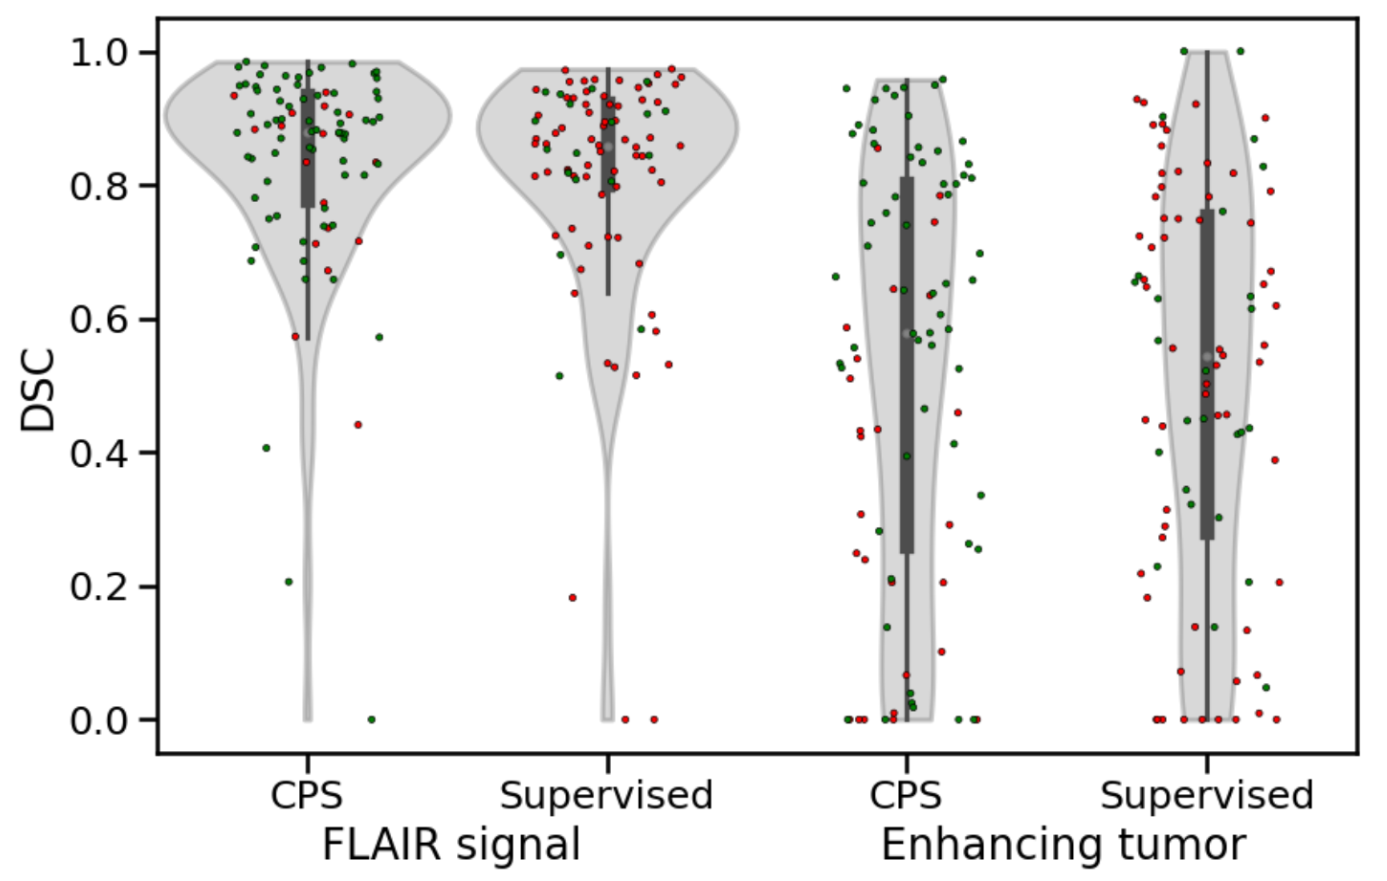
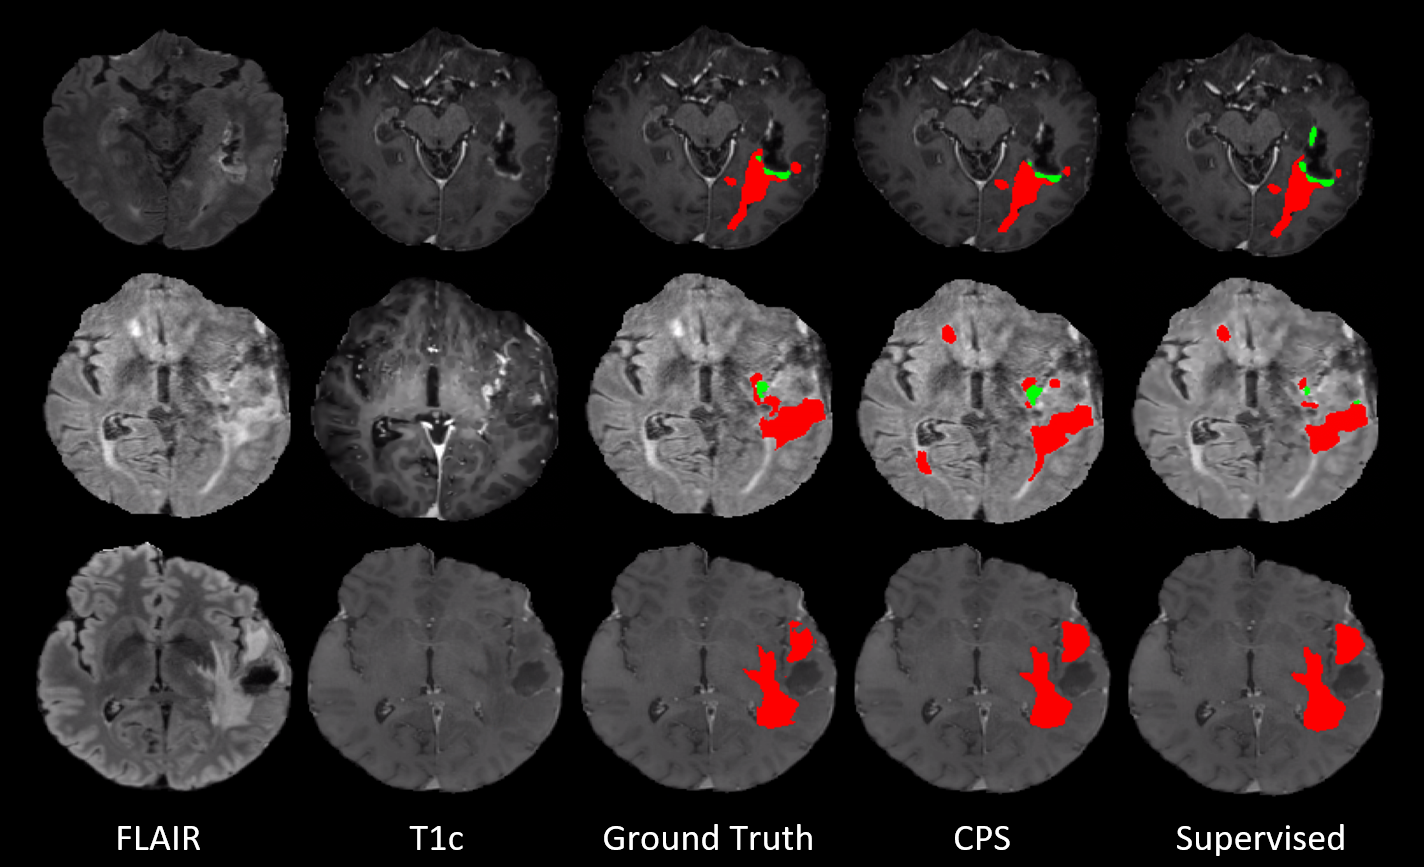
As seen in table 1, the use of cross-pseudo supervision resulted in increases in the DSC scores for both the FLAIR signal and the enhancing tumor across all validation sets, relative to the fully-supervised model. CPS improves the FLAIR signal segmentation with 3% to an average DSC of 0.83, while the average DSC of the enhancing tumor segmentation increases with 9% to 0.55. However, the paired t-test suggests that only the improvements in the FLAIR signal are significant (p=0.031 and p=0.056 for FLAIR signal and enhancing tumor respectively).Figure 2 shows the distribution of the DSCs for the individual volumes using the semi- and fully-supervised models. As shown by the data points in green, 69 and 61 of the 87 volumes for FLAIR signal and enhancing tumor, respectively, have a higher DSC when segmented with the semi-supervised CPS model. The distribution of DSC for enhancing tumor, however, shows a close to flat distribution with a large number of poorly segmented volumes. Examples of both models’ segmentations, together with the ground truth annotations, can be seen in figure 3.
On average, the difference in segmentation performance between the models is much larger for enhancing tumor segmentations compared to FLAIR signal segmentations. The mean of the absolute value of the difference in DSC between models is 0.04 for the FLAIR signal and 0.13 for the enhancing tumor. Only two volumes show a difference in DSC of the FLAIR signal of more than 0.2 (in absolute value), compared to 16 volumes for the enhancing tumor class.
Discussion
In early post-operative scans, FLAIR signal segmentation is a much easier task for the models than enhancing tumor segmentation. For FLAIR signal, CPS shows small, but stable increases in accuracy without increasing the burden on the annotators. While CPS leads to larger increases in DSC for enhancing tumor, the high variability in the segmentations between the models helps to explain why this result was not statistically significant. The instability of the models may be due to high variability in the ground truths for the enhancing tumor, which is known to be very hard to segment even for expert annotators 10. Future work will look at how the quality of the ground truths can be assessed, for example by level of agreement between annotators, and how quality influences the learning of both supervised and semi-supervised models.Conclusion
Our semi-supervised model archives an average DSC of 0.83 and 0.55 for early post-operative FLAIR signal and enhancing tumor, respectively. While this is an improvement on the fully-supervised baseline, segmentation of enhancing tumor on early post-operative MRIs remains a challenging task.Acknowledgements
This study would not have been possible without the computational resources provided by the machine learning infrastructure at the Centre for Information Technology, University of Oslo, Norway.References
Ostrom QT, Gittleman H, Liao P, et al. CBTRUS Statistical Report: Primary brain and other central nervous system tumors diagnosed in the United States in 2010–2014. Neuro-Oncology. 11 2017;19:v1. doi:10.1093/NEUONC/NOX158
Stupp R, Mason WP, van den Bent MJ, et al. Radiotherapy plus Concomitant and Adjuvant Temozolomide for Glioblastoma. New England Journal of Medicine. 3 2005;352:987–996. doi:10.1056/NEJMOA043330/SUPPL_FILE/987SA1.PDF
Lacroix M, Abi-Said D, Fourney DR, et al. A multivariate analysis of 416 patients with glioblastoma multiforme: prognosis, extent of resection, and survival. Journal of neurosurgery. 2001;95:190–198. doi:10.3171/JNS.2001.95.2.0190
Li YM, Suki D, Hess K, Sawaya R. The influence of maximum safe resection of glioblastoma on survival in 1229 patients: Can we do better than gross-total resection? Journal of neurosurgery. 4 2016;124:977–988. doi:10.3171/2015.5.JNS142087
Leeuw CN, Vogelbaum MA. Supratotal resection in glioma: a systematic review. Neuro-Oncology. 2 2019;21:179–188. doi:10.1093/NEUONC/NOY166
Molinaro AM, Hervey-Jumper S, Morshed RA, et al. Association of Maximal Extent of Resection of Contrast-Enhanced and Non–Contrast-Enhanced Tumor With Survival Within Molecular Subgroups of Patients With Newly Diagnosed Glioblastoma. JAMA Oncology. 4 2020;6:495–503. doi:10.1001/JAMAONCOL.2019.6143
Karschnia P, Young JS, Dono A, et al. Prognostic validation of a new classification system for extent of resection in glioblastoma: A report of the RANO resect group. Neuro-Oncology. Published online 8 2022. doi:10.1093/NEUONC/NOAC193
Luu HM, Park SH. Extending nn-UNet for brain tumor segmentation. Lecture Notes in Computer Science. 12 2021;12963 LNCS:173–186. doi:10.48550/arxiv.2112.04653
Baid U, Ghodasara S, Mohan S, et al. The RSNA-ASNR-MICCAI BraTS 2021 Benchmark on Brain Tumor Segmentation and Radiogenomic Classification. Published online 7 2021. doi:10.48550/arxiv.2107.02314
Visser M, Müller DMJ, van Duijn RJM, et al. Inter-rater agreement in glioma segmentations on longitudinal MRI. NeuroImage Clinical. 1 2019;22. doi:10.1016/J.NICL.2019.101727Ostrom QT, Gittleman H, Liao P, et al. CBTRUS Statistical Report: Primary brain and other central nervous system tumors diagnosed in the United States in 2010–2014. Neuro-Oncology. 11 2017;19:v1. doi:10.1093/NEUONC/NOX158
Figures