3591
Robust thalamic nuclei segmentation from T1 MRI data1CNRS, CerCo (Brain and Cognition Research Center) - Université Paul Sabatier, Toulouse, France, 2INSERM, ToNiC (Toulouse NeuroImaging Center) - Université Paul Sabatier, Toulouse, France, 3Hôpital Purpan, Centre Hospitalier Universitaire de Toulouse, Département de Neurologie, Toulouse, France, 4Stanford University School of Medicine, Department of Psychiatry & Behavioral Sciences, Stanford, CA, United States, 5UMass Chan Medical School, Department of Radiology, Worcester, MA, United States
Synopsis
Keywords: Segmentation, Data Processing, WMn synthesis, HIPS
This work presents a methodology for thalamic nuclei segmentation from T1w MRI. Thalamus Optimized Multi-Atlas Segmentation (THOMAS), which was originally developed for white-matter nulled (WMn) MPRAGE, is adapted for standard T1 MRI by employing synthesis techniques to make the T1 images closer to WMn contrast. Robustness is tested across image contrast, MRI manufacturer, and field strength.Introduction
The thalamus is a deep brain structure comprised of nuclei implicated in a wide range of cognitive, sensory, executive, and motor functions. Segmentation of thalamic nuclei remains challenging because of their poor contrast on standard T1 and T2 weighted MRI. To address this issue, several approaches have been explored such as histological atlases [1-2], fMRI [3-4], and diffusion imaging [5-6]. New contrasts such as white-matter-nulled (WMn) [7] and grey-matter-nulled (GMn) [8] imaging have been proposed, which better delineate thalamic nuclei. However, these sequences are not part of common clinical protocols or databases. Very few methods exist for thalamic nuclei segmentation from T1 data [9]. In this work, we introduce a new pre-processing step to segment thalamic nuclei accurately from T1 data and tested its robustness to image contrast, MRI manufacturer, and field strength.Methods
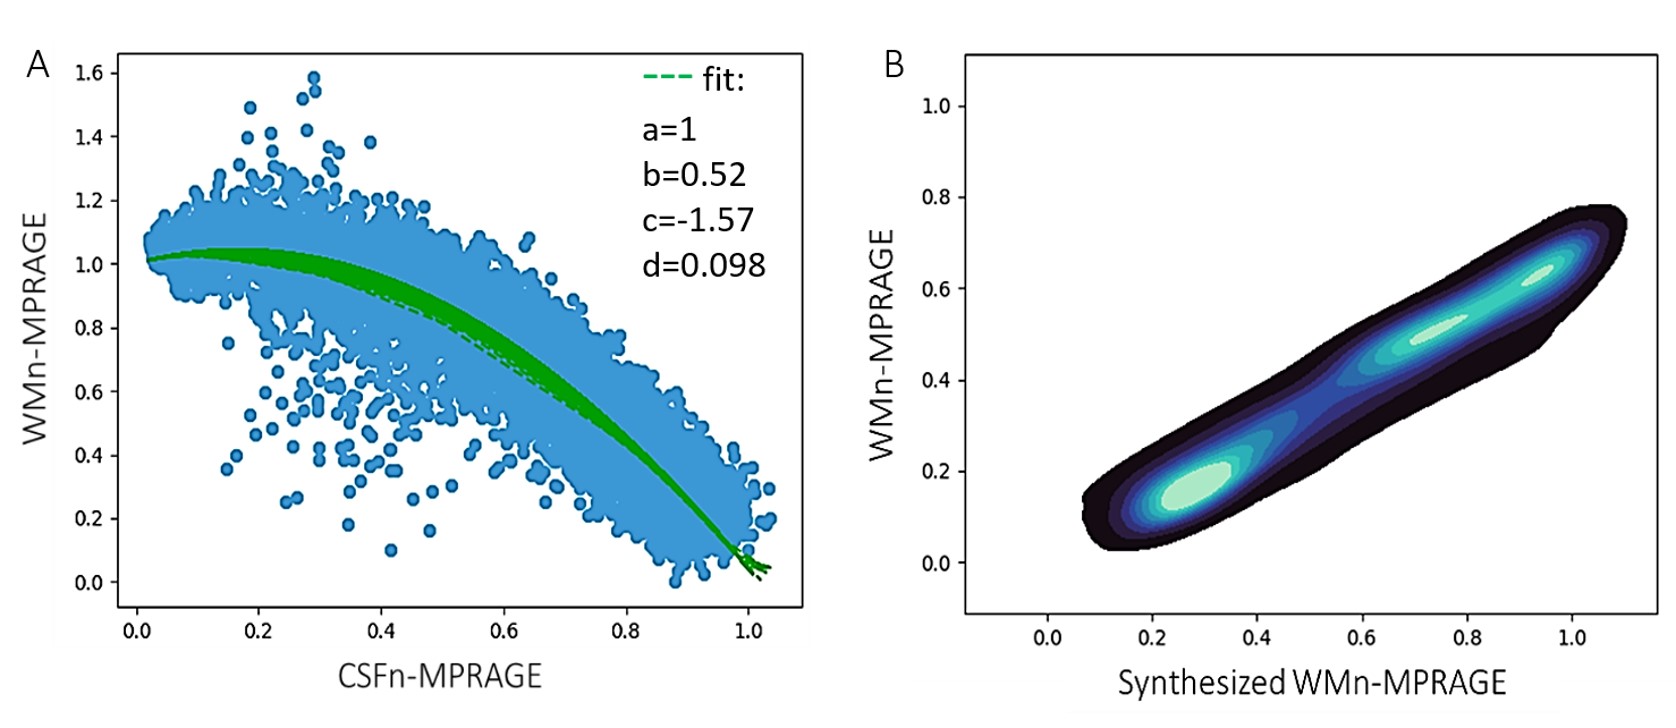
THalamus Optimized Multi Atlas Segmentation (THOMAS) [10] is a multi-atlas thalamic method for the parcellation of WMn-MPRAGE data. It uses an atlas of 20 WMn-MPRAGE prior datasets acquired at 7T, segmented manually using the Morel atlas as a guide. To make THOMAS work optimally for standard T1 contrast, it was modified to use mutual information (vs. cross-correlation) as the nonlinear registration metric and a majority voting technique for label fusion [11]. However, this method was not accurate for small nuclei. Recently, a deep learning-based method [12] was published, showing improved accuracy by first synthesizing WMn images from T1 data and then segmenting synthetic data using convolutional neural networks (CNN).In this work inspired by the CNN WMn synthesis idea, WMn-like images are synthesized from T1 MRI using a polynomial function that is fitted to a plot of T1 vs. WMn intensity values as shown Fig 1A. T1 and WMn MPRAGE from 10 subjects scanned on a Philips 3T MRI scanner were first registered and then normalized using the WM and CSF signal derived from the respective image histograms to make it scanner and subject independent, prior to fitting. We call this method Histogram-based polynomial synthesis (HIPS). The fit maximizes the probability density function between native and synthesized WMn images (Fig 1b). Due to the normalization step, the function derived from Philips 3T MRI data was also applicable to scans from other scanners. HIPS preprocessing was incorporated inside THOMAS.
To test the hypothesis that HIPS-based synthesis is more robust compared to CNN-based synthesis, the segmentation performance of HIPS-THOMAS and CNN method (trained using 3T GE and Siemens MPRAGE data) were compared for different sequences (MPRAGE vs. T1 SPGR), scanners (Philips, GE, Siemens), and field strengths (3T, 7T). T1 segmentations were compared using Dice indices against THOMAS segmentation on WMn images.
Results
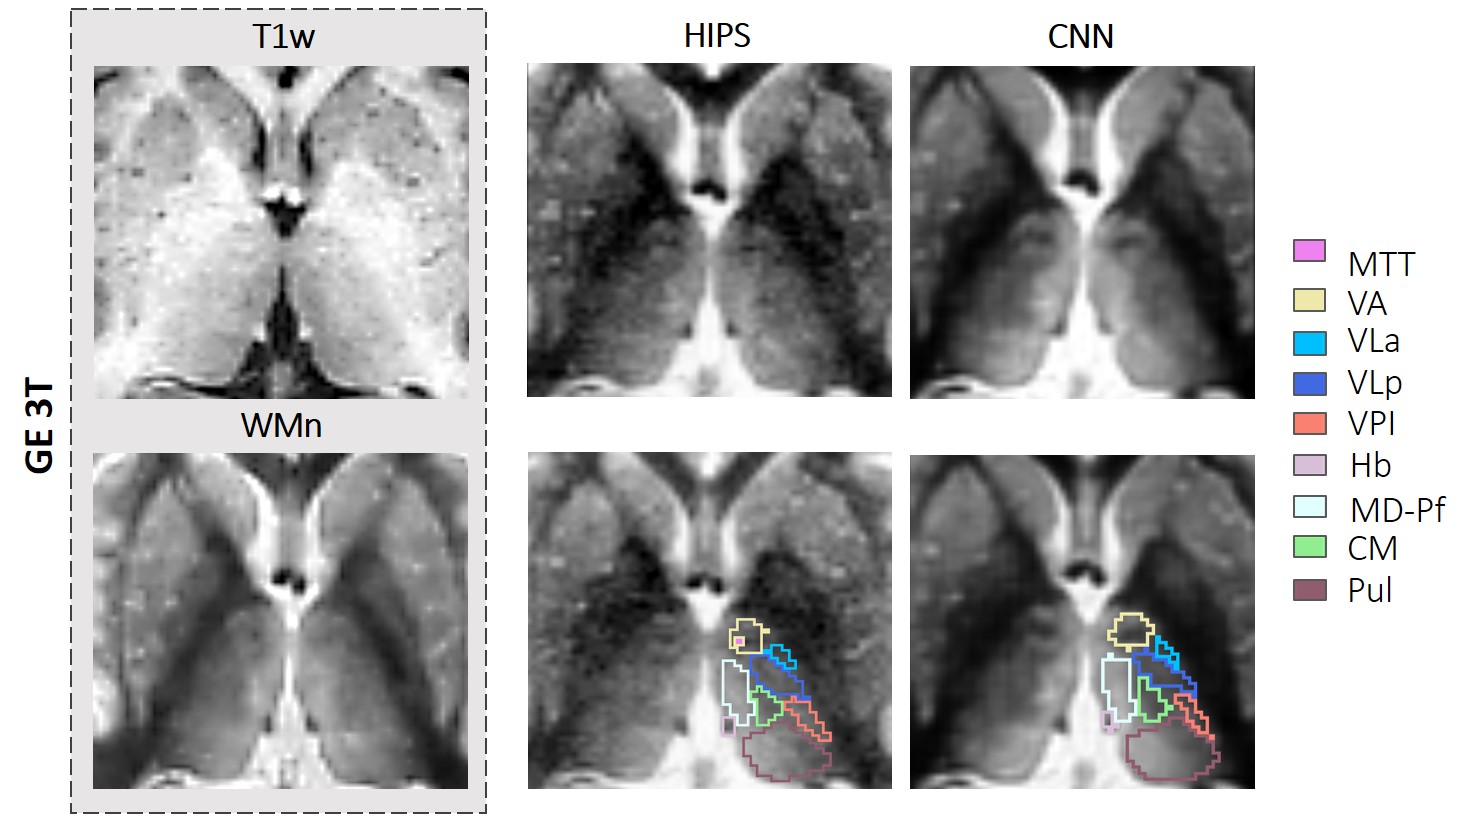
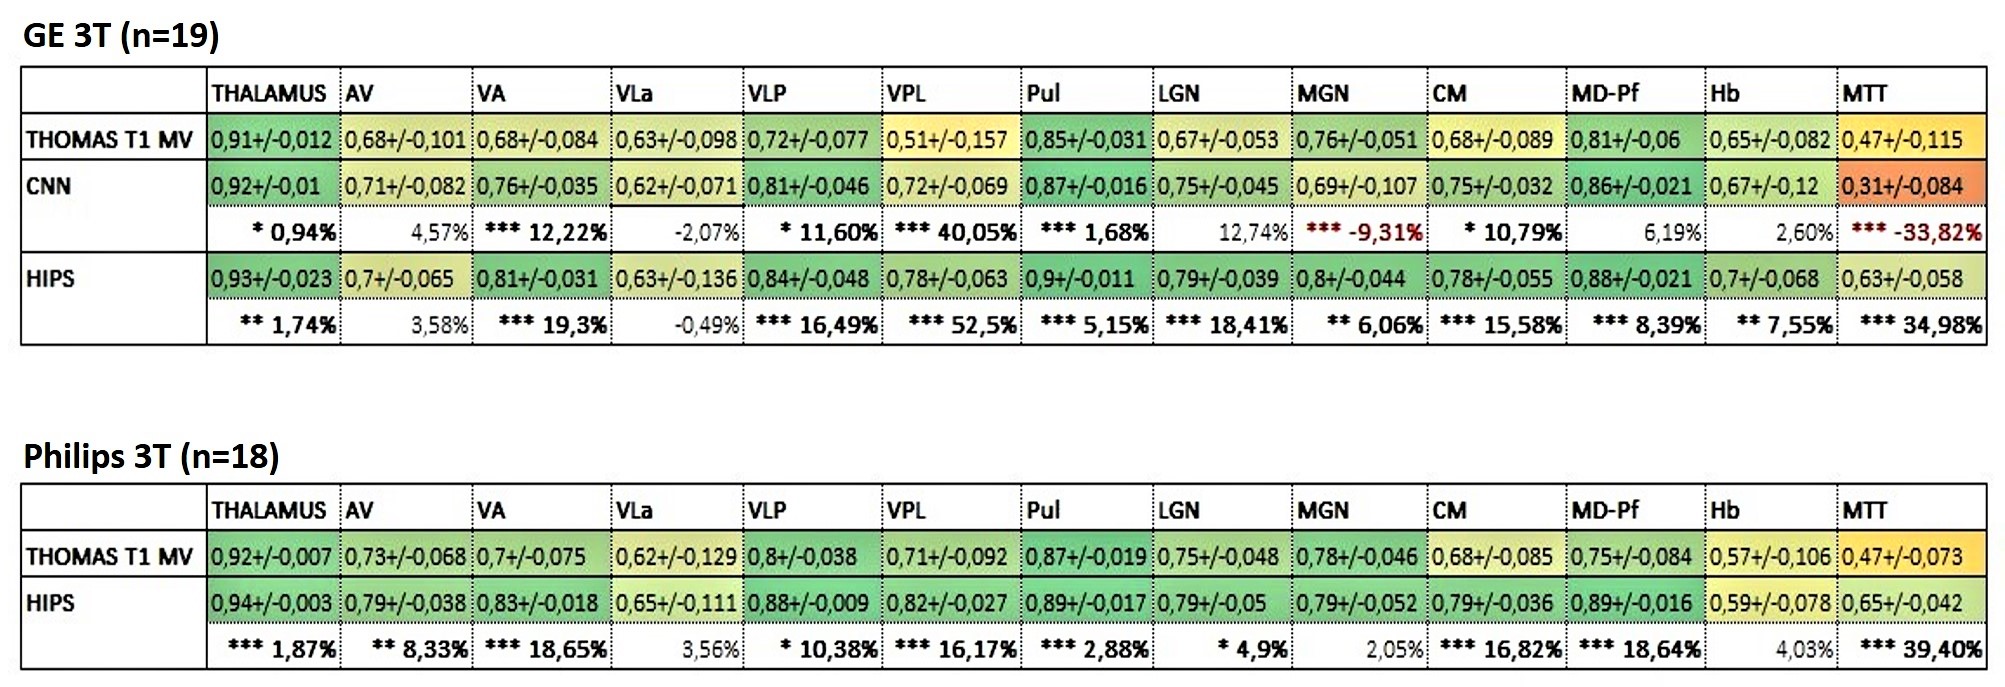
Figure 2 compares third-order HIPS and CNN-synthesized WMn images from a T1w 3D SPGR dataset acquired on a 3T GE scanner. THOMAS and CNN segmentation overlays are also shown. Note the significant improvement in intrathalamic contrast and thalamic boundaries for the synthesized images. The segmented nuclei include Anteroventral (AV), Ventral anterior (VA), Ventral lateral anterior (VLa), Ventral lateral posterior (VLp), Ventral posterolateral (VPL), Pulvinar (Pul), Lateral and medial geniculate nuclei (LGN/MGN), Centromedian (CM), Mediodorsal-Parafascicular (MD-Pf), and Habenular (Hb).Sequence- Dice results from analysis of 18 3D SPGR datasets acquired on a GE 3T data are shown in Figure 3. Mean Dice (left side) of both HIPS and CNN synthesis segmentation are significantly better than direct THOMAS on T1 with 6 nuclei displaying >15% increase in Dice. Note that HIPS outperforms CNN (higher mean, lower SD) for many nuclei, especially MGN, likely due to the difference in image contrast between SPGR and MPRAGE (used to train the CNN). Almost identical performance was observed for the right side.
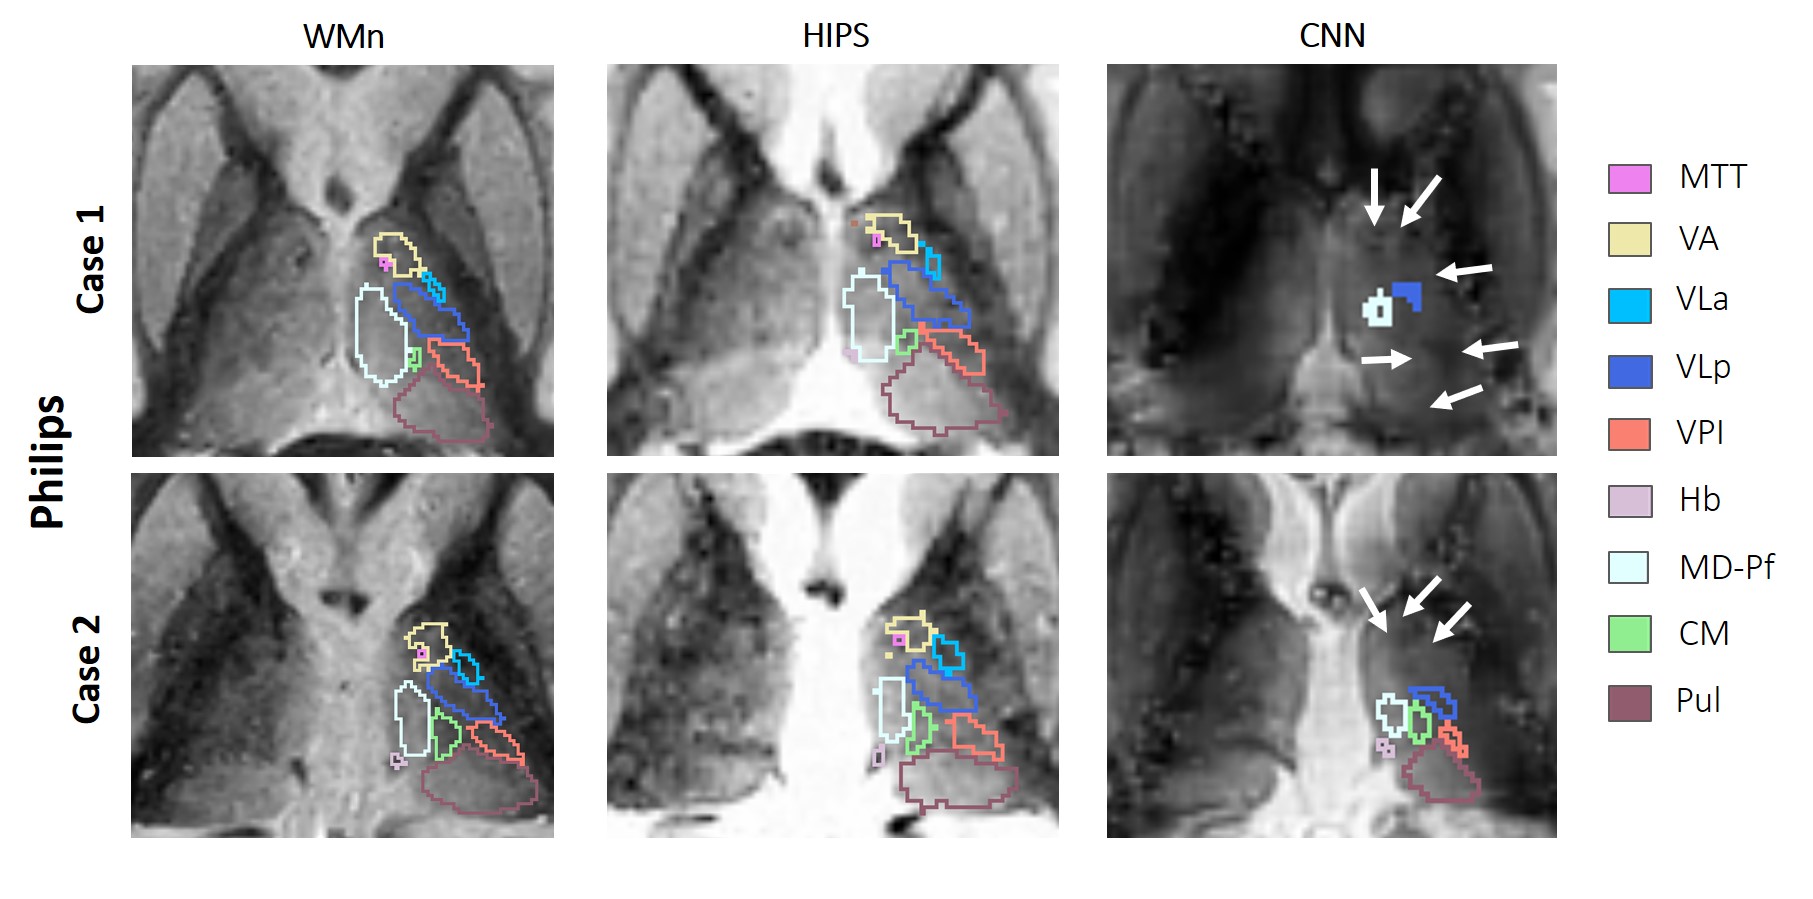
Scanner type – 18 MPRAGE datasets from 3T Philips scanner were analyzed using CNN and HIPS. The CNN method failed in several cases due to the failure of the synthesis step. Figure 4 shows two example cases where the CNN fails while HIPS produces segmentations very comparable to the WMn segmentation. The Dice improvements of HIPS-THOMAS compared to direct THOMAS are shown in Figure 3. Mean Dice (left side) of HIPS segmentation is significantly better than direct THOMAS on T1 with VA, VPl, CM, and MD displaying >15% increase in Dice.
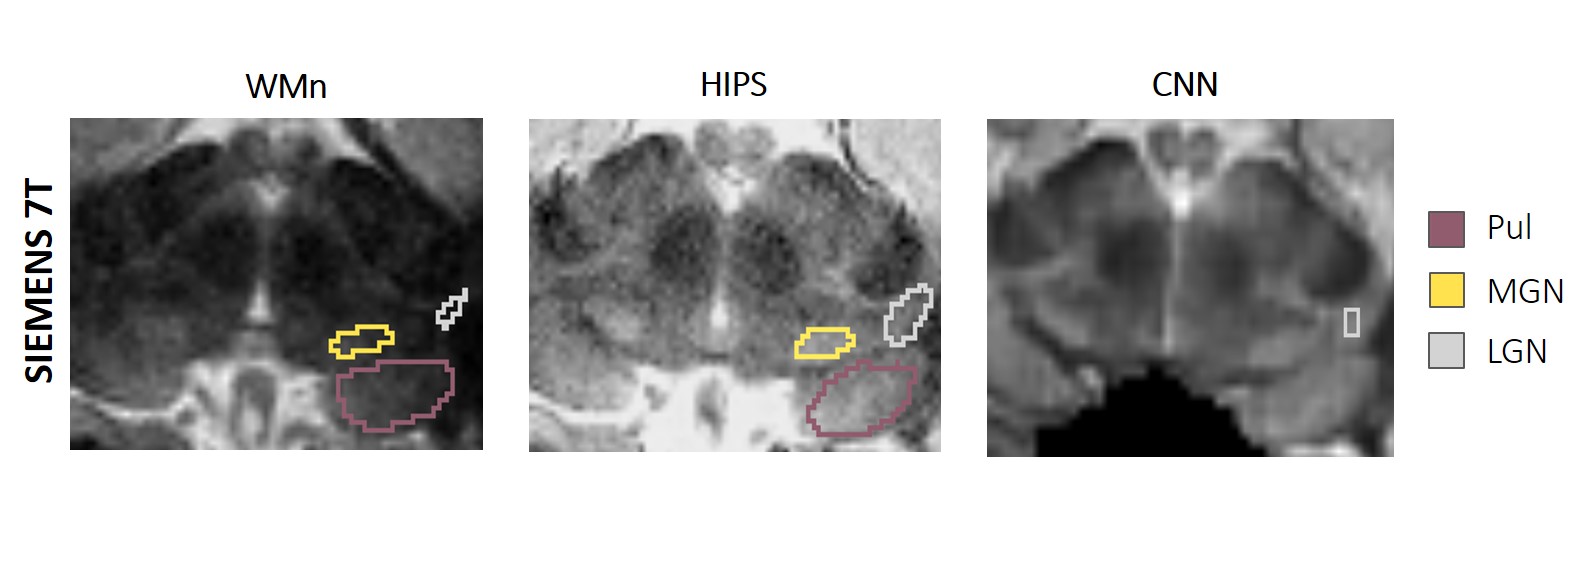
Field strength – 7T MP2RAGE Siemens datasets were segmented using HIPS-THOMAS and CNN. Figure 5 shows an example of a case where CNN has failed whilst HIPS-THOMAS produces segmentation comparable to WMn.
Conclusion
WMn-like images synthesized using HIPS significantly improved the robustness as well as the accuracy of THOMAS compared to direct THOMAS on T1. The improvement could be due to an increase in intrathalamic contrast as well as the use of cross-correlation metrics in nonlinear registration and the joint label fusion algorithm. The CNN synthesized images look much closer to the acquired WMn images than HIPS but are far less robust due to being trained on GE and Siemens 3T MPRAGE data. Training using new data may not always be possible (e.g. lack of WMn contrast data in public databases). Here, HIPS could prove very valuable. While third-order polynomial fitting worked well due to the three species (WM, GM, CSF), more complex functions could be explored for better synthesis image quality.Acknowledgements
No acknowledgement found.References
1. Morel, A., Magnin, M., Jeanmonod, D. (1997). Multiarchitectonic and stereotactic atlas of the human thalamus. J Comp Neurol 387:588–630.
2. Krauth, A., Blanc, R., Poveda, A., Jeanmonod, D., Morel, A., & Székely, G. (2010). A mean three-dimensional atlas of the human thalamus: Generation from multiple histological data. NeuroImage, 49(3), 2053–2062.
3. Zhang, D., Snyder, A. Z., Fox, M. D., Sansbury, M. W., Shimony, J. S., & Raichle, M. E. (2008). Intrinsic functional relations between human cerebral cortex and thalamus. Journal of neurophysiology, 100(4), 1740–1748.
4. Kumar, V. J., van Oort, E., Scheffler, K., Beckmann, C. F., & Grodd, W. (2017). Functional anatomy of the human thalamus at rest. NeuroImage, 147, 678–691.
5. Behrens, T.E., Johansen-Berg, H., Woolrich, M.W., Smith, S.M., Wheeler-Kingshott, C.A. M., Boulby, P.A., et al., 2003. Non-invasive mapping of connections between human thalamus and cortex using diffusion imaging. Nat. Neurosci. 6 (7), 750–757.
6. Battistella, G., Najdenovska, E., Maeder, P., Ghazaleh, N., Daducci, A., Thiran, J. P., ... & Fornari, E. (2017). Robust thalamic nuclei segmentation method based on local diffusion magnetic resonance properties. Brain Structure and Function, 222(5), 2203-2216.
7. Tourdias, T., Saranathan, M., Levesque, I. R., Su, J., & Rutt, B. K. (2014). Visualization of intra-thalamic nuclei with optimized white-matter-nulled MPRAGE at 7 T. Neuroimage, 84, 534-545.
8. Magnotta VA, Gold S, Andreasen NC, Ehrhardt JC, Yuh WT. Visualization of subthalamic nuclei with cortex attenuated inversion recovery MR imaging. Neuroimage. 2000;11:341–346.
9. Iglesias, J. E., Insausti, R., Lerma-Usabiaga, G., Bocchetta, M., Van Leemput, K., Greve, D. N., ... & Alzheimer's Disease Neuroimaging Initiative. (2018). A probabilistic atlas of the human thalamic nuclei combining ex vivo MRI and histology. Neuroimage, 183, 314-326.
10. Su, J. H., Thomas, F. T., Kasoff, W. S., Tourdias, T., Choi, E. Y., Rutt, B. K., & Saranathan, M. (2019). Thalamus Optimized Multi Atlas Segmentation (THOMAS): fast, fully automated segmentation of thalamic nuclei from structural MRI. Neuroimage, 194, 272-282.
11. Bernstein, A. S., Rapcsak, S. Z., Hornberger, M., Saranathan, M., & Alzheimer’s Disease Neuroimaging Initiative (2021). Structural Changes in Thalamic Nuclei Across Prodromal and Clinical Alzheimer's Disease. Journal of Alzheimer's disease : JAD, 82(1), 361–371.
12. Umapathy, L., Keerthivasan, M. B., Zahr, N. M., Bilgin, A., & Saranathan, M. (2022). Convolutional Neural Network Based Frameworks for Fast Automatic Segmentation of Thalamic Nuclei from Native and Synthesized Contrast Structural MRI. Neuroinformatics, 20(3), 651-664.
Figures