3589
Comparison of image-based and statistical approaches for brain volumetry harmonization1Center for Neuroscience and Regenerative Medicine, Henry M Jackson Foundation for the Advancement of Military Medicine, Bethesda, MD, United States, 2Radiology and Imaging Sciences, National Institutes of Health, Bethesda, MD, United States, 3Neurology, Johns Hopkins University, Baltimore, MD, United States, 4Department of Biostatistics, Epidemiology and Informatics, University of Pennsylvania, Philadelphia, PA, United States, 5Translational Neuroradiology Section, National Institute of Neurological Disorders and Stroke, Bethesda, MD, United States, 6Electrical and Computer Engineering, Johns Hopkins University, Baltimore, MD, United States, 7Radiology and Radiological Sciences, Uniformed Services University, Bethesda, MD, United States
Synopsis
Keywords: Segmentation, Brain, Harmonization
Image harmonization approaches have been proposed for reducing the variation of brain image measurements in studies involving acquisitions from multiple scanner protocols and hardware. This study compares two harmonization methods, DeepHarmony, a deep learning-based image synthesis approach, and ComBat, a statistical batch correction tool, based on their ability to yield consistent brain volume measurements from two different T1-weighted acquisitions. Our study showed that DeepHarmony outperformed the ComBat approach, although both approaches significantly improved consistency when compared to unharmonized images.
Introduction
Techniques for harmonizing brain images or extracted brain features, such as volumes, cortical thickness, and diffusion metrics, across various MR acquisition protocols or scanners have emerged as an important step in studies involving multiple sites or protocols1–4. One class of approaches uses deep learning networks to synthesize a desired contrast from another. DeepHarmony (DH) uses this approach to harmonize structural MR images obtained from two distinct scan protocols when paired training data are available4. Another common technique, called ComBat, uses a statistical model for feature harmonization that was originally designed for batch correction of genomic data3. While these techniques have demonstrated improved harmonization outcomes, the performance and efficiency of these two methods have not yet been compared.Methods
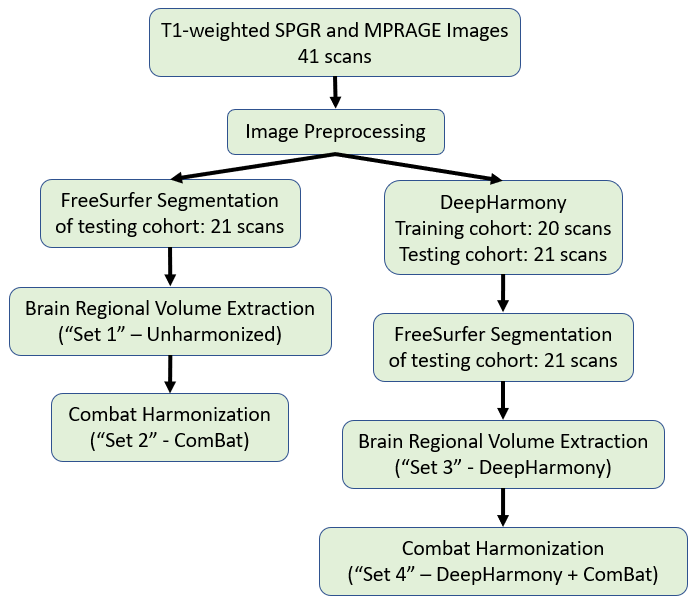
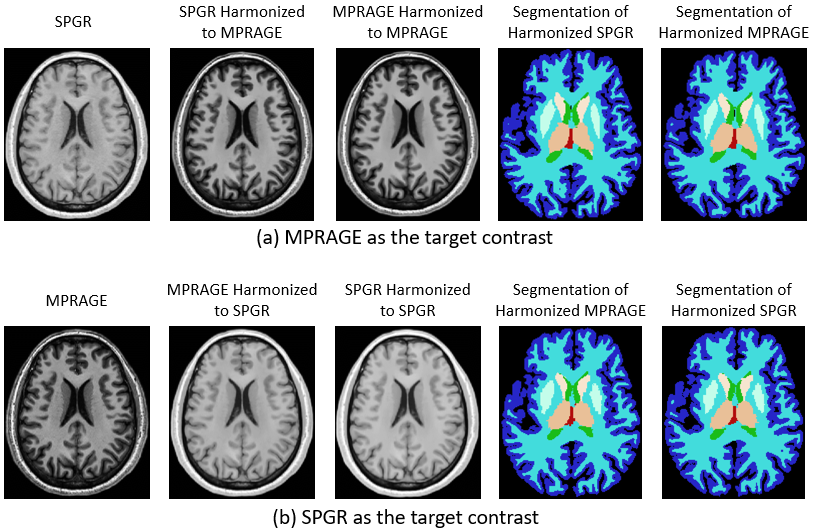
MR data were collected from 41 healthy subjects enrolled in a study of multiple sclerosis family members5. Three-dimensional (3D) T1-weighted spoiled gradient-recalled echo (SPGR, 256x256x192, TR=7.8ms, TE=3ms, FA=18°) images and magnetization prepared rapid gradient echo (MPRAGE, 256x256x176, TR=3000ms, TE=3.03ms, TI=900ms, FA=9°) images were acquired on a Siemens 3T MR Scanner within a single scan session (Fig. 1). Voxel sizes were 1×1×1mm3. All images were first corrected for inhomogeneity using N4ITK6. For each subject, SPGR images were rigidly registered to the MPRAGE images using the Advanced Normalization Tools (ANTs) software package7. In the DH approach, the co-registered images were divided into a training set (20 subjects) and a testing set (21 subjects) (Fig. 1). Two groups of neural network models were trained using the training cohort: (1) SPGR images were harmonized to MPRAGE images (Fig. 2a), and (2) MPRAGE images were harmonized to the SPGR images (Fig. 2b). The trained models were used to predict the harmonized SPGR and MPRAGE images for the testing cohort. Whole brain segmentation was applied for the unharmonized and harmonized images in the testing cohort using FreeSurfer, and the volumes of 13 brain regions were calculated (“Set 1” and “Set 3” in Fig. 1, respectively). Because the use of DH and ComBat are not mutually exclusive, the 13 measured volumes from both unharmonized images and from the DH outputs of the testing cohort were harmonized using the ComBat approach (“Set 2” and “Set 4” in Fig. 1, respectively). The percentage differences between each pair of SPGR and MPRAGE brain volumes in these four sets were determined (Unharmonized, ComBat, DH, DH+ComBat), and paired two-sample t-tests and F-Tests were utilized to evaluate the mean and variance differences, correspondingly. ComBat was implemented using the R package “neuroCombat1”.Results
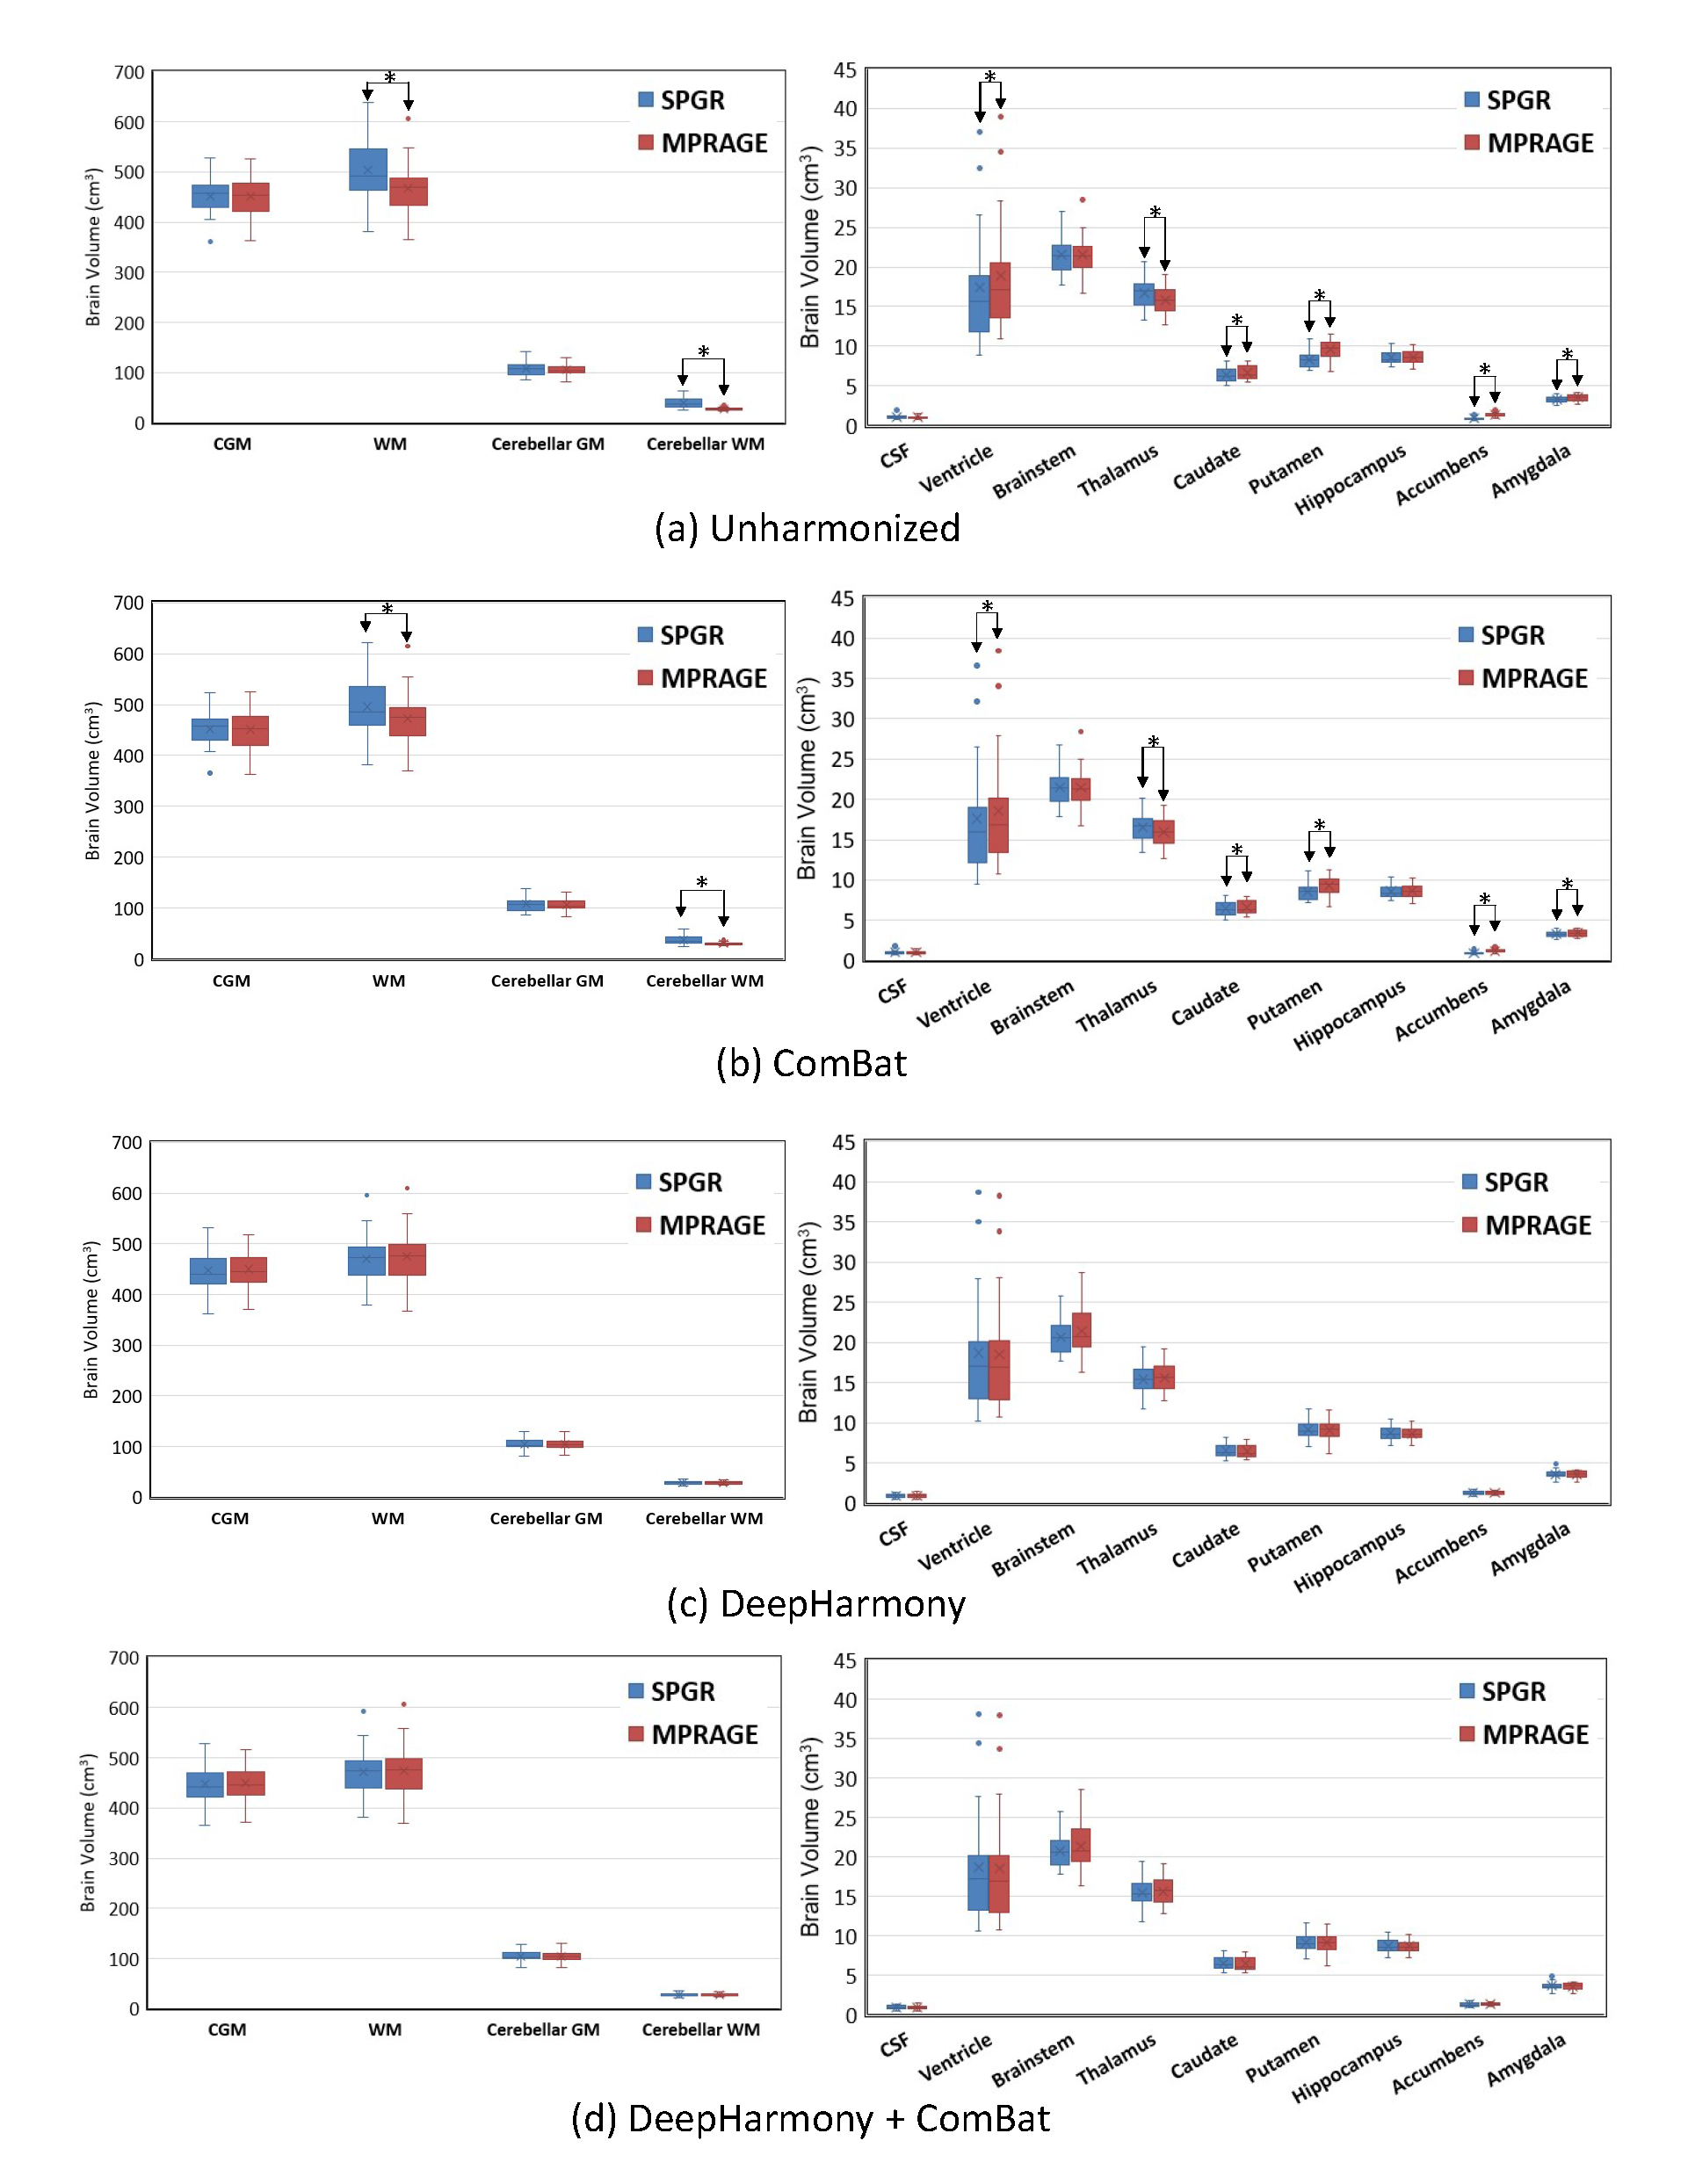
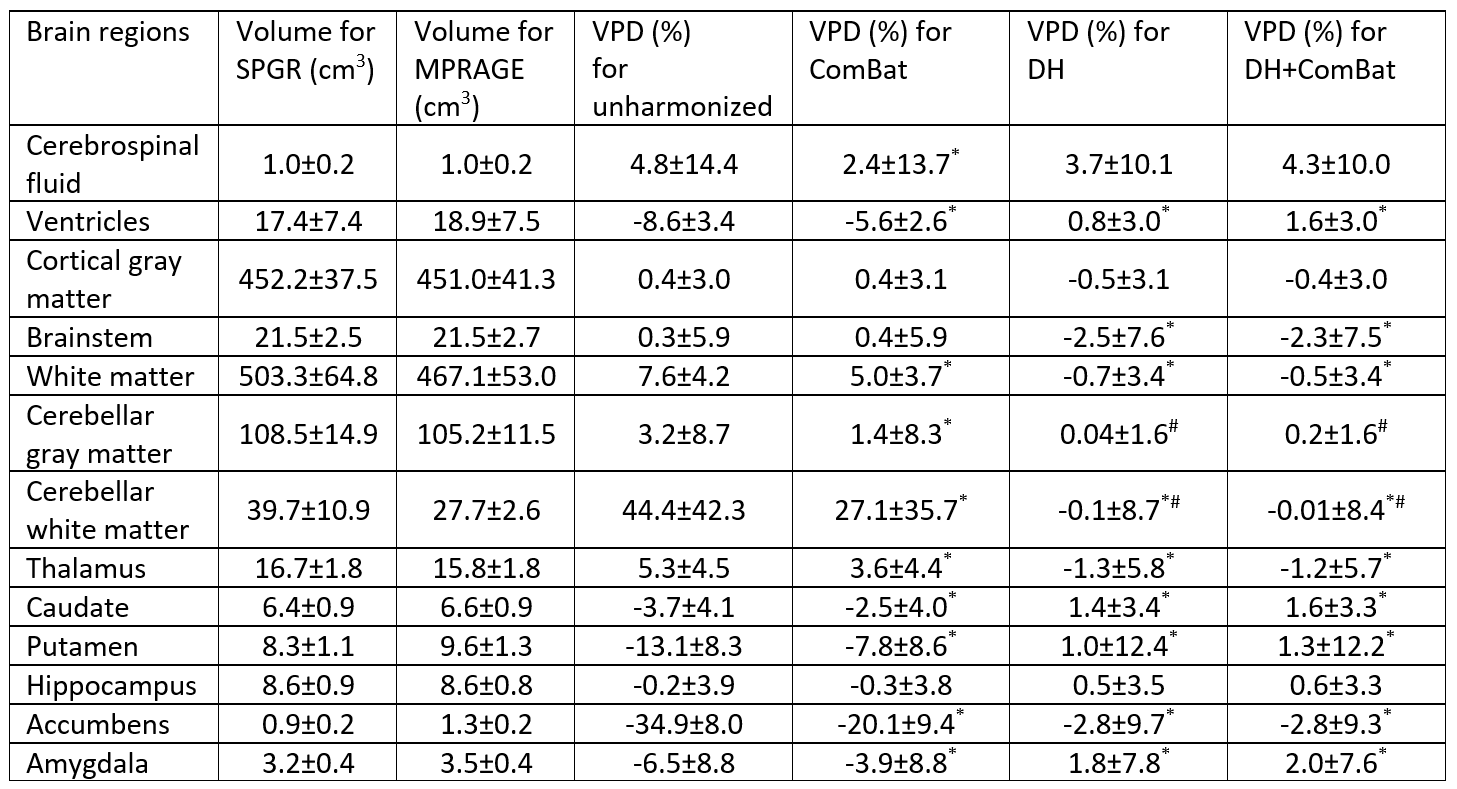
The execution time for DH training was about 10 hours per neural network model and was less than 1 minute for each testing scan synthesis, while the execution time for ComBat was less than 1 minute. Because DH applied with MPRAGE as the target contrast (Fig. 2a) was found to provide better consistency than SPGR as the target (Fig. 2b), we focus only on the MPRAGE target results in this section. The average volumes were significantly different in ventricles, white matter, cerebellar white matter, thalamus, caudate, putamen, accumbens, and amygdala between SPGR and MPRAGE for unharmonized images and for ComBat (Fig. 3a and 3b, padj<0.05). No significant volume differences were found between harmonized SPGR and MPRAGE for the DH and DH+ComBat methods (Fig. 3c and 3d). In terms of volume percentage, differences were significantly reduced in the ventricles, white matter, cerebellar white matter, thalamus, caudate, putamen, accumbens, and amygdala for the ComBat, DH, and DH+ComBat methods (Table 1). In addition, the variances of the volume percentage differences were also significantly lower in the cerebellar gray matter and cerebellar white matter for the DH and DH+ComBat methods (Table 1). When compared to the ComBat approach, the average volume percentage differences were significantly reduced in the ventricle, white matter, cerebellar white matter, thalamus, caudate, putamen, accumbens, and amygdala, and the variances of the volume percentage differences were also significantly reduced in the cerebellar gray matter and cerebellar white matter for the DH and DH+ComBat methods. These results indicated that DH method outperformed ComBat method in the targeted brain regions. DH and DH+ComBat performed similarly overall, with DH yielding slightly higher consistency in some structures, but lower in others.Discussion
Our results showed that the image-based DH approach produced better consistency of brain volume quantification across two different T1-weighted imaging protocols than ComBat. ComBat might have performed better if more data were available to estimate batch effects. A limitation of the DH approach is that it requires training with paired data to build the neural network models. Such data sets are often not available. The combination of both DH and ComBat did not yield conclusive improvements over DH alone. Another interesting result was that DH performed better using MPRAGE as a target contrast. This is likely due to the fact that FreeSurfer is better tuned for segmentation of MPRAGE images, which are more commonly used for structural imaging.Conclusion
We report, for the first time, a comparison between image-based neural network and statistical approaches for harmonization of brain volumes. DH demonstrated better consistency than ComBat alone and therefore may be preferred when paired training data are available.Acknowledgements
The authors have no conflicts of interest to report. This work was supported by funding from the National Multiple Sclerosis Society (RG-1907-34570), Congressionally Directed Medical Research Programs (W81XWH2010912), the Department of Defense in the Center for Neuroscience and Regenerative Medicine, and the intramural research program of the National Institutes of Health. The opinions and assertions expressed herein are those of the authors and do not reflect the official policy or position of the Uniformed Services University of the Health Sciences, Henry M. Jackson Foundation for the Advancement of Military Medicine Inc., the Department of Defense, or the U.S. Government.
References
1. Fortin J-P, Cullen N, Sheline YI, et al. Harmonization of cortical thickness measurements across scanners and sites. Neuroimage. 2018;167:104-120.2. Beer JC, Tustison NJ, Cook PA, et al. Longitudinal ComBat: A method for harmonizing longitudinal multi-scanner imaging data. Neuroimage. 2020;220:117129.
3. Johnson WE, Li C, Rabinovic A. Adjusting batch effects in microarray expression data using empirical Bayes methods. Biostatistics. 2006;8(1):118-127.
4. Dewey BE, Zhao C, Reinhold JC, et al. DeepHarmony: A deep learning approach to contrast harmonization across scanner changes. Magn Reson Imaging. 2019;64:160-170.
5. Xia Z, Steele SU, Bakshi A, et al. Assessment of Early Evidence of Multiple Sclerosis in a Prospective Study of Asymptomatic High-Risk Family Members. JAMA Neurol. 2017;74(3):293-300.
6. Tustison NJ, Avants BB, Cook PA, et al. N4ITK: improved N3 bias correction. IEEE Trans Med Imaging. 2010;29(6):1310-1320.
7. Avants BB, Tustison NJ, Stauffer M, Song G, Wu B, Gee JC. The Insight ToolKit image registration framework. Front Neuroinform. 2014;8:44.
Figures