3584
Comparison of myelin water fraction mapping on ex vivo human brain at 3T and 7T1Department of Biomedical Engineering, Zhejiang University, Hangzhou, China, 2China Brain Bank and Department of Neurology in Second Affiliated Hospital, Zhejiang University School of Medicine, Hangzhou, China, 3Department of Pathology, Zhejiang University, Hangzhou, China
Synopsis
Keywords: Quantitative Imaging, White Matter
Multi-echo gradient-echo (mGRE) is an important method to quantify myelin water fraction (MWF) of the human brain, but the results may depend on field strength given the difference in T2*. This study performed mGRE-based MWF on ex vivo human brain at high resolution at both 3T and 7T. We found MWF-derived from 7T showed higher measurements with lager standard deviations compared to those 3T, and the 3T and 7T results showed moderate agreement. These findings indicated the MWF mapping result was field-strength dependent and further validations were needed to support their reliability.
Introduction
Multi-echo gradient-echo (mGRE) images have been used to investigate myelin water fraction (MWF) using complex-value based models, and it has the advantage of higher acquisition efficiency and lower specific absorption rate than the multi-echo spin echo sequences1. However, the measurement may depend on field strength as the T2* relaxation time of myelin and other tissue components changed at different fields. Recently, 2D mGRE-based in vivo MWF study compared MWF at 3T and reported a good correlation between the 3T and 7T results, indicating the possibility of MWF at 7T 2. However, whether the results were reproducible at higher resolution and how the field strength effect may change MWF in the ex vivo human brain was unknown. Due to the death and fixation in the ex vivo samples 3 and the sensitivity of the complex-value based model, we expected an altered MWF measurement on ex vivo human brain compared to in vivo. In this work, we collected high-resolution 3D mGRE data of an ex vivo brain at 3T and 7T to characterized the differences in MWF under different field strengths.Methods
Data AcquisitionAn ex vivo brain sample (right hemisphere, 70 years old male) underwent 3T and 7T scans using a 3D mGRE sequence. The 3T data was acquired on a Siemens Prisma scanner with following parameters: field of view (FOV) = 192×192×128 mm3, spatial resolution = 1×1×1 mm3, TR = 65 ms, TE1 = 2.41 ms, ΔTE = 1.4 ms, number of echoes = 32, flip angle (FA) = 20°, bandwidth = 930 Hz/pixel, and total scan time = 19 min 16 sec. The 7T data was acquired on a Magnetom 7T scanner with following parameters: FOV = 192×192×128 mm3, spatial resolution = 1×1×1 mm3, TR = 52 ms, TE1 = 2.56 ms, ΔTE = 1.46 ms, number of echoes = 32, FA = 20°, bandwidth = 900 Hz/pixel, and total scan time = 14 min 35 sec.
The magnitude mGRE data were denoised using a non-local means filter4 and corrected for B0 inhomogeneity using voxel spread function5, 6. Since the raw signal of a voxel contains phase contribution from sources outside the voxel, rather than using the raw signal, we synthesized a local signal with magnitude M(𝑡) to eliminate background phase contribution from outside the voxel as follows7, 8: S(t)=M(t)e^{-i\frac{2}{3}\chi(t)\gamma B_{0}t} (1)
where χ was the volume susceptibility of the source, γ was the gyromagnetic ratio of hydrogen and 𝐵0 is the static field strength. The background phase removed signal, S(t), was fitted to the three-component complex-valued model as follows8:
S(t) =[A_{my}e^{-(1/T_2,my^\star+j2\pi f_{my})}+A_{ax}e^{-(1/T_2,ax^\star+j2\pi f_{ax})}+e^{-(1/T_2,ex^\star+j2\pi f_{ex})}]e^{j\phi_{0}} (2)
where A_{my}, A_{ax} and A_{ex} are the amplitudes of the myelin, intra- and extra-axon components, T_2,my^\star , T_2,ax^\star and T_2,ex^\star are values of the three water components, and f_{my}, f_{ax} and f_{ex} are the frequency offsets of the three water components. It should be noted that we assume no background noise in the frequency terms. The MWF calculated as A_{my}/(A_{my}+ A_{ax} + A_{ex}).
MWFs derived from 3T and 7T were compared in twelve white matter regions of interest (ROI) by atlas-based segmentation9, 10, including pontine crossing tract (PCT), genu of corpus callosum (GCC), body of corpus callosum (BCC), splenium of corpus callosum (SCC), corticospinal tract (CST), anterior/posterior limb of internal capsule (ALIC/PLIC), anterior/superior/posterior corona radiate (ACR/SCR/PCR), superior longitudinal fasciculus (SLF) and superior fronto-occipital fasciculus (SFOF) .
Results
After denoising and B0 inhomogeneity correction, the boundaries and small structures of the white matter in both 3T MWF and 7T MWF were all well preserved, compared to those without preprocessing (Fig. 1). Most areas in 7T MWF showed higher values and larger standard deviations than 3T MWF. ROI-based quantitative analysis showed that MWFs derived from 7T were significantly higher than that from 3T in almost all white matter ROIs (two tailed t-test, p < 0.01), except for CST and SFOF. A moderate positive correlation between the 3T and 7T measurements (mean value across 12 ROIs) was observed (Pearson’s correlation coefficient, r = 0.589) (Fig. 3a). Quantitative analysis with Bland-Altman plots indicated that the mean of the differences and the 95% limits of agreement between 3T MWF and 7T MWF were -0.023 ± 0.0185 (Fig.3b), indicating there was region-specific bias between the two measurements.Discussion and Conclusion
We demonstrated the differences of MWF between 3T and 7T in an ex vivo hemi-brain. The significantly higher MWF measurements at 7T indicated that higher field strengths leaded to an overestimation of the MWF, which was consistent with the findings of the in vivo study2. Compared to the in vivo MWF studies of human brain at 3T2, 8, 11, the ex vivo brain showed higher MWF. In addition, we reported mGRE-based MWF mapping of the ex vivo human brain (entire hemisphere) for the first time. We found MWF in some of white matter ROIs were higher than the reported values in previous in vivo study 2, e.g., for PLIC, but our measurements were largely consistent with other ex vivo studies 3, 12. Future studies will perform in vivo experiment with the same acquisition and fitting procedures for a direction comparison of in vivo and ex vivo MWF at different filed strength.Acknowledgements
No acknowledgement found.References
1. Du, Y.P., et al., Fast multislice mapping of the myelin water fraction using multicompartment analysis of T decay at 3T: A preliminary postmortem study. 2007. 58(5): p. 865-870.
2. Shin, H.-G., et al., Advances in gradient echo myelin water imaging at 3T and 7T. 2019. 188: p. 835-844.
3. Laule, C., et al., Myelin water imaging of multiple sclerosis at 7 T: correlations with histopathology. 2008. 40(4): p. 1575-1580.
4. Alonso-Ortiz, E., I.R. Levesque, and G.B.J.N. Pike, Impact of magnetic susceptibility anisotropy at 3 T and 7 T on T2*-based myelin water fraction imaging. 2018. 182: p. 370-378.
5. Jung, S., et al., Improved multi‐echo gradient echo myelin water fraction mapping using complex‐valued neural network analysis. 2022. 88(1): p. 492-500.
6. Yablonskiy, D.A., et al., Voxel spread function method for correction of magnetic field inhomogeneity effects in quantitative gradient‐echo‐based MRI. 2013. 70(5): p. 1283-1292.
7. Chen, J., et al., Decompose quantitative susceptibility mapping (QSM) to sub-voxel diamagnetic and paramagnetic components based on gradient-echo MRI data. 2021. 242: p. 118477.
8. Wu, Z., et al., High resolution myelin water imaging incorporating local tissue susceptibility analysis. 2017. 42: p. 107-113.
9. Hua, K., et al., Tract probability maps in stereotaxic spaces: analyses of white matter anatomy and tract-specific quantification. 2008. 39(1): p. 336-347.
10. Wakana, S., et al., Reproducibility of quantitative tractography methods applied to cerebral white matter. 2007. 36(3): p. 630-644.
11. Lee, H., Y. Nam, and D.H.J.M.R.i.M. Kim, Echo time‐range effects on gradient‐echo based myelin water fraction mapping at 3T. 2019. 81(4): p. 2799-2807.
12. Prevost, V.H., et al., Temperature dependence and histological correlation of inhomogeneous magnetization transfer and myelin water imaging in ex vivo brain. 2021. 236: p. 118046.
Figures
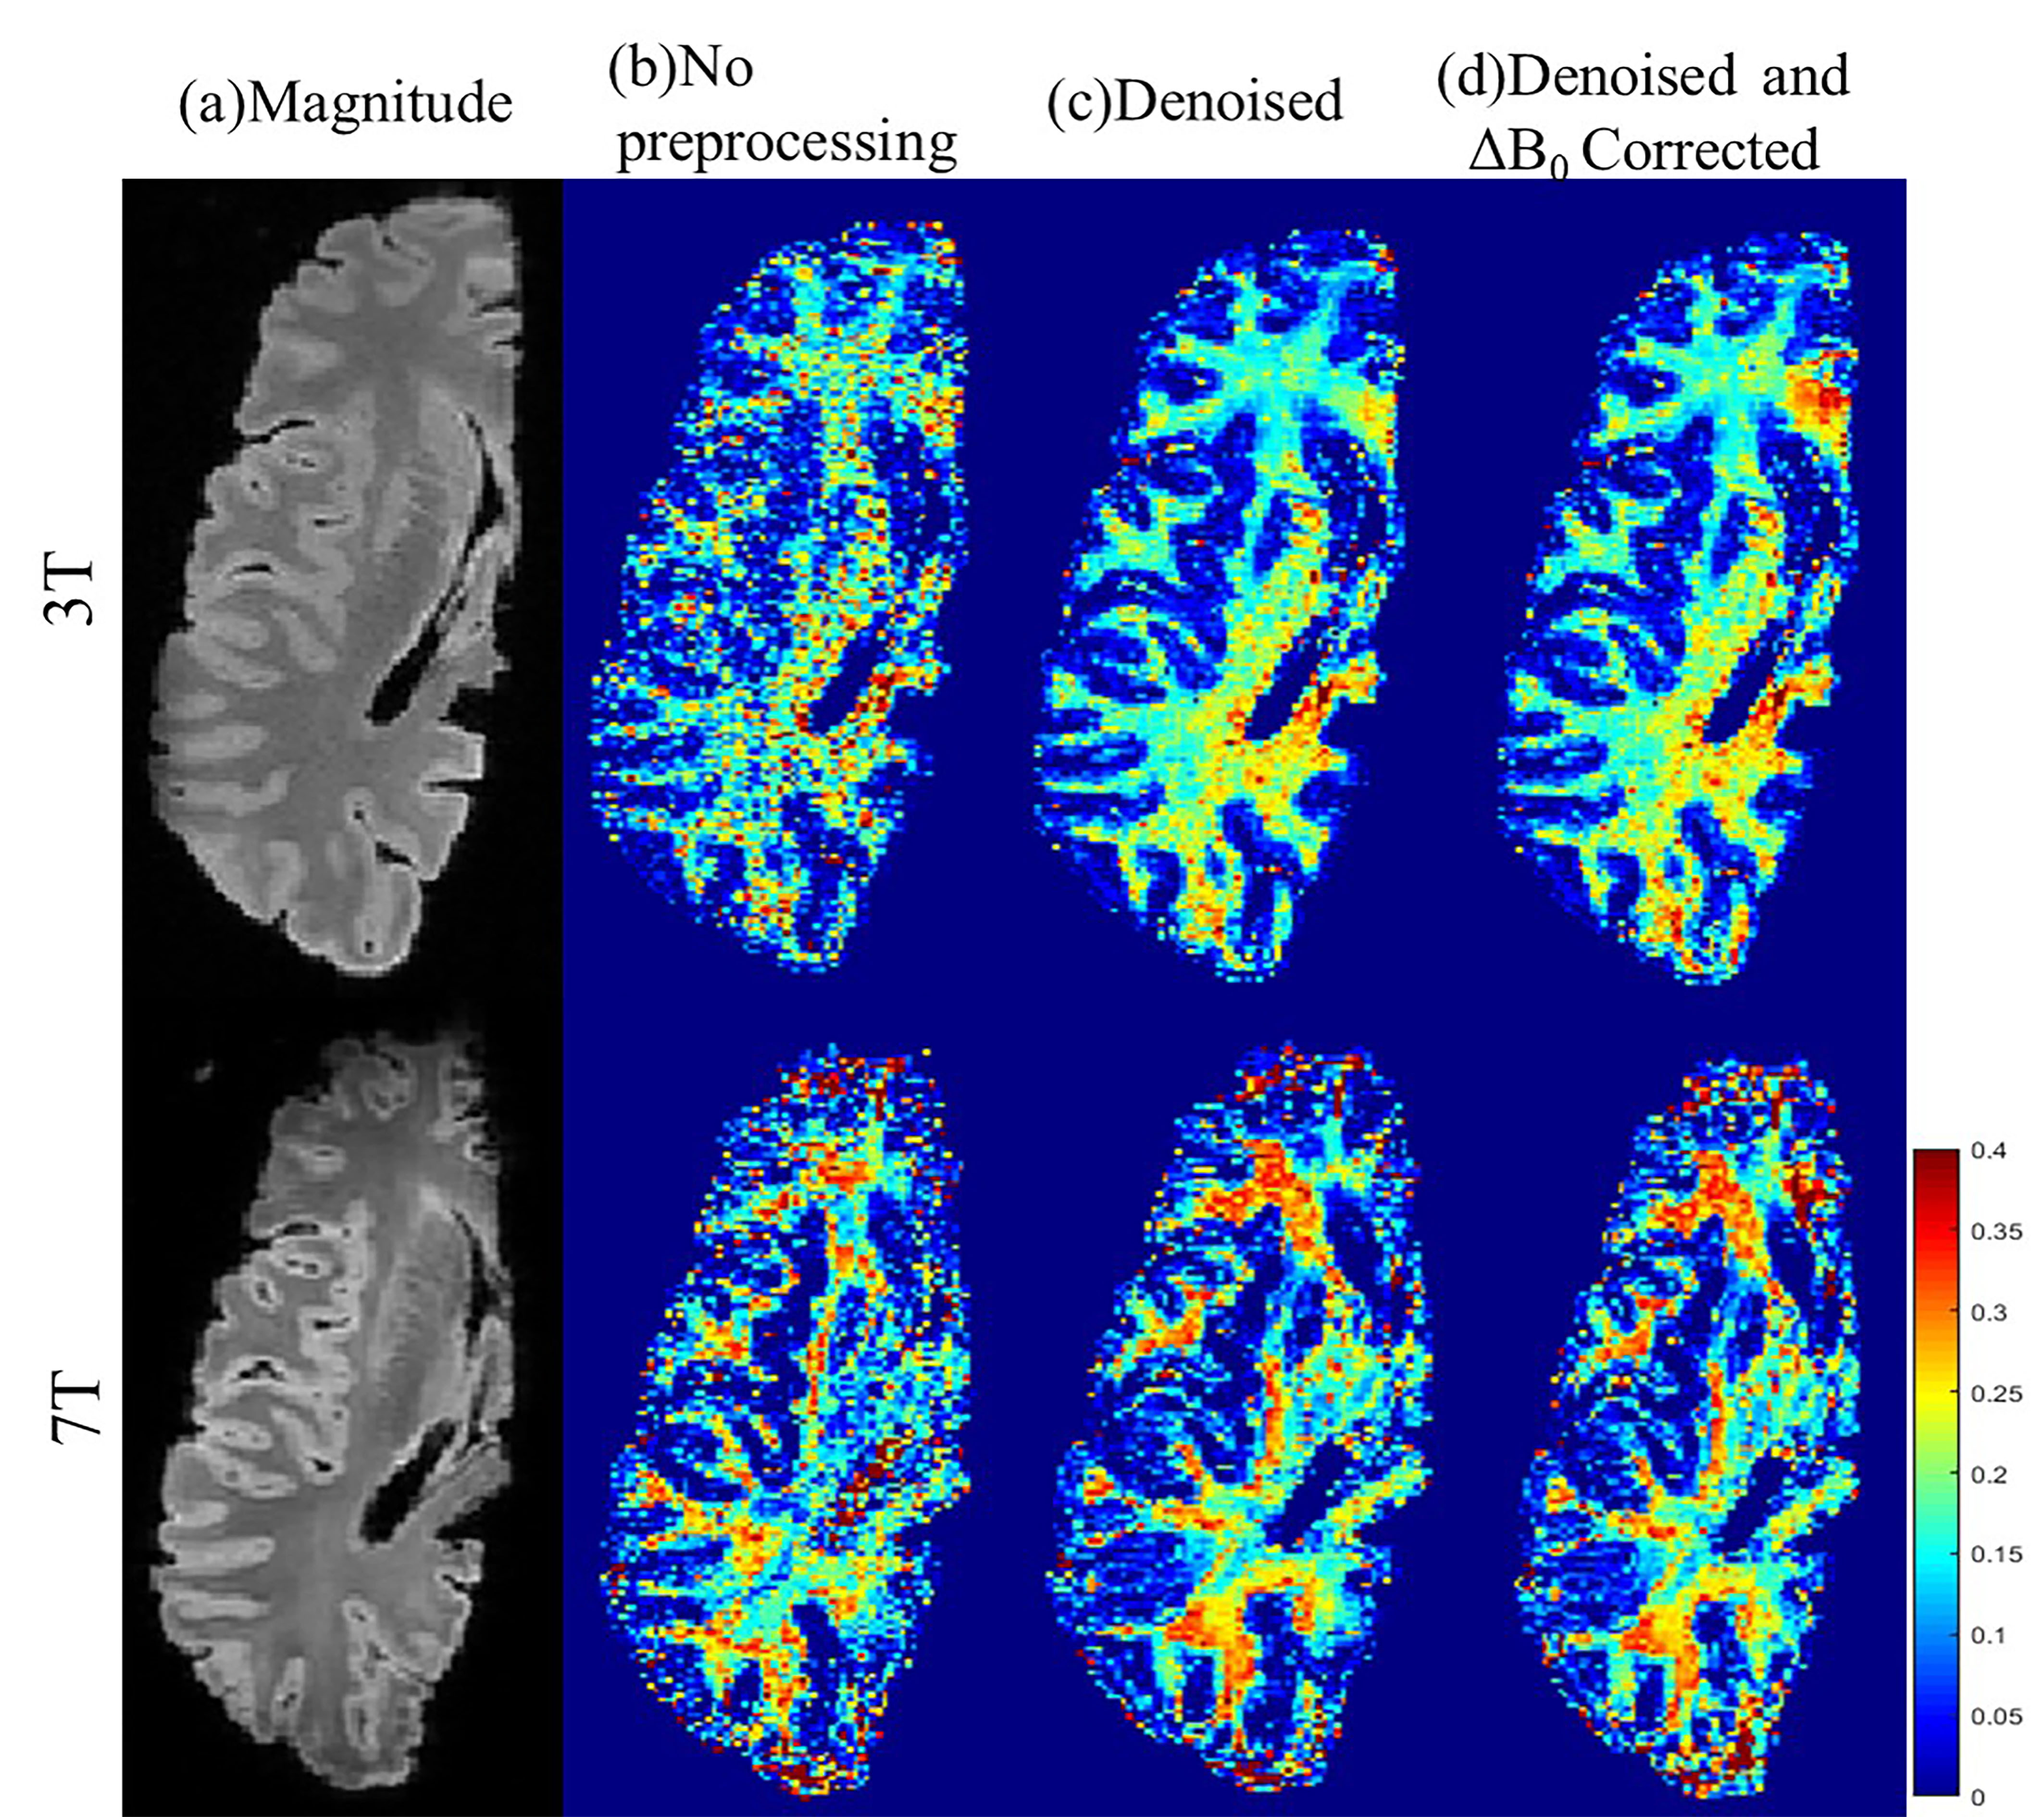
Fig.1. Effect of preprocessing steps on MWF mapping at 3T and 7T. (a) Magnitude images, (b) No preprocessing, (c) Denoised, (d) Denoised and B0 inhomogeneity corrected.
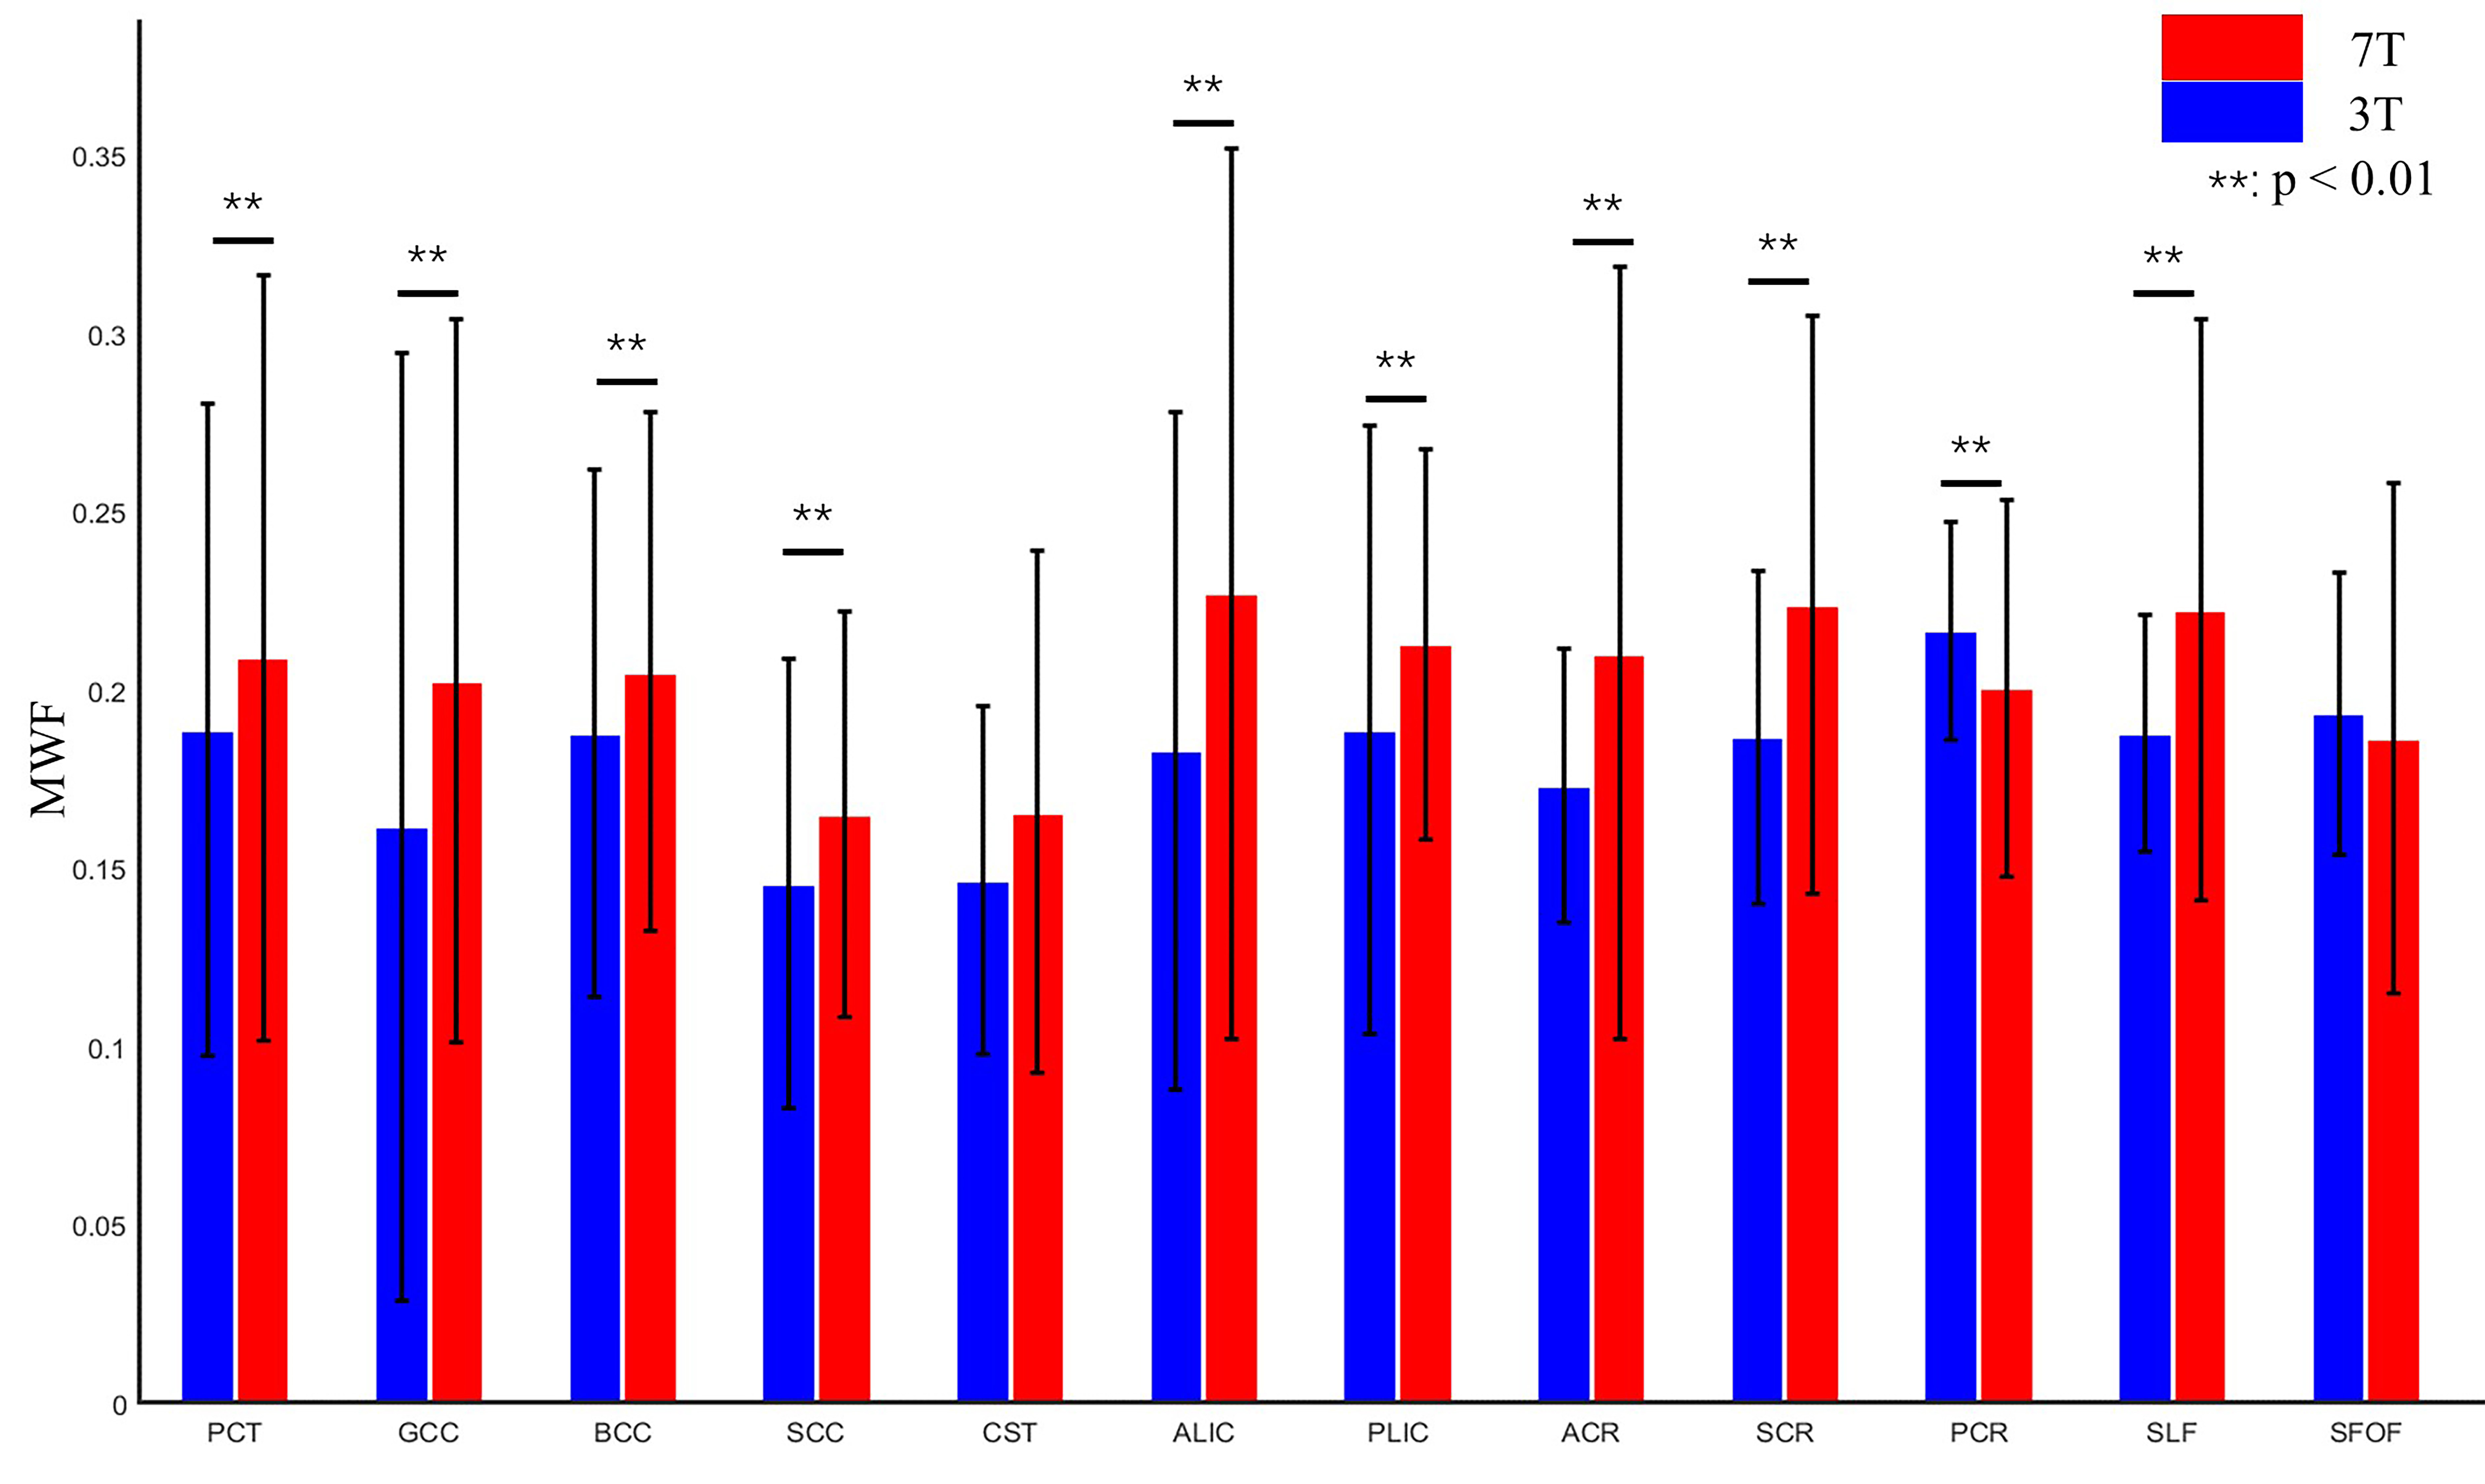
Fig. 2. 3T MWFs (blue) and 7T MWFs (red) in 12 white matter ROIs. **p < 0.01 by paired t-test. PCT: pontine crossing tract; GCC: genu of corpus callosum; BCC: body of corpus callosum; SCC: splenium of corpus callosum; CST: corticospinal tract; ALIC/PLIC: anterior/posterior limb of internal capsule; ACR/SCR/PCR: anterior/superior/posterior corona radiate; SLF: superior longitudinal fasciculus; SFOF: superior fronto-occipital fasciculus.
