3583
Quantitative Myelin Water Imaging Using Short TR Adiabatic Inversion Recovery Prepared FSE (STAIR-FSE) and EPI (STAIR-EPI) Sequences1Radiology, UC San Diego, San Diego, CA, United States, 2Bioengineering, UC San Diego, San Diego, CA, United States, 3Radiology Service, Veterans Affairs San Diego Healthcare System, San Diego, CA, United States
Synopsis
Keywords: Multiple Sclerosis, Multiple Sclerosis, Myelin water
Myelin water imaging (MWI) techniques have shown great promise for the early detection of demyelination and monitoring the effectiveness of neuroprotective therapies in remyelination. The purpose of this study is to develop new clinical transitional MWI techniques, which employ a short TR adiabatic inversion recovery (STAIR) preparation in combination with clinical FSE and EPI acquisitions. Quantified apparent myelin water fractions (aMWFs) show myelin loss in lesions and normal-appearing white matter (NAWM) in patients with multiple sclerosis compared to normal white matter (NWM) in healthy volunteers, demonstrating their potential in clinical practice.Introduction
Clinical T1 and T2-weighted sequences have a high sensitivity for detecting brain abnormalities in patients with multiple sclerosis (MS). However, they are poor at differentiating pathological processes such as inflammation, edema, axonal loss, gliosis, demyelination, and remyelination (1,2).To improve the specificity of MRI in detecting myelin changes in MS, researchers have developed techniques to image and quantify myelin water in the brain (3–9). Myelin water is tightly trapped between myelin lipid layers, and has shorter T2 and T1 values compared with intra/extra-cellular water. Because of this close structural relationship between myelin and myelin water, assessment of myelin water changes is able to provide useful information about demyelination and remyelination (5,9). Myelin water fraction (MWF), which is defined as the proportion of short T2 water signal to the total water, is an MR imaging biomarker that has shown promise for the evaluation of changes in myelin content (3,4).
Recently, Ma et al. have developed a new MWI technique which uses a short TR adiabatic inversion recovery (STAIR) preparation in combination with a 3D Cones acquisition (10). This STAIR technique suppresses signals from longer T2 water components with a wide range of T1s while preserving signals from short T1 myelin water (10–12). The technique provides whole brain MWI and quantification in clinically feasible scan times. The measured apparent MWF (aMWF) in MS lesions was significantly lower than that in normal white matter (NWM) of a control group (10). However, 3D Cones is mainly installed on GE scanners and not widely clinically available. This limits transition of the STAIR technique to the clinical domain.
In this study, we aimed to develop two new clinical MWI techniques by combining the STAIR preparation with two widely available clinical acquisitions i.e., FSE and EPI to provide more accessible whole brain water myelin imaging and quantification.
Methods
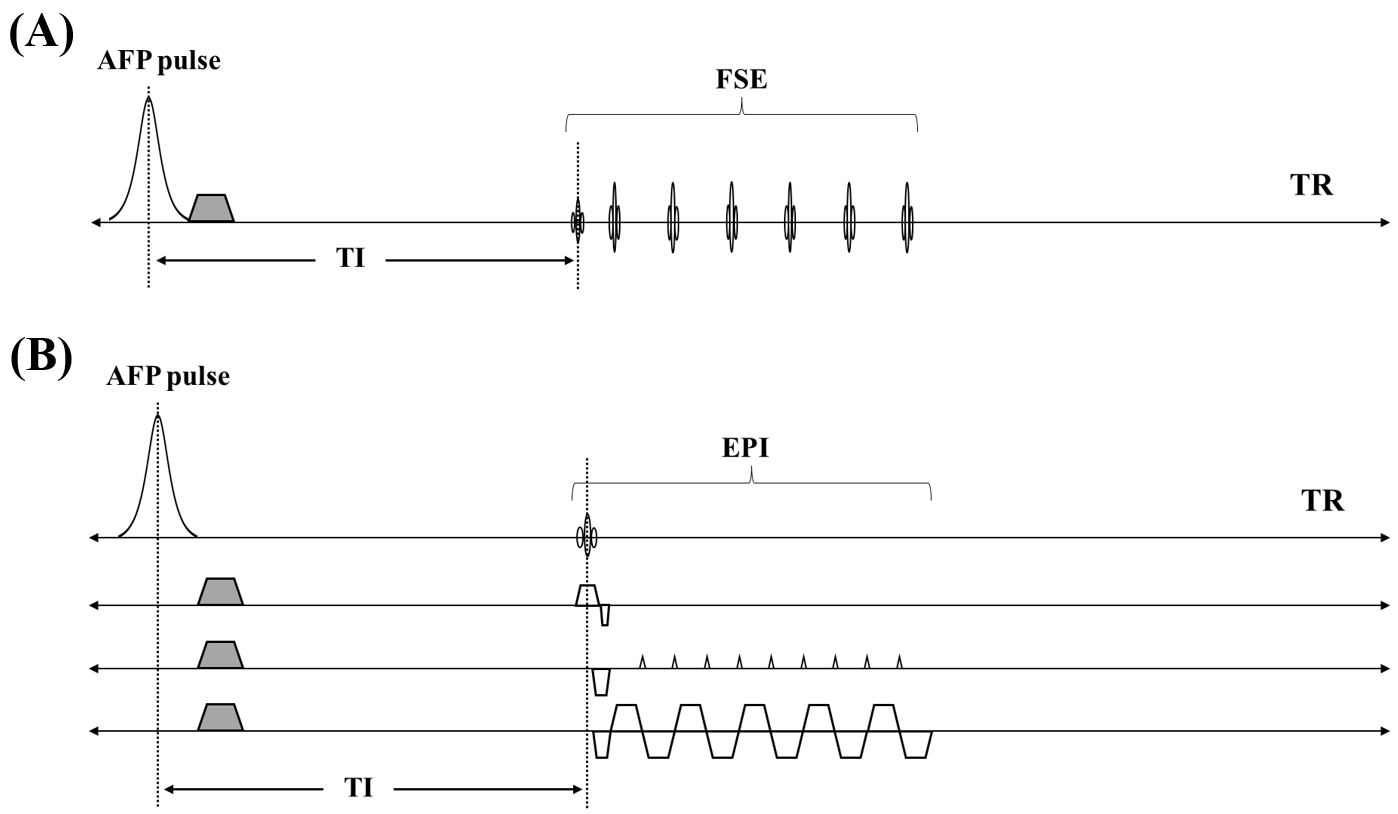
Three healthy volunteers (25-32 years-of-age) and three patients with MS (48-57 years-of-age) underwent MRI scans on a 3T clinical GE scanner. Informed consent was obtained from all the participants by guidelines issued following the local Institutional Review Board (IRB).Figure 1 shows the STAIR-FSE and STAIR-EPI sequences. In these two STAIR-type sequences, an adiabatic full passage (AFP) pulse and a short TR (e.g., ≤300ms) are used together with an optimized inversion time (TI) to provide robust long T2 water signal suppression (10). The FSE and EPI acquisitions provide fast data collection of the unsuppressed myelin water signals.
To facilitate the quantification of aMWF, proton density-weighted FSE (PD-FSE) and EPI (PD-FSE) sequences were also scanned for total water imaging. aMWF is defined as the ratio of the signal from myelin water to that from the total water of the brain (10). A T2-FLAIR sequence was also performed for clinical comparison.
The key parameters of the STAIR and PD sequences were as follows: i) STAIR-EPI: TR/TI/TE=250/117/5.5ms, flip angle(FA)=90°, number-of-shots=8, matrix=128×128, scan time=15min; ii) PD-EPI: TR/TE=250/5.5ms, FA=5°, scan time=43s; iii) STAIR-FSE: TR/TI/TE=300/105/6.8ms, echo-train-length (ETL)=8, matrix=140×140, scan time=10min; vi) PD-FSE: TR/TE=8000/6.8ms, scan time=1min44s. The FOV and slice thickness for all the sequences were 22cm and 5mm.
ROIs were drawn around the MS lesions and at eight different non-lesional white matter regions (i.e., left and right centrum semiovale, subcortical white matter and periventricular regions, as well as splenium and genu of the corpus callosum) for all the subjects to measure aMWFs. We compared the aMWFs of NWM in the healthy volunteers to normal appearing WM regions (NAWM) and MS lesions in the patients with MS.
The one way ANOVA test was performed to evaluate group difference in aMWFs after checking the normal distribution using the Kolmogorov–Smirnov test. A post hoc test (Games-Howell test) was also performed for paired comparisons between each of the two groups.
Results and Discussions
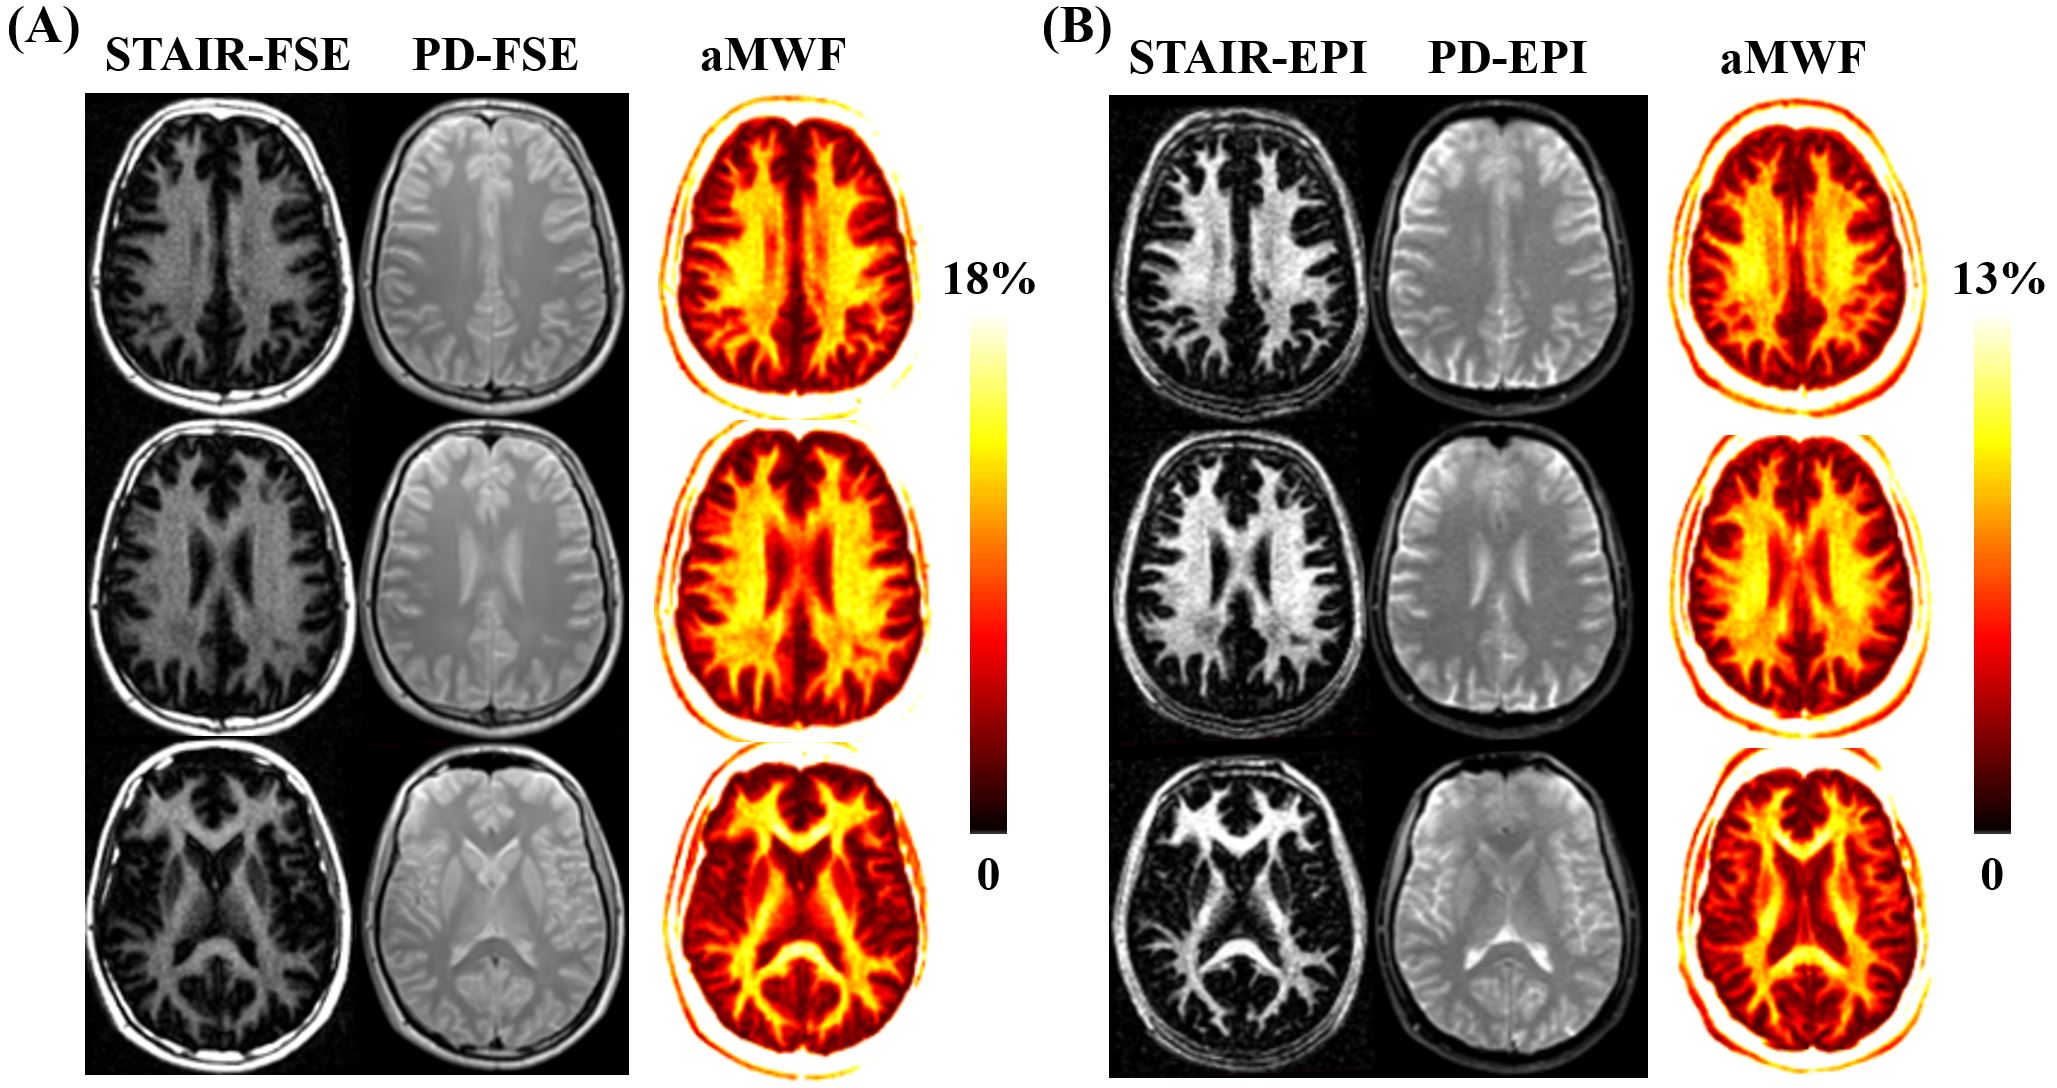
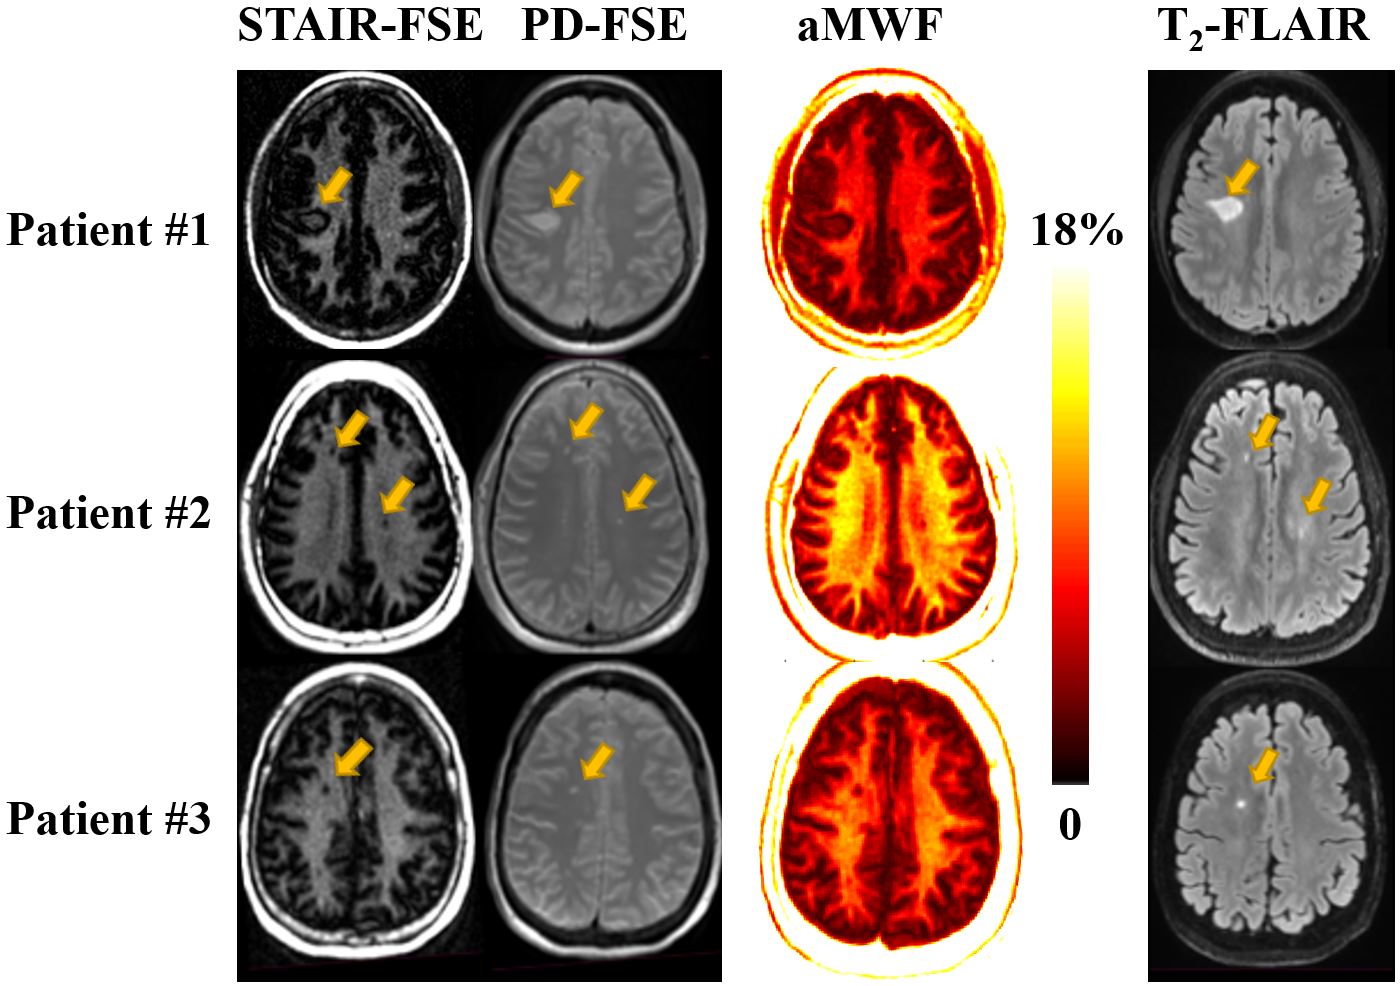
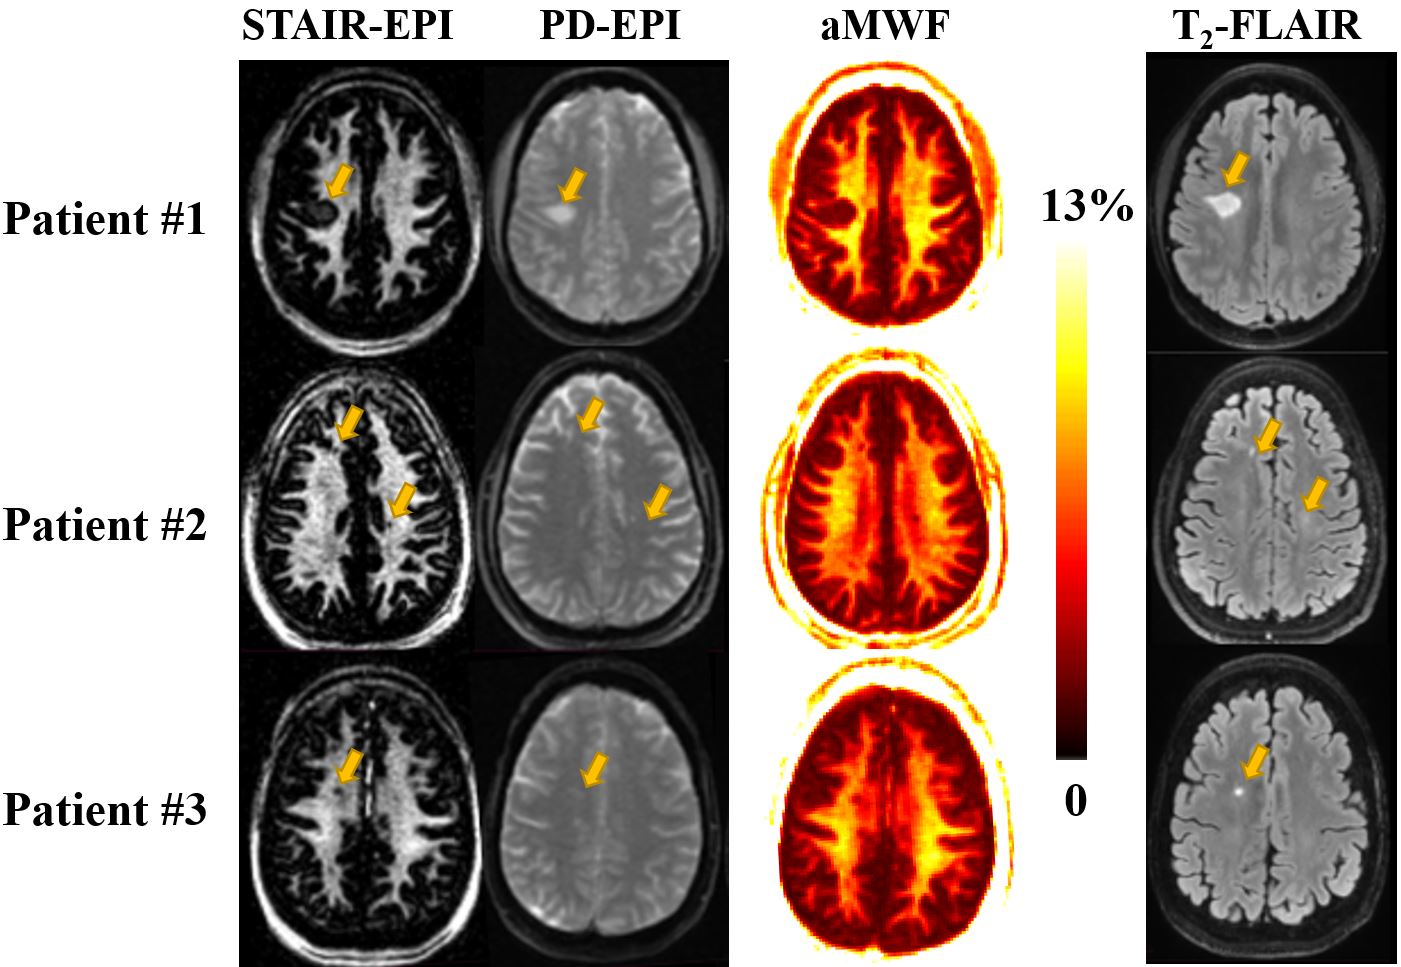
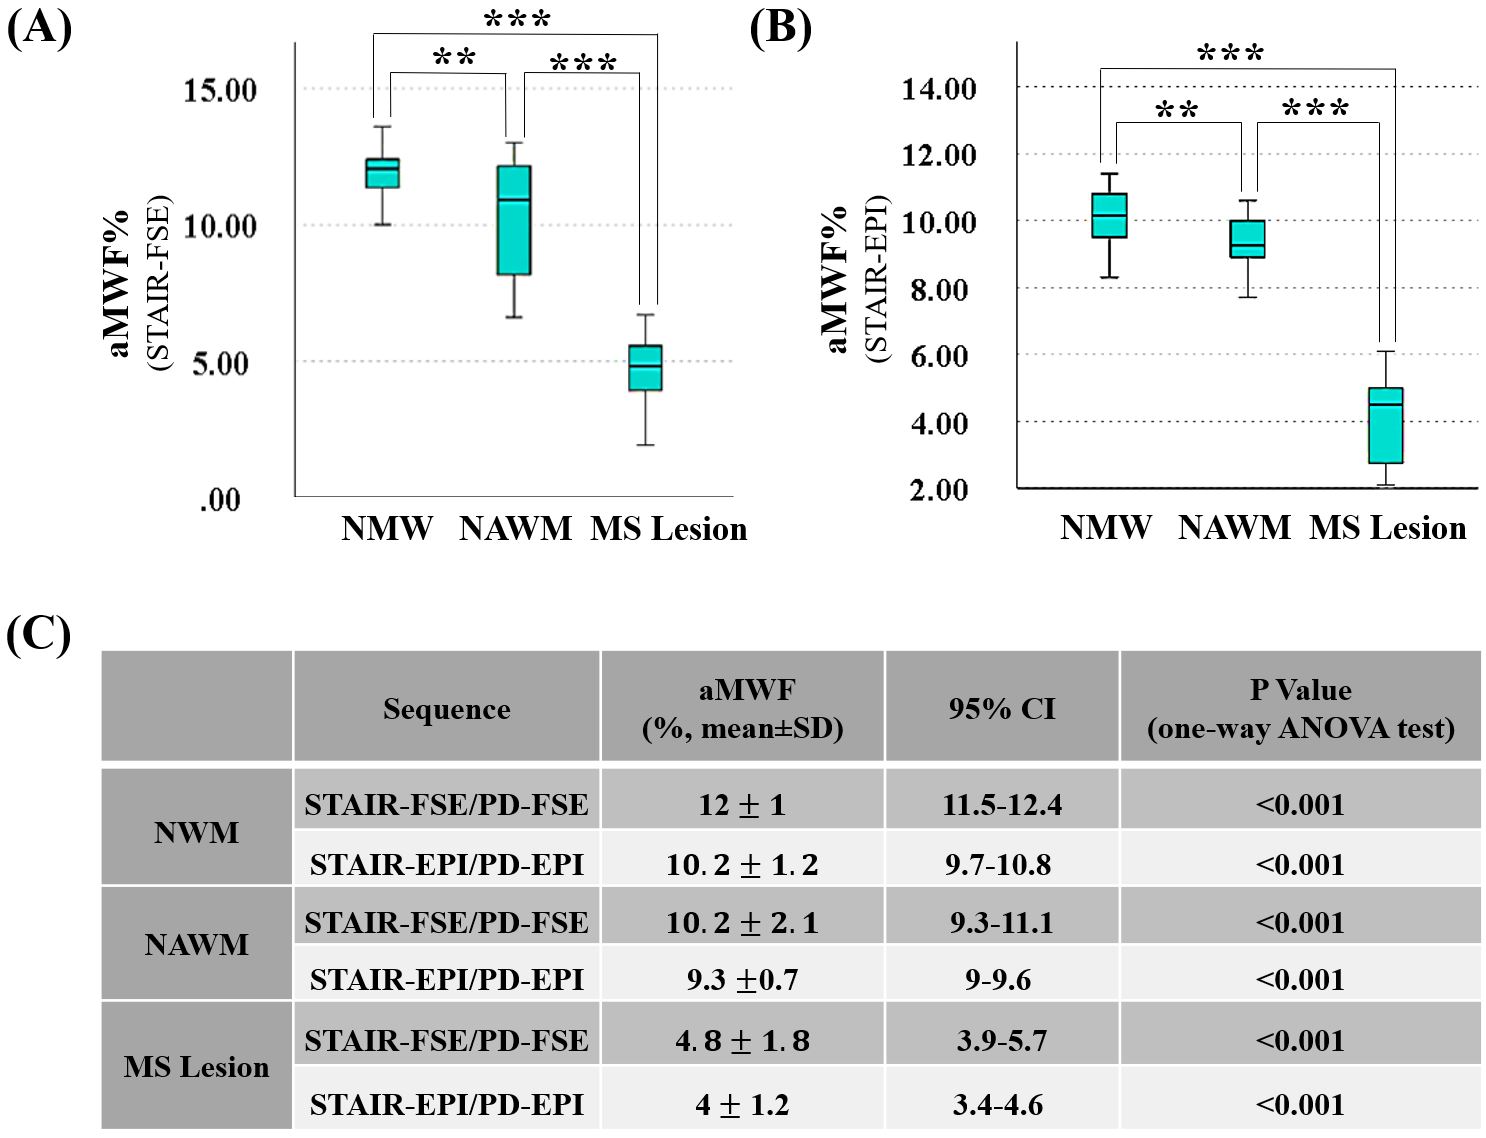
Figure 2 shows representative myelin water images and aMWF maps obtained with the STAIR-FSE and STAIR-EPI sequences in a healthy volunteer. White matter regions have a much higher myelin water content than gray matter regions. In general, aMWF estimated with the STAIR-EPI technique is lower than that estimated with the STAIR-FSE technique, which may be because of myelin water signal loss with the GRE type EPI sequence. Figures 3 and 4 show myelin water images and aMWF maps in the three patients with MS. Hyperintense lesions detected on T2-FLAIR images show a clear signal loss in both the STAIR-FSE and STAIR-EPI images as well as in the corresponding aMWF maps.Figures 5A and 5B show paired comparisons between groups. Significant differences are seen for both STAIR-FSE and STAIR-EPI measured aMWFs between each of the two groups (P<0.05). Figure 5C summarizes the mean and standard deviation (SD) values of aMWF for all the subjects measured by both the STAIR-FSE and STAIR-FSE techniques. The aMWF values of the MS lesions (FSE: 4.8±1.8% and EPI: 4±1.2%) and NAWM (FSE: 10.2±2.1% and EPI: 9.3 ±0.7%) in patients with MS are significantly lower than those of NWM (FSE: 12±1% and EPI: 10.2±1.2%) in healthy volunteers (P<0.01).
Conclusion
STAIR preparation in combination with clinical FSE and EPI acquisitions is able to detect myelin water loss in MS patients. This is likely to facilitate transition of the STAIR approach for imaging myelin water into clinical practice.Acknowledgements
The authors acknowledge grant support from the National Institutes of Health (R01AR062581, R01AR068987, R01AR075825, R01AR079484, R01AR078877, RF1AG075717, and R21AR075851), VA Clinical Science and Rehabilitation Research and Development Services (Merit Awards I01CX001388, I01CX002211, and I01RX002604), DFG (SE 3272/1-1) and GE Healthcare.References
1. Filippi M, Rocca MA. MR imaging of multiple sclerosis. Radiology [Internet]. 2011 Jun [cited 2022 Nov 6];259(3):659–81.
2. Faizy TD, Thaler C, Kumar D, Sedlacik J, Broocks G, Grosser M, et al. Heterogeneity of multiple sclerosis lesions in multislice myelin water imaging. PLoS One. 2016 Mar 1;11(3).
3. MacKay AL, Laule C. Magnetic Resonance of Myelin Water: An in vivo Marker for Myelin. Brain Plast [Internet]. 2016 Nov 22 [cited 2022 Nov 7];2(1):71–91.
4. Alonso-Ortiz E, Levesque IR, Pike GB. MRI-based myelin water imaging: A technical review. Magn Reson Med [Internet]. 2015 Jan 1 [cited 2022 Nov 7];73(1):70–81.
5. Does MD. Inferring brain tissue composition and microstructure via MR relaxometry. Neuroimage [Internet]. 2018 Nov 15 [cited 2022 Nov 7];182:136–48.
6. Du YP, Chu R, Hwang D, Brown MS, Kleinschmidt-DeMasters BK, Singel D, et al. Fast multislice mapping of the myelin water fraction using multicompartment analysis of T decay at 3T: A preliminary postmortem study. Magn Reson Med [Internet]. 2007 Nov 1 [cited 2022 Nov 7];58(5):865–70.
7. Deoni SCL, Rutt BK, Arun T, Pierpaoli C, Jones DK. Gleaning multicomponent T1 and T2 information from steady-state imaging data. Magn Reson Med [Internet]. 2008 Dec 1 [cited 2022 Nov 7];60(6):1372–87.
8. Oh SH, Bilello M, Schindler M, Markowitz CE, Detre JA, Lee J. Direct Visualization of Short Transverse Relaxation Time Component (ViSTa). Neuroimage [Internet]. 2013 Dec [cited 2022 Nov 7];83:485–92.
9. Möller HE, Bossoni L, Connor JR, Crichton RR, Does MD, Ward RJ, et al. Iron, Myelin, and the Brain: Neuroimaging Meets Neurobiology. Trends Neurosci [Internet]. 2019 Jun 1 [cited 2022 Nov 7];42(6):384–401.
10. Ma YJ, Jang H, Lombardi AF, Corey-Bloom J, Bydder GM. Myelin water imaging using a short-TR adiabatic inversion-recovery (STAIR) sequence. Magn Reson Med [Internet]. 2022 Sep 1 [cited 2022 Nov 7];88(3):1156–69.
11. Ma YJ, Jang H, Wei Z, Wu M, Chang EY, Corey-Bloom J, et al. Brain Ultrashort T2 Component imaging using a Short TR Adiabatic Inversion Recovery Prepared Dual-Echo Ultrashort TE sequence with Complex Echo Subtraction (STAIR-dUTE-ES). J Magn Reson [Internet]. 2021 Feb 1 [cited 2022 Nov 7];323:106898.
12. Ma YJ, Jang H, Wei Z, Cai Z, Xue Y, Lee RR, et al. Myelin imaging in human brain using a short repetition time adiabatic inversion recovery prepared ultrashort echo time (STAIR-UTE) MRI sequence in multiple sclerosis. Radiology [Internet]. 2020 Nov 1 [cited 2022 Nov 7];297(2):392–404.
Figures