3582
Myelin Measurement: Comparison Between Simultaneous Relaxometry, Inhomogeneous Magnetization Transfer Imaging, and Myelin Water Fraction1Department of Radiology, Juntendo University, Tokyo, Japan, 2Department of Radiology, The University of Tokyo, Tokyo, Japan, 3Canon Medical Systems Corporation, Kawasaki, Japan, 4Department of Neurology, Juntendo University, Tokyo, Japan, 5Department of Radiology, Toho University Omori Medical Center, Tokyo, Japan
Synopsis
Keywords: Multiple Sclerosis, Validation
In 16 healthy adults, we examined the correlation between three MR myelin measurement methods, including myelin volume fraction (MVF) measured with simultaneous tissue relaxometry of R1 and R2 relaxation rates and proton density, inhomogeneous magnetization transfer imaging (ihMT), and myelin water fraction (MWF). A strong correlation was obtained between ihMT and MVF, and MWF was less correlated with the others. We should be mindful that these metrics are measuring different aspects of “myelin”.INTRODUCTION
Measurement of myelin in the brain by MRI is important for evaluating the development, aging, and progression of degenerative and demyelinating diseases1–3. In recent years, rapid simultaneous relaxometry (SyMRI) based on a single pulse sequence was developed, making it possible to estimate myelin volume fraction (MVF) within a voxel4 in addition to other quantitative values and synthetic contrast-enhanced images5 based on the obtained quantitative values6, eliminating the need to obtain these images separately. Hagiwara et al. previously compared SyMRI myelin map with MT saturation index (MTsat)7, though not with ihMT and MWF, which are known to be more specific to myelin than MTsat8,9. Further, their study was based on two-dimensional SyMRI, and the recently available three-dimensional SyMRI myelin map using 3D-QALAS (3D-quantication using an interleaved Look-Locker acquisition sequence with T2 preparation pulse) sequence has not been compared with other myelin imaging methods. Therefore, the purpose of this study was to investigate the correlation between the three-dimensional SyMRI myelin measurement method, ihMT, and MWF.METHODS
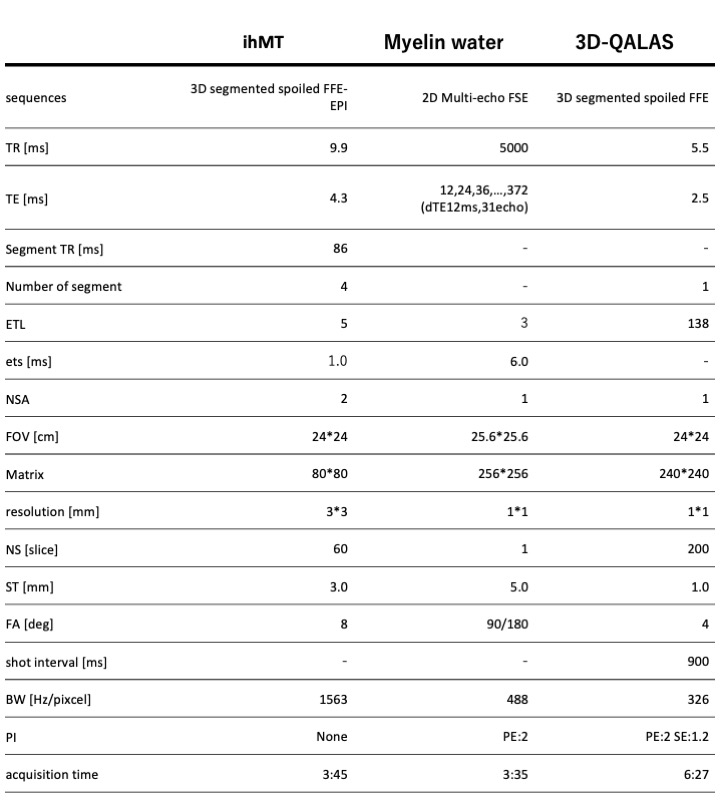
Participants and MRI: 16 healthy volunteers (2 male and 14 female, mean age 36.8 years, age range 28–62 years) were included in this study, and scanned by SyMRI, MWF, and ihMT imaging (Table 1) on a 3-T MR scanner (Vantage Centurian, Canon Medical Systems, Tochigi, Japan). For the MWF, images were acquired with 5 mm thickness at the level of the centrum semiovale and basal ganglia. Other sequences covered the whole brain. MVF was calculated automatically based on the R1, R2, and proton density on SyMRI software (a prototype version 0.45.36, SyntheticMR, Linkoping, Sweden). We used JHU ICBM-DTI-81 white-matter atlas and AAL as white matter (WM) and gray matter (GM) ROIs, respectively. We warped the ROIs to each metric map from the Montreal Neurological Institute space using FSL. To remove the partial volume effects, we segmented synthetic T1-weighted image into WM, GM, and CSF using FMRIB’s Automated Segmentation Tool (FAST)10. WM and GM probability maps were thresholded at 0.95 and used as masks to be applied to MVF, ihMT, and MWF before performing ROI analysis. For subcortical GM ROI, we combined WM and GM before thresholding. Upon ROI analysis, the mean values were recorded in the two slices with avaliable MWF for all three myelin metric maps. We used the Spearman rank order correlation coefficient to investigate the correlation among these myelin metrics for WM, subcortical GM, and cortical GM. Spearman’s ρ correlation coefficients were classified by using the following definitions: 0–0.10, negligible; 0.10–0.39, weak; 0.40–0.69, moderate; 0.70–0.89, strong; and 0.90–1.00, very strong11.RESULTS
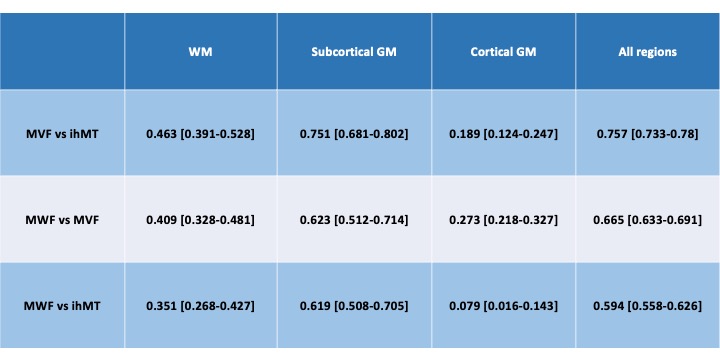
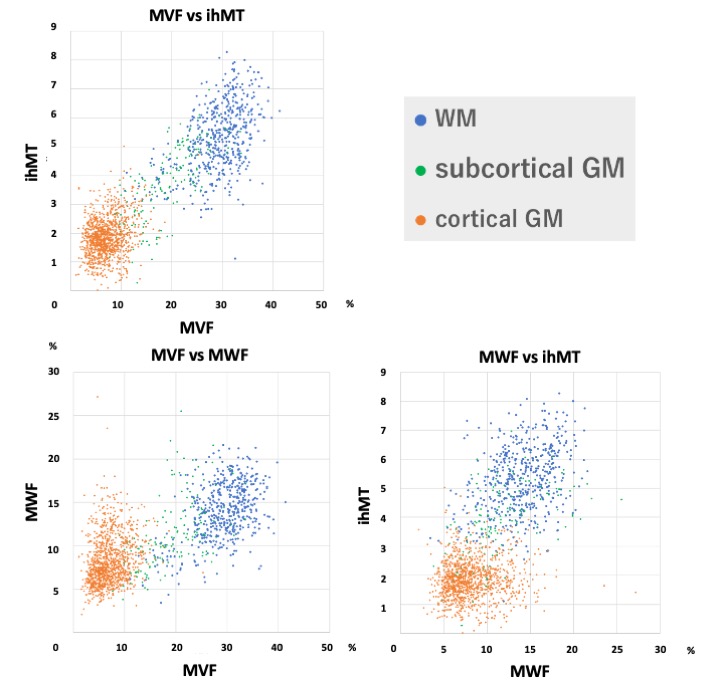
The scatterplots of three myelin metrics are shown in Figure 2. MVF and ihMT in all regions showed strong and higher correlation than comparison between MWF and MVF or ihMT. The Spearman correlation coefficients between these myelin metrics are shown in Table 2. In WM, correlations were weak to moderate, with that between MVF and ihMT showing the highest correlation coefficient. In subcortical GM, correlations were moderate to strong, with that between MVF and ihMT showing the highest correlation coefficient. In cortical GM, all metrics showed negligible to weak correlations, with that between MVF and MWF showing the highest correlation.DISCUSSION
The correlation between MVF and ihMT was overall higher than that between MWF and MVF or ihMT in this study. SyMRI measures the myelin partial volume, a combination of myelin water and myelin macromolecules expressed as a percentage of a voxel. MT signals, on the other hand, increase linearly as the partial volume of myelin increases, at the expense of the partial volume of cells6. Moreover, ihMT was reported to be more sensitive and specific to myelin than previous MT imaging methods, namely, MT saturation index and MT ratio12. Therefore, there is supposed to be a high correlation. On the other hand, MWF is a ratio of the myelin water to the total amount of water in a voxel6. Negligible to weak correlation in the cortical GM could be attributed to the influence of partial volume, the small sample size, and the difference in the slice thickness of myelin maps. In subcortical GM and WM, these three MVF indicators showed moderate and weak to moderate correlations, respectively, with each other.CONCLUSION
A strong correlation was obtained between MVF and ihMT, and MWF was less correlated with the other maps. We should be mindful that these metrics are measuring different aspects of “myelin”.Acknowledgements
No acknowledgement found.References
1. Ihara M, Polvikoski TM, Hall R, et al. Quantification of myelin loss in frontal lobe white matter in vascular dementia, Alzheimer’s disease, and dementia with Lewy bodies. Acta Neuropathol. 2010;119:579–589.
2. Wu M, Kumar A, Yang S. Development and aging of superficial white matter myelin from young adulthood to old age: Mapping by vertex-based surface statistics (VBSS). Hum. Brain Mapp. 2016;37:1759–1769.
3. Hagiwara A, Fujimoto K, Kamagata K, et al. Age-Related Changes in Relaxation Times, Proton Density, Myelin, and Tissue Volumes in Adult Brain Analyzed by 2-Dimensional Quantitative Synthetic Magnetic Resonance Imaging. Invest. Radiol. 2021;56:163–172.
4. Hagiwara A, Warntjes M, Hori M, et al. SyMRI of the Brain: Rapid Quantification of Relaxation Rates and Proton Density, With Synthetic MRI, Automatic Brain Segmentation, and Myelin Measurement. Invest. Radiol. 2017;52:647–657.
5. Blystad I, Warntjes JBM, Smedby O, Landtblom A-M, Lundberg P, Larsson E-M. Synthetic MRI of the brain in a clinical setting. Acta radiol. 2012;53:1158–1163.
6. Warntjes M, Engström M, Tisell A, Lundberg P. Modeling the Presence of Myelin and Edema in the Brain Based on Multi-Parametric Quantitative MRI. Front. Neurol. 2016;7:16.
7. Hagiwara A, Hori M, Kamagata K, et al. Myelin Measurement: Comparison Between Simultaneous Tissue Relaxometry, Magnetization Transfer Saturation Index, and T1w/T2w Ratio Methods. Sci. Rep. 2018;8:10554.
8. Geeraert BL, Lebel RM, Mah AC, et al. A comparison of inhomogeneous magnetization transfer, myelin volume fraction, and diffusion tensor imaging measures in healthy children. Neuroimage 2018;182:343–350.
9. Laule C, Moore GRW. Myelin water imaging to detect demyelination and remyelination and its validation in pathology. Brain Pathol. 2018;28:750–764.
10. Zhang Y, Brady M, Smith S. Segmentation of brain MR images through a hidden Markov random field model and the expectation-maximization algorithm. IEEE Trans. Med. Imaging 2001;20:45–57.
11. Schober P, Boer C, Schwarte LA. Correlation Coefficients: Appropriate Use and Interpretation. Anesth. Analg. 2018;126:1763–1768.
12. Munsch F, Varma G, Taso M, et al. Characterization of the cortical myeloarchitecture with inhomogeneous magnetization transfer imaging (ihMT). Neuroimage 2021;225:117442.
Figures