3580
Mapping brain development : An ex vivo multi-contrast MRI study on the ferret1Institut du Cerveau (ICM) - Paris Brain Institute, Inserm U 1127, CNRS UMR 7225, Sorbonne Université, Center for Neuroimaging research (CENIR), Paris, France, 2Aix Marseille Univ, CNRS, CRMBM, Marseille, France, 3Institut Pasteur, Université de Paris, Département de neuroscience, Paris, France
Synopsis
Keywords: Quantitative Imaging, Ex-Vivo Applications, Multi-Contrast
Brain development during the first weeks after birth in ferrets is similar to the one in the last trimester pregnancy in humans. Studying the ferret brain could thus provide insights about brain development and the underlying processes. We used a multi-contrast MRI approach combining diffusion-weighted and quantitative MRI at 11.7T to investigate normal brain development in the ex vivo ferret brain. We were able to reconstruct fiber tracts even at a very early stage and assess their myelination level based on macromolecular fraction values. Combining diffusion-weighted with quantitative MRI is thus an interesting imaging approach to study normal brain development.Purpose
The etiology of the neurodevelopmental impairment that can occur in preterm infants is still poorly understood. Ferret animal model is considered a good model to study brain development and gyrification as it undergoes cortical folding and white matter (WM) maturation during the first month of life1–3. Multi-contrast MRI, combining quantitative and diffusion-weighted MRI, is a promising approach to explore the processes occurring during brain development such as maturation4, myelination5, microstructural changes5,6 and cortical folding7. In this study we aimed at mapping and better understanding the rules that govern normal brain development using multi-contrast MRI in ex vivo brain ferret, as immature ferret recapitulates human brain development patterns of the last trimester of pregnancy1–3.Methods
Animal Model: We chose to investigate three time points: day of birth (P0), 16 days postnatally (P16) and 32 days postnatally (P32) to mimic preterm human brain from the 13th weeks of gestation of pregnancy to two years-old children1.MRI acquisitions: MRI exams were performed ex vivo on three distinct ferret brains (P0, P16, P32), with a 11.7T MRI (Bruker BioSpec 117/16, Bruker, Germany). A 72-mm volume transmit coil was used in combination with a surface receiver coil. The MRI acquisitions (83h in total) consisted in: (i) 3D-segmented EPI diffusion-weighted PGSE8 MRI (DW-MRI; TR/TE = 1000/24 ms, 16 segments, 8 A0, δ = 5 ms, Δ = 12 ms ; b = 6000 s/mm2, 64 directions ; b = 2000 s/mm2, 29 directions ; b = 600 s/mm2, 7 directions) with various spatial resolution depending on the brain size (from 100 to 200 µm isotropic) (ii) B1+ map9,10 and (iii) 3D T2*w-MRI (MGE, TR = 100 ms, Necho = 16, TE1 = 2.1 ms, ΔTE = 2.5 ms) with variable flip angles (FA = 6°,15°,30°) and magnetization transfer module to assess M0, R1, R2* values as well as Macromolecular Proton Fraction (MPF)11,12 and quantitative susceptibility mapping (QSM)13 values. As DW-MRI, T2*w images were acquired with spatial resolution from 75 to 150 µm isotropic.
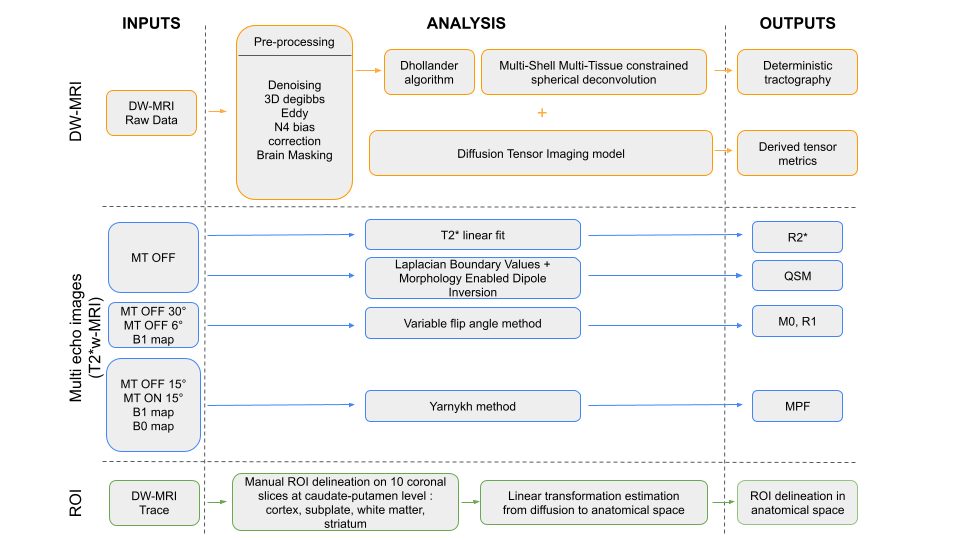
MRI analysis: Figure 1 describes the multi-contrast MRI workflow, from the preprocessing steps to the region-of-interest analyses performed on the quantitative maps and derived diffusion maps.
Results
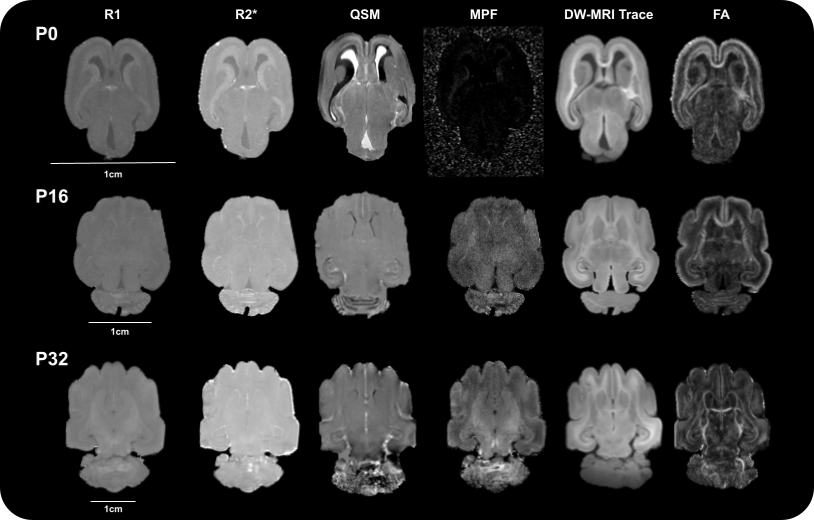
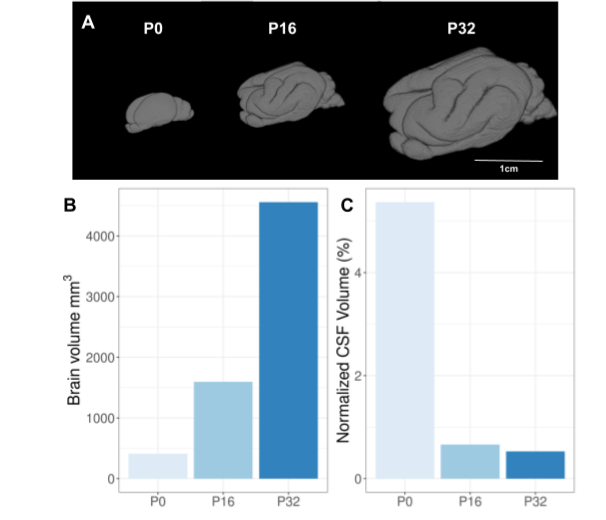
We observed a wider range of contrast intensity at P0 than at P16 and P32 for all the quantitative maps, with a better anatomical delineation on the diffusion parameter maps despite their lower resolution than T2*w-MRI acquisitions (Figure 2).Although P0 did not present any cortical folding, it appeared on the P16 sample and continued to increase with age (Figure 3A). The total brain volume, including ventricles, increased non linearly with age (Figure 3B) while normalized ventricular volume decreased (Figure 3C).
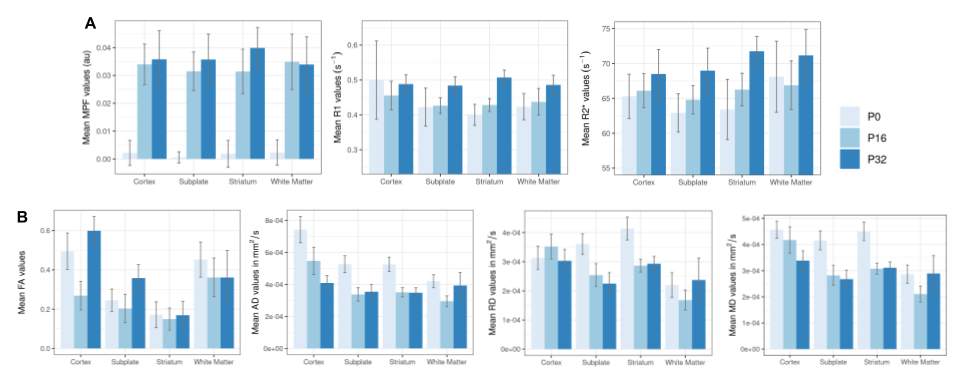
A noticeable increase in MPF values between P0 and P16 was observed (Figure 2) and quantified for four delineated brain regions without any striking changes between P16 and P32 stages. Although R1 and R2* values seemed to slightly increase with age, fractional anisotropy (FA) exhibited a non-linear evolution with age : first a decrease and then an increase (Figure 4). This tendency appeared to be more pronounced in surface brain regions (cortex and subplate). This tendency was also observed in WM for the mean diffusivity (MD), axial diffusivity (AD) and radial diffusivity (RD).
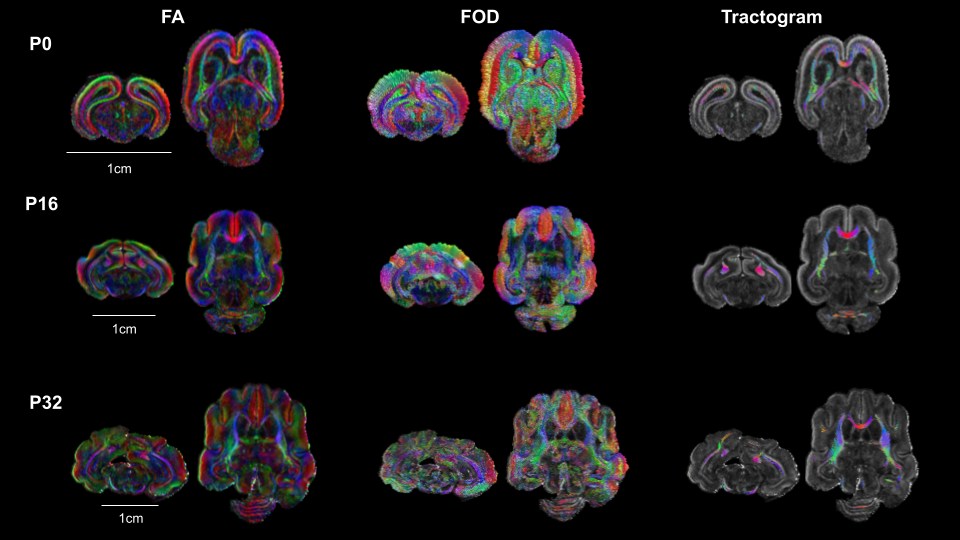
Figure 5 illustrated the fiber tracts reconstructed for the different ages. At P0 they were located in the developing WM and GM as well as the anterior commissure, whereas at P16 they were mostly located in the developing WM (corpus callosum, fornix, corticospinal tract and WM brainstem) with only few fibers in the cortex. Finally, at the later stage (P32) in addition to the previous WM tracts, cortical WM was also identified.
Discussion
The variation in quantitative MRI values could result from changes in brain composition that occur during brain development such as the myelination process, decrease in water content and increased cellular density5,7.Nevertheless, MPF has already been validated as a myelin biomarker in animal models6,14, therefore it can be expected that myelination has already started at P16 stage, even if R1, R2* values were much less affected.
High FA and AD values at P0 in the cortex could result from the tangential migration of cajal retzius cells15. Decrease in these values between P0 et P16 have already been observed in a rat model during cortical maturation due to cellular density change with an increased neurodendritic density and reduction in the radial glia16.
Combination of DW-MRI and quantitative maps enabled fiber tracts organization even at a very early stage (P0), which appeared to be unmyelinated as expected by the very low MPF values at this stage.
Therefore, our results suggest that cortical folding, cortical maturation and myelination occured between P0 and P16 in the ferret brain and could be investigated using multi-MRI contrast. Another complementary method such as polarized light imaging (PLI)17 would validate MRI findings.
Conclusion
This study should enhance our understanding of normal brain development, in particular about the relationship between cortical folding and myelination. PLI experiments are planned for all the brain samples and additional time points will also be acquired to better estimate the onset of cortical folding and myelination.Acknowledgements
The authors acknowledge support from Investissements d’avenir [grant number ANR-10-IAIHU-06 and ANR-11-INBS-0006].References
1. Barnette, A. R. et al. Characterization of Brain Development in the Ferret via MRI. Pediatr. Res. 66, 80–84 (2009).
2. Sawada, K. & Watanabe, M. Development of cerebral sulci and gyri in ferrets (Mustela putorius). Congenit. Anom. 52, 168–175 (2012).
3. Gilardi, C. & Kalebic, N. The Ferret as a Model System for Neocortex Development and Evolution. Front. Cell Dev. Biol. 9, (2021).
4. Girard, N. J., Dory-Lautrec, P., Koob, M. & Dediu, A. M. MRI assessment of neonatal brain maturation. Imaging Med. 4, 613–632 (2012).
5. Dubois, J. et al. The early development of brain white matter: A review of imaging studies in fetuses, newborns and infants. Neuroscience 276, 48–71 (2014).
6. Khodanovich, M. Y. et al. Quantitative assessment of demyelination in ischemic stroke in vivo using macromolecular proton fraction mapping. J. Cereb. Blood Flow Metab. 38, 919–931 (2018).
7. Neal, J. et al. Insights into the gyrification of developing ferret brain by magnetic resonance imaging. J. Anat. 210, 66 (2007).
8. Stejskal, E. O. & Tanner, J. E. Spin Diffusion Measurements: Spin Echoes in the Presence of a Time‐Dependent Field Gradient. J. Chem. Phys. 42, 288–292 (1965).
9. Yarnykh, V. L. Actual flip-angle imaging in the pulsed steady state: A method for rapid three-dimensional mapping of the transmitted radiofrequency field. Magn. Reson. Med. 57, 192–200 (2007).
10. Nehrke, K. On the steady-state properties of actual flip angle imaging (AFI). Magn. Reson. Med. 61, 84–92 (2009).
11. Yarnykh, V. L. Fast macromolecular proton fraction mapping from a single off-resonance magnetization transfer measurement. Magn. Reson. Med. 68, 166–178 (2012).
12. Naumova, A. V., Akulov, A. E., Khodanovich, M. Y. & Yarnykh, V. L. High-resolution three-dimensional macromolecular proton fraction mapping for quantitative neuroanatomical imaging of the rodent brain in ultra-high magnetic fields. NeuroImage 147, 985–993 (2017).
13. de Rochefort, L., Brown, R., Prince, M. R. & Wang, Y. Quantitative MR susceptibility mapping using piece-wise constant regularized inversion of the magnetic field. Magn. Reson. Med. 60, 1003–1009 (2008).
14. Khodanovich, M. Y. et al. Histological validation of fast macromolecular proton fraction mapping as a quantitative myelin imaging method in the cuprizone demyelination model. Sci. Rep. 7, 46686 (2017).
15. Gil, V., Nocentini, S. & del RÃo, J. A. Historical first descriptions of Cajal-Retzius cells: from pioneer studies to current knowledge. Front. Neuroanat. 8, (2014).
16. Lodygensky, G. A., Vasung, L., Sizonenko, S. V. & Hüppi, P. S. Neuroimaging of cortical development and brain connectivity in human newborns and animal models: Neuroimaging in human newborns & animal models. J. Anat. 217, 418–428 (2010).
17. Zilles, K. et al. Chapter 18 - High-Resolution Fiber and Fiber Tract Imaging Using Polarized Light Microscopy in the Human, Monkey, Rat, and Mouse Brain. in Axons and Brain Architecture (ed. Rockland, K. S.) 369–389 (Academic Press, 2016). doi:10.1016/B978-0-12-801393-9.00018-9.
18. Tournier, J.-D. et al. MRtrix3: A fast, flexible and open software framework for medical image processing and visualisation. 27.
19. Jeurissen, B., Tournier, J.-D., Dhollander, T., Connelly, A. & Sijbers, J. Multi-tissue constrained spherical deconvolution for improved analysis of multi-shell diffusion MRI data. NeuroImage 103, 411–426 (2014).
20. Baloch, S. et al. Quantification of Brain Maturation and Growth Patterns in C57BL/6J Mice via Computational Neuroanatomy of Diffusion Tensor Images. Cereb. Cortex 19, 675–687 (2009).
Figures