3579
Age-dependent changes of myelin-related feature analysis in gray matter and white matter1Department of Biomedical Engineering and Environmental Sciences, National Tsing Hua University, Hsinchu, Taiwan, 2Institute of Biomedical Engineering and Nanomedicine, National Health Research Institutes, Miaoli, Taiwan, 3Department of Medical Imaging, National Taiwan University Hospital Hsinchu Branch, Hsinchu, Taiwan, 4Department of Radiology, Taoyuan General Hospital, Taoyuan, Taiwan
Synopsis
Keywords: Quantitative Imaging, Aging, Myelin-related images
The regional characteristics extracted from myelin-related images have been considered the markers of brain degradation. However, a systematic investigation of age-dependent changes in myelin-related images remains deficient. We aimed to investigate the associations between regional features and age in myelin-related images. Our results revealed that ADC, mFLAIR, and T1w/T2w ratio were associated with age while aMWF showed no age-dependency. The increased heterogeneity and decreased uniformity in certain brain regions were observed in the elderly, indicating changes of microstructural tissue integrity in ADC, mFLAIR, and T1w/T2w ratio and the clinical usefulness of aMWF without a confounding factor of age in diagnosis.Introduction
The regional characteristics of various myelin-related images have been proven to be the markers of brain degradation [1]. Apparent diffusion coefficient (ADC) computed from diffusion weighted imaging (DWI) is used to quantify the diffusivity and can indirectly indicate the myelination of axons [2]. Fluid Attenuation Inversion Recovery (FLAIR) image indicates the level of myelin enrichment based on the T2-component [3]. Myelin water fraction (MWF) is employed to directly measure myelin water component in myelin sheaths [4]. Apparent MWF (aMWF) can quantify myelin water component with more effective post-processing time while preserving comparable image quality in comparison with MWF [5]. The ratio of T1-weighted image to T2-weighted image (T1w/T2w ratio) has been reported to be proportional to the myelination [6].Previous studies have demonstrated regional heterogeneity by qualitative observation or computing standard deviation of a specific index in brain regions in the elderly [7, 8]. However, the association of aMWF and age has been unexplored. Moreover, a systematic investigation of age-dependent changes of myelin-related images remains deficient. In this study, we aimed to investigate the associations between age and regional features in myelin-related images to comprehend the changes of microstructural tissue integrity in gray matter (GM) and white matter (WM) during the lifespan.
Materials & Methods
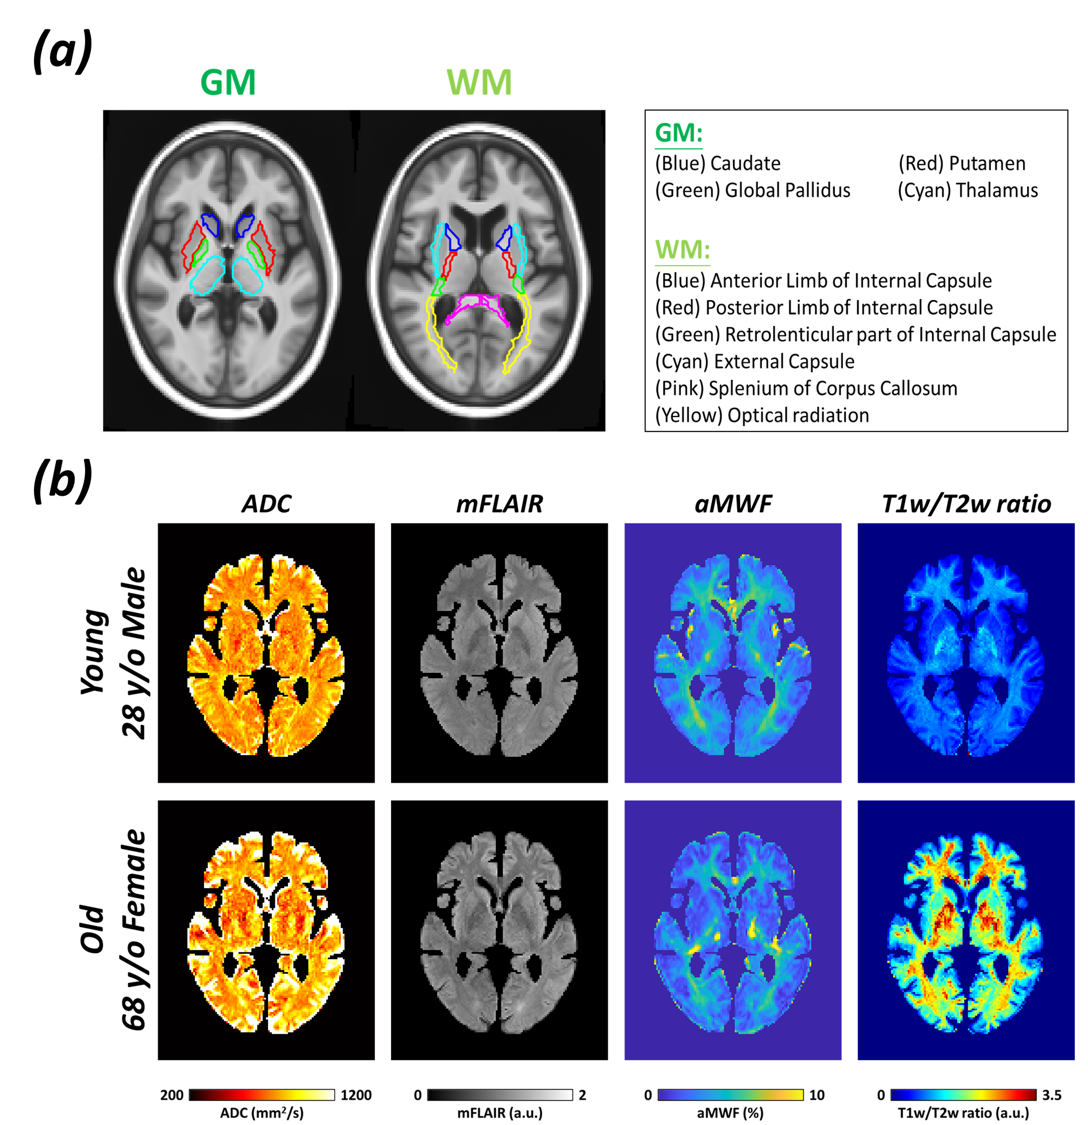
Twenty-eight healthy volunteers were recruited (male/female=21/7, age=46.0±12.0 (28-72) y/o). All MRI images were acquired in a 3-T system (Skyra, Siemens). The imaging protocol included DWI, T2-FLAIR, T1WI, T2WI, and ViSTa [5] sequences. The scanning parameters were: DWI with TR/TE=7100/64 ms, FA=90o, b=0 and 1000 (s/mm2), voxel size=1.53×1.53×5 mm3; FLAIR with TR/TE=8000/85 ms, TI=2370 ms, voxel size=0.38×0.38×5 mm3; T1WI with TR/TE=2190/2.25 ms, FA=10o, voxel size=0.5×0.5×0.9 mm3; T2WI with TR/TE=6750/101 ms, voxel size=0.5×0.5×5 mm3; ViSTa was acquired with TR/TE=1160/7.6 ms, TI=560 ms, voxel size=1.9×1.9×5 mm3; PDw with TR/TE=75/7.6 ms, FA=28o. The FLAIR images were normalized to the mean of whole brain to produce mFLAIR images. aMWF was calculated by: aMWF(%)=(ViSTa/PDw)×0.55×100% [5]. The T1w/T2w ratio was processed with bias correction and intensity standardization [6]. T1WI of each participant was registered on MCALT T1 template provided from Aging and Dementia Research (ADIR) lab at Mayo Clinic [9]. Figure 1(a) illustrates the 4 and 6 regions of interest (ROIs) selected in GM and WM. Regional features within each ROI included regional mean, coefficient of variation (CV), entropy, and energy. The correlations between age and regional features were evaluated by Spearman correlation coefficient. A p-value<0.05 was considered as statistical significance.Results
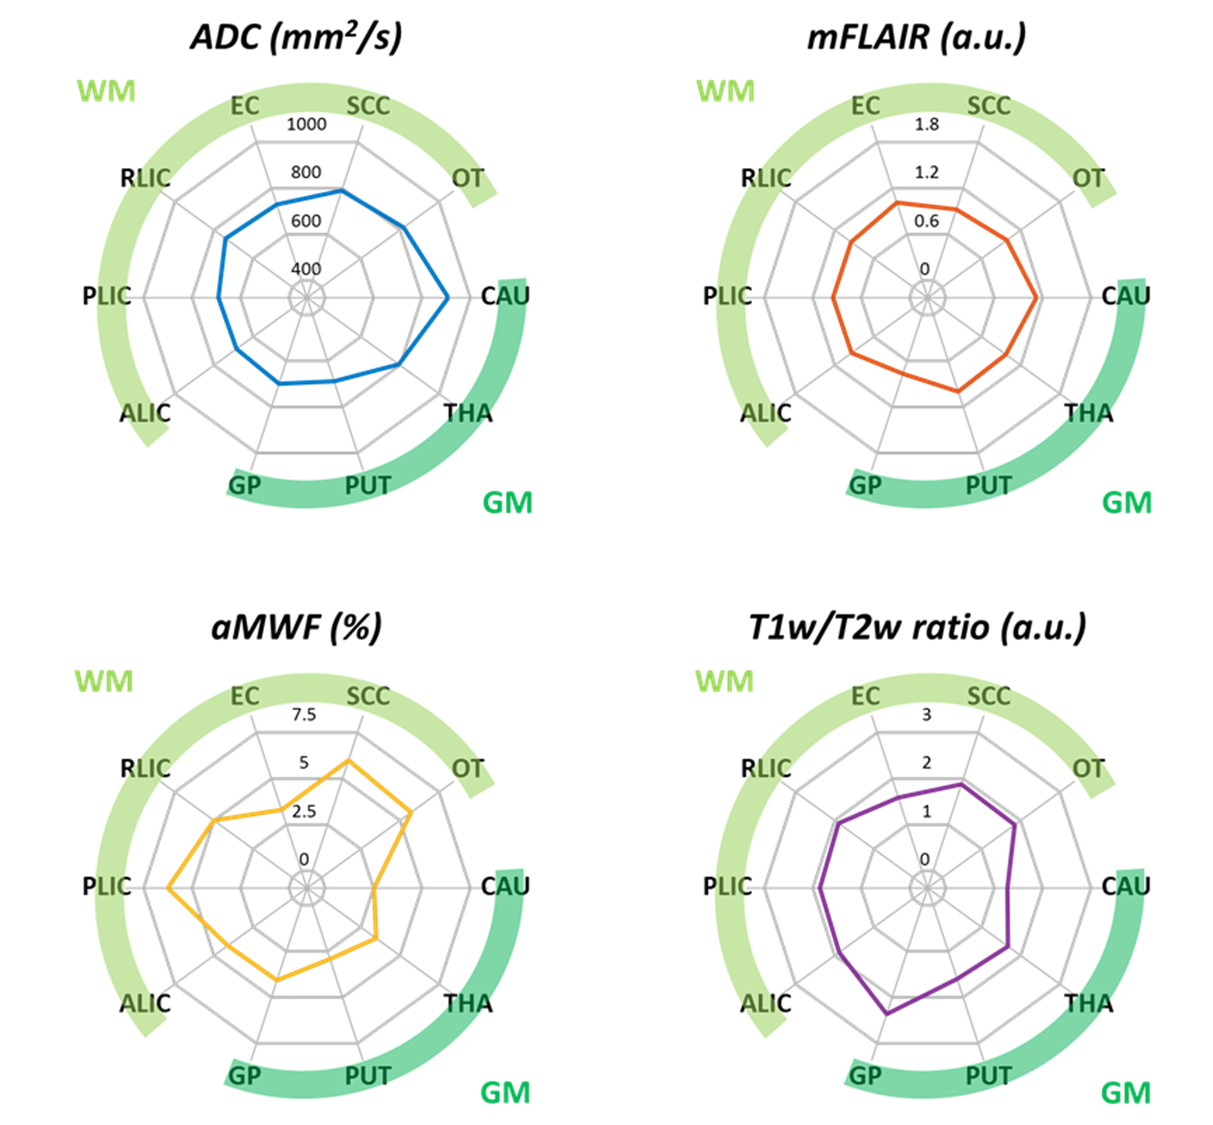
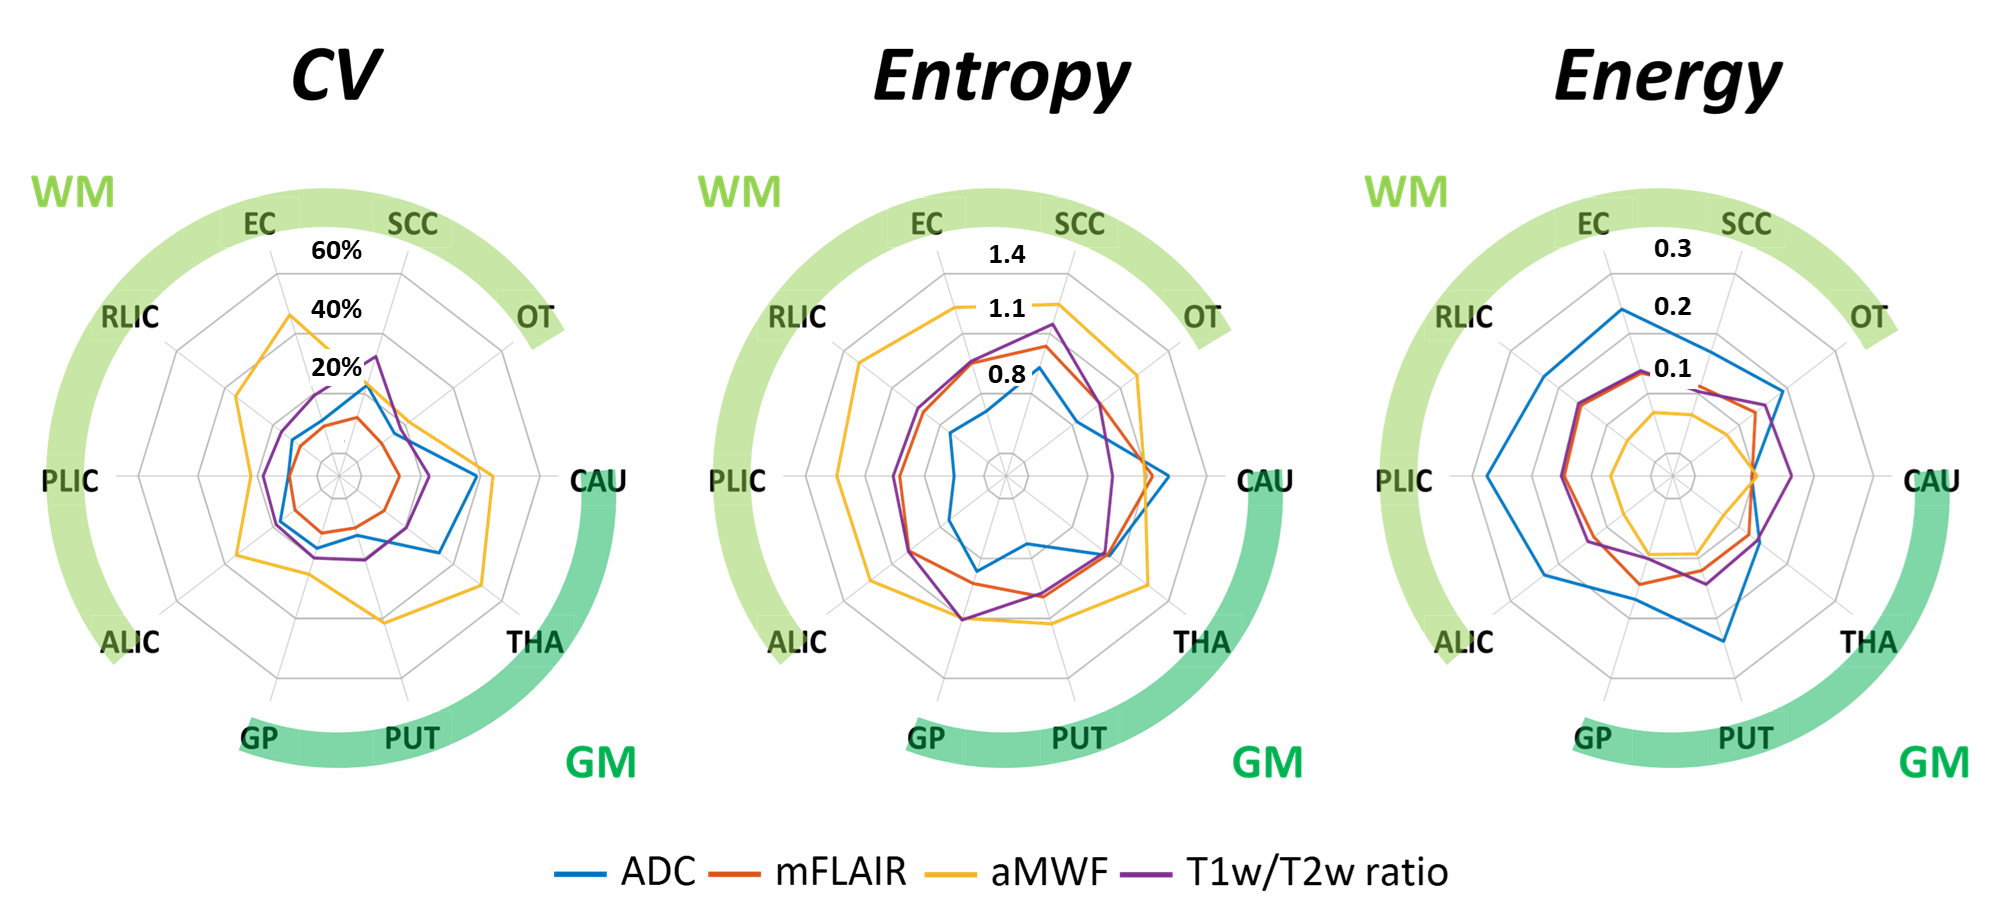
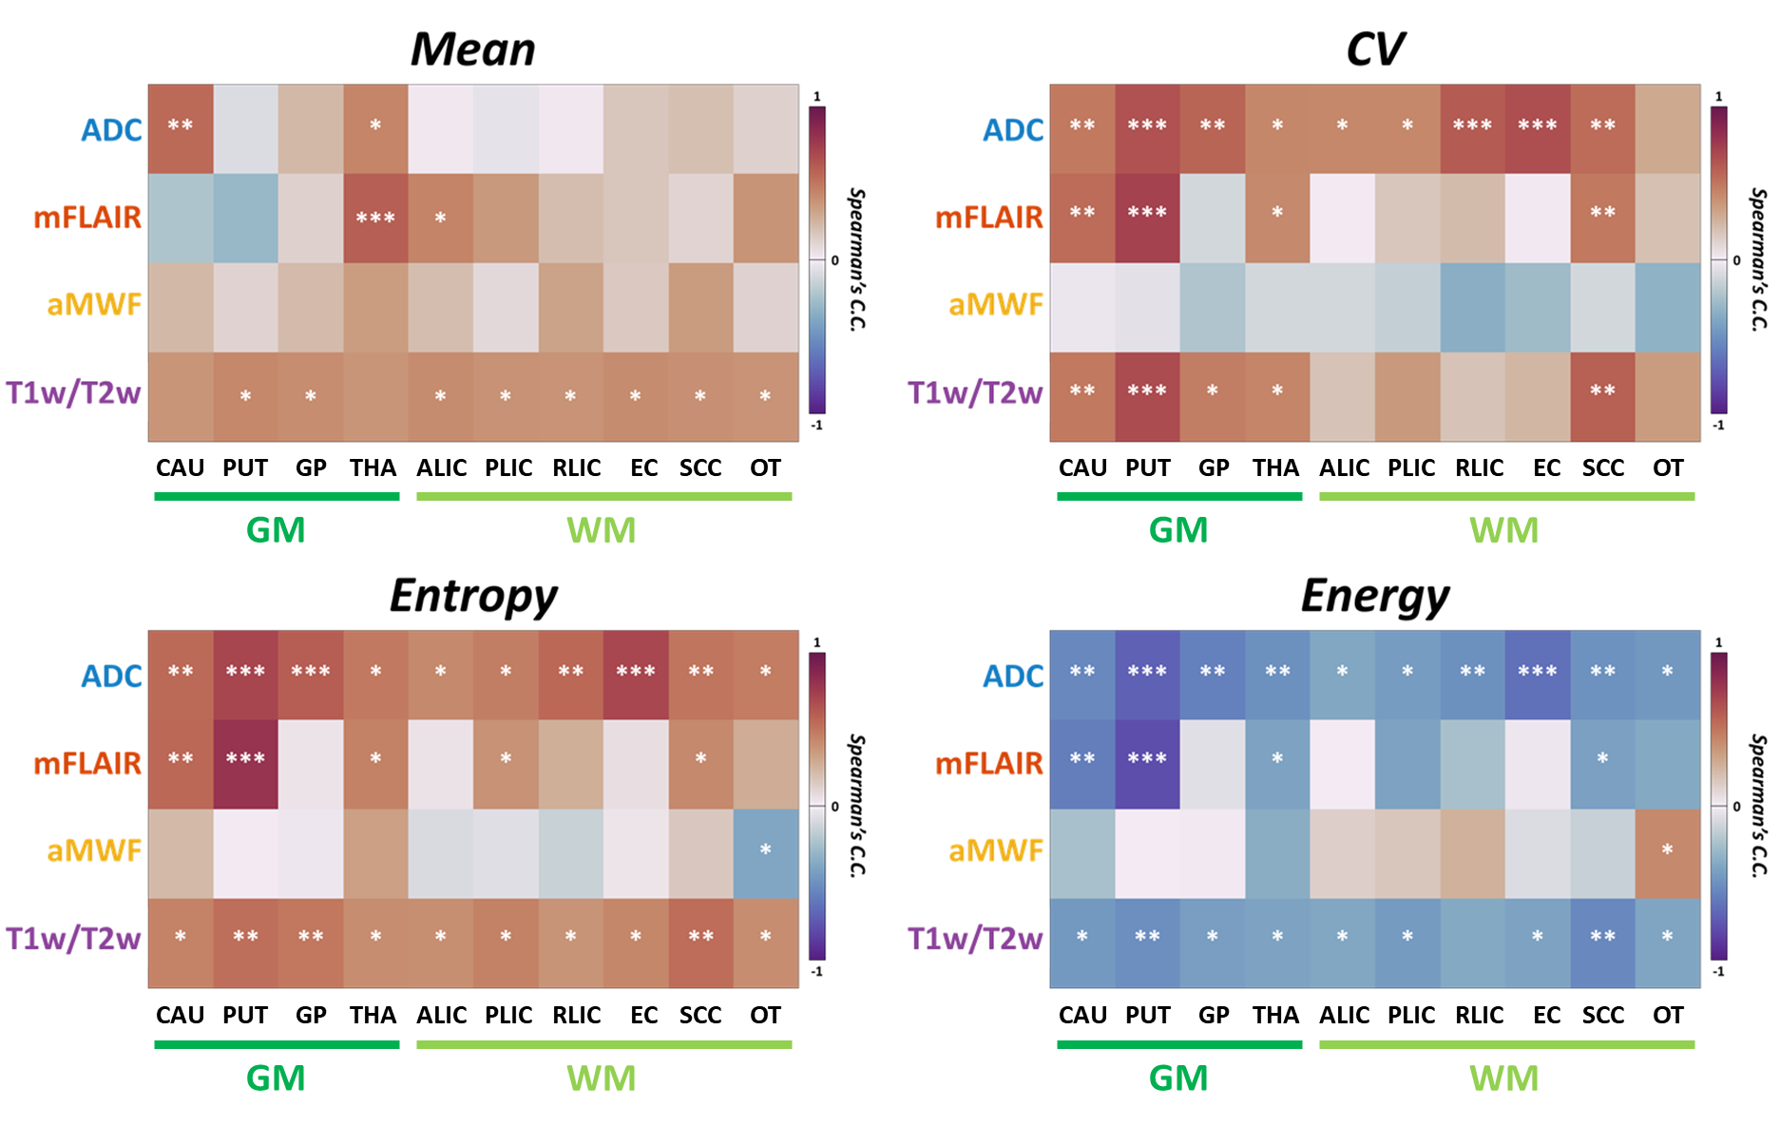
Figure 1(b) demonstrates quantitative maps of ADC, mFLAIR, aMWF, and T1w/T2w ratio in a 28-year-old male and a 68-year-old female volunteer. In Figure 2, in comparison with GM, WM exhibited significantly decreased regional ADC (736±32 vs. 802±51 s/mm2, p<0.05), increased aMWF (5.3%±1.2% vs. 3.1%±0.6%, p<0.05) and T1w/T2w ratio (1.92±0.07 vs. 1.86±0.5, p<0.05), and comparable mFLAIR (1.08±0.05 vs. 1.05±0.03, p=0.23). In Figure 3, compared to other myelin-related indices, aMWF generally presented the highest CV (42%±14%) and entropy (1.23±0.08) and the lowest energy (0.08±0.02) while ADC exhibited the lowest entropy (0.83±0.15) and the highest energy (0.21±0.07) in all ROIs.The correlations between age and regional features of four indices were shown in Figure 4. Except CAU and THA regions, the regional mean of T1w/T2w ratio significantly correlated with age. In contrast, the regional mean of aMWF exhibited no correlation with age in all regions (all p>0.05). ADC and T1w/T2w ratio displayed correlations between age and CV, entropy and energy in most of regions (r=0.46-0.84, p<0.05). These three features of mFLAIR were correlated with age in some regions, such as CAU, PUT, THA, and SCC (r=-0.72-0.78, all p<0.05). Except in OT, aMWF showed no associations between age and these features (all p>0.05) in all regions.
Discussion & Conclusion
In this study, the mean, CV, and entropy of ADC, mFLAIR, and T1w/T2w ratio were positively correlated with age in some of the selected regions; while the energy demonstrated negative correlation with age. The four features of aMWF had no association with age in almost all regions.The positive correlations between age and regional mean in ADC and mFLAIR might imply the potential neuronal inflammation in specific brain regions in the elderly [2, 3]. Previous studies have identified CV and entropy as the markers of regional heterogeneity and energy the indicator of regional uniformity [1, 7]. In ADC, mFLAIR, and T1w/T2w, the positive correlations between age and CV and entropy, as well as the negative correlation between age and energy, indicated the increased heterogeneity and decreased uniformity in certain brain regions with age [7, 8, 10]. There is no correlation between age and features of aMWF, suggesting the low age dependency of aMWF.
In conclusion, the quantitative evaluation of the correlations between age and regional features in myelin-related images can be helpful to comprehend the changes of microstructural tissue integrity in GM and WM during the lifespan. The age-independent changes of features in aMWF might describe the future usefulness of aMWF in evaluating disease progress without a confounding factor of age.
Acknowledgements
No acknowledgement found.References
1. Boccardi, V., et al., Of Energy and Entropy: The Ineluctable Impact of Aging in Old Age Dementia. International journal of molecular sciences, 2017. 18(12): p. 2672.
2. Mohamed, F.F., H.N. Almassry, and M.H. Sharaf, ADC value as a predictor for myelin loss/Preservation in MS plaques with different enhancement pattern in correlation with disease activity. The Egyptian Journal of Radiology and Nuclear Medicine, 2017. 48(4): p. 991-997.
3. Haller, S., et al., Do brain T2/FLAIR white matter hyperintensities correspond to myelin loss in normal aging? A radiologic-neuropathologic correlation study. Acta Neuropathol Commun, 2013. 1: p. 14.
4. MacKay, A.L. and C. Laule, Magnetic Resonance of Myelin Water: An in vivo Marker for Myelin. Brain Plast, 2016. 2(1): p. 71-91.
5. Oh, S.-H., et al., Direct visualization of short transverse relaxation time component (ViSTa). NeuroImage, 2013. 83: p. 485-492.
6. Ganzetti, M., N. Wenderoth, and D. Mantini, Whole brain myelin mapping using T1- and T2-weighted MR imaging data. Frontiers in Human Neuroscience, 2014. 8.
7. Wearn, A.R., et al., T2 heterogeneity: a novel marker of microstructural integrity associated with cognitive decline in people with mild cognitive impairment. Alzheimers Res Ther, 2020. 12(1): p. 105.
8. Schmidt, R., et al., Heterogeneity in age-related white matter changes. Acta neuropathologica, 2011. 122(2): p. 171-185.
9. Schwarz, C., et al. The mayo clinic adult lifespan template (MCALT): better quantification across the lifespan. in Alzheimer’s Association International Conference.[Google Scholar]. 2017.
10. Ouyang, Y., et al., Analysis of Age-Related White Matter Microstructures Based on Diffusion Tensor Imaging. Frontiers in aging neuroscience, 2021: p. 234.
Figures