3577
Brain iron status in children and adolescents with beta-thalassemia.1Dmitry Rogachev National Research Center of Pediatric Hematology, Oncology and Immunology, Moscow, Russian Federation, 2Philips, Moscow, Russian Federation
Synopsis
Keywords: Quantitative Imaging, Quantitative Susceptibility mapping, Iron accumulation
Background TDT patients are susceptible to secondary iron overload. Determining brain iron content may be crucial to prevent brain iron poisoning. TDT Patient and control groups consisted of 23 and 50 children and adolescents respectively. 3D, T1-weighted and susceptibility-weighted images were obtained and QSM maps were reconstructed. Magnetic susceptibility values in brain structures were adjusted for age-related iron accumulation. Statistical analysis, carried out with and without correction for age, did not reveal significant differences in brain iron content between the two groups. Brain iron overload does not occur in TDT patients, whether it be children or adults.
Introduction
Thalassemias are a group of inherited blood diseases characterized by abnormal haemoglobin synthesis. Severe forms of this condition require regular blood transfusions and are denoted as transfusion dependent thalassemias (TDT). The transfusion therapy consists in administering packed red blood cells and is effective at maintaining normal haemoglobin blood levels. A side effect of this therapy is iron overload in various organs caused by high iron content of red blood cells. Monitoring iron overload therefore plays a key role in TDT treatment in order to create tailored chelation regimes. Non-invasive quantitative MRI techniques (such as T2* and quantitative susceptibility mapping (QSM)) are the preferred option and are used to assess iron content in liver and heart. Determining brain iron content may prove to be equally important since elevated brain iron levels cause organ damage and are associated with the onset of neurodegenerative diseases1. However, there is no consensus on whether or not brain iron overload is present in TDT and results of several MRI studies on this matter remain largely contradictory. Thus, the goal of our study was to evaluate brain iron content in children and adolescents with TDT.Methods
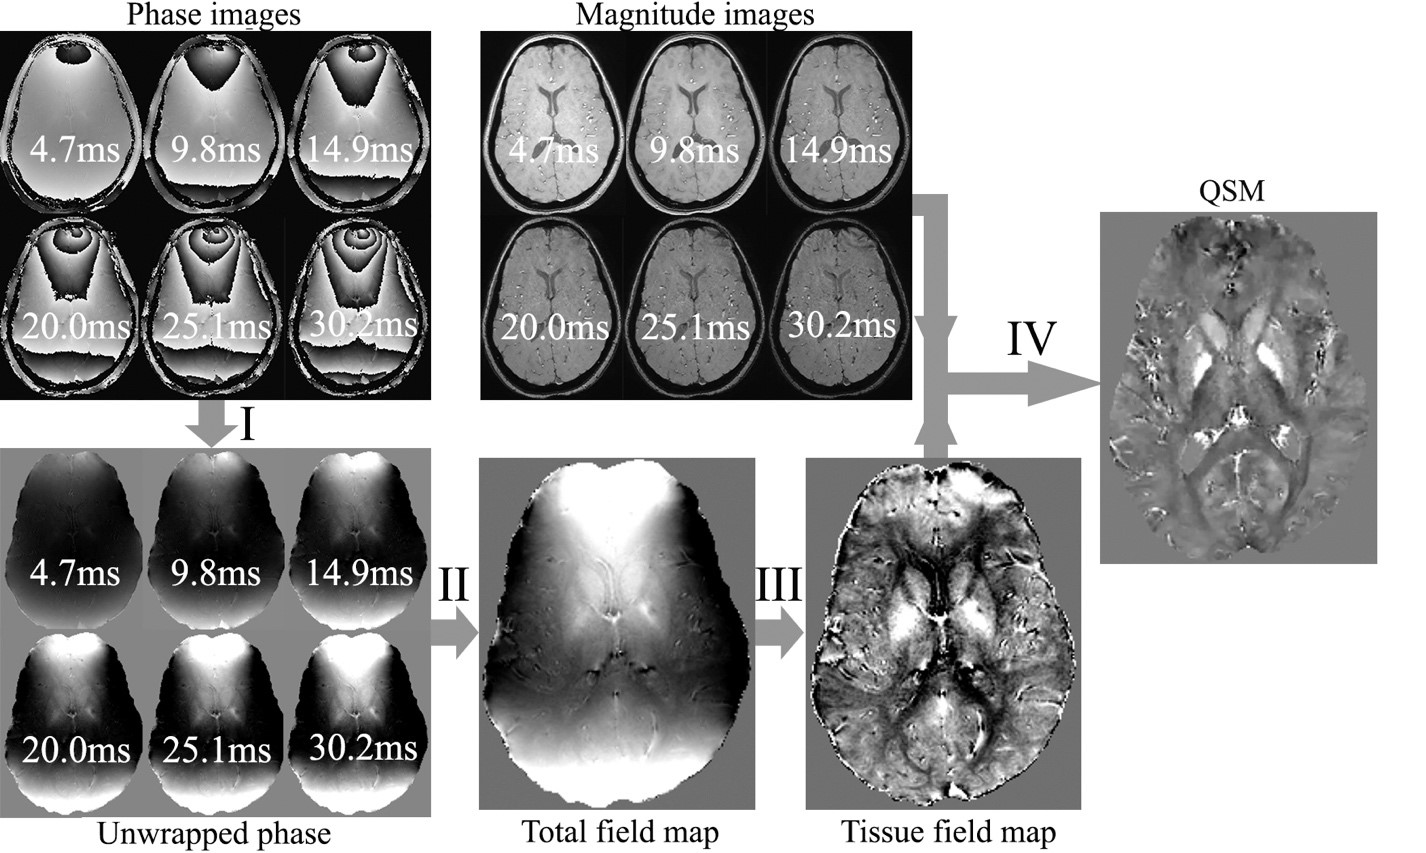
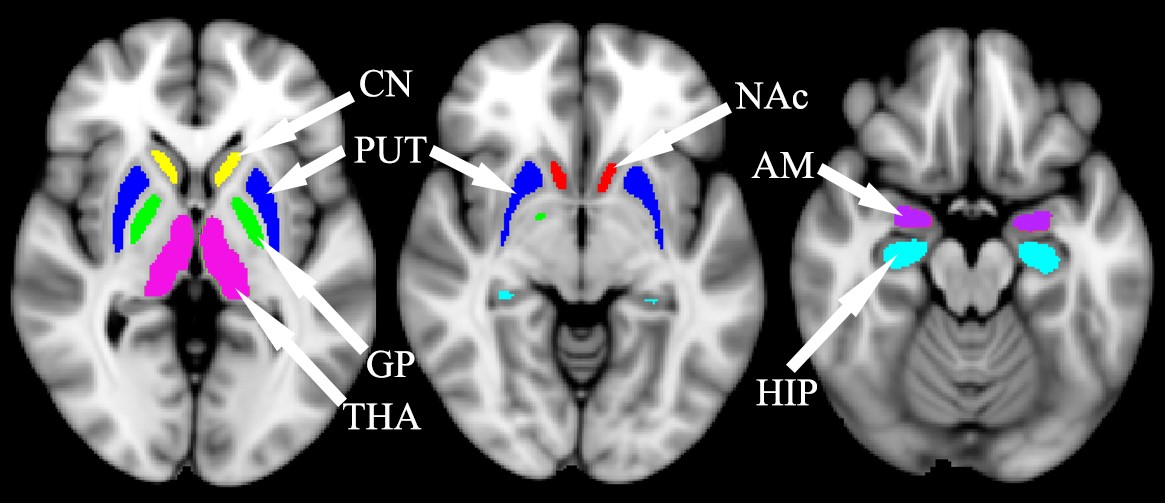
Patient and control group consisted of 23 children and adolescents with TDT aged 2 to 17 and 50 healthy volunteers aged 2 to 22 respectively. Both groups underwent an MRI examination using a Philips Achieva dStream 3.0T MRI and an 8-channel head coil. 3D, T1-weighted images were obtained with a gradient echo (FFE) sequence (TR=8.1 ms, TE=3.7 ms, FA=20°, voxel size=1×1×1 mm), susceptibility-weighted images (SWI) – with a multi-gradient echo sequence (TR=33.8 ms, TE=4.7, 9.8, 14.9, 20.0, 25.1, 30.2 ms, FA=17°, voxel size=0.8×0.8×0.8 mm). QSM maps were then reconstructed according to the Fig. 1 using Matlab R2018b and the morphology enabled dipole inversion (MEDI) toolbox2.FSL Flirt3 was then used to co-register SWI images with TE=4.7 ms with the 3DT1 images, while 3DT1 images were co-registered with the pediatric atlas for children and adolescents4. Thus, two transformation matrices: “SWI->3DT1.mat” and “3DT1->atlas.mat”, which are required to transform QSM images into the atlas space, were obtained. Next, magnetic susceptibility in structures such as thalamus and hippocampi was calculated using masks derived from Harvard-Oxford subcortical structural atlas (fig.2).Nonlinear fitting of the data was then performed using following model:
χ=α*(1-exp(-β*age)+γ
where χ denotes magnetic susceptibility; α, β, γ denote unknown coefficients describing iron accumulation with age.
Results
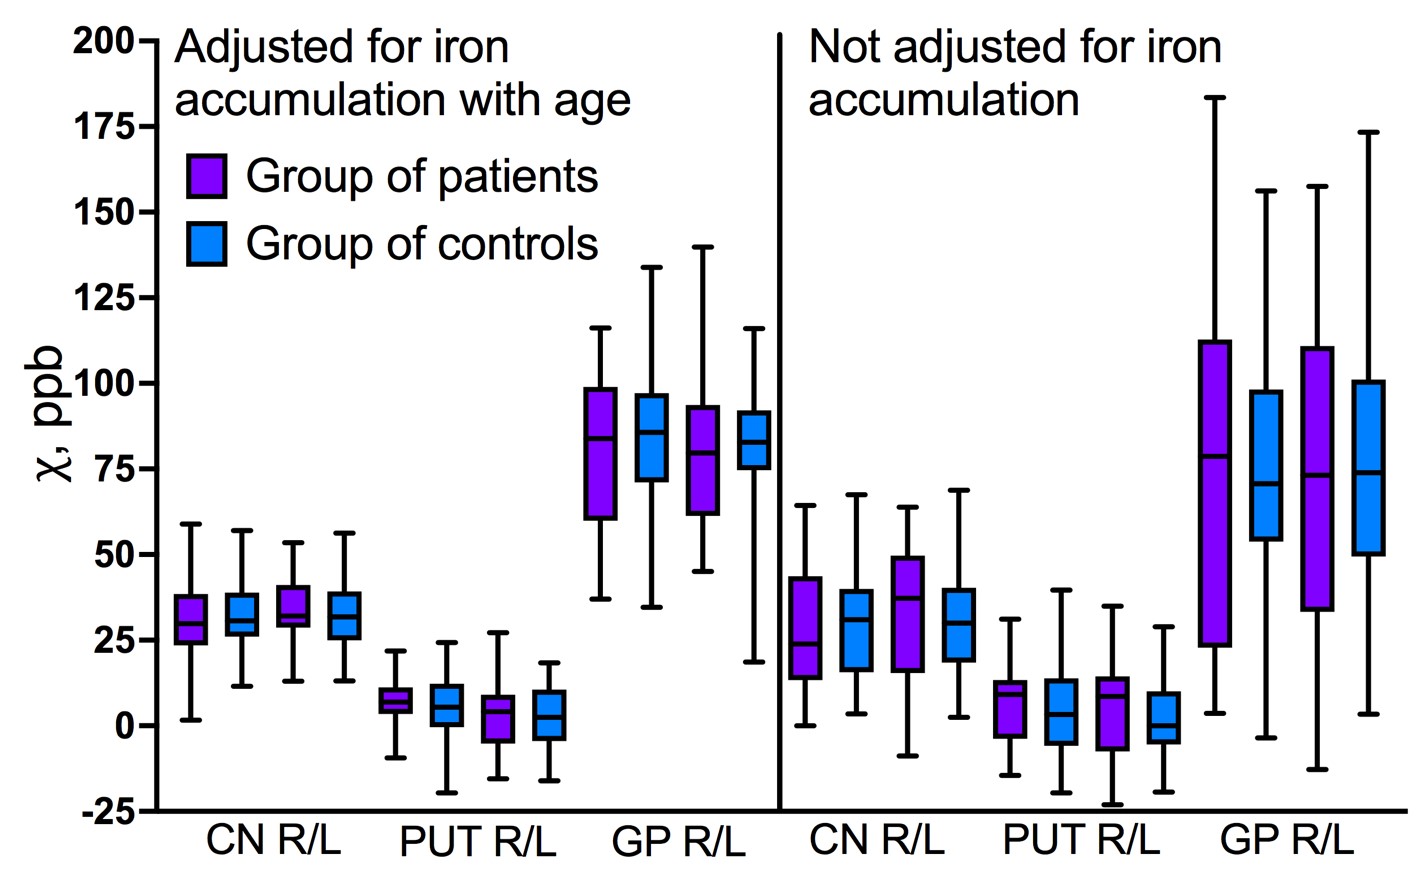
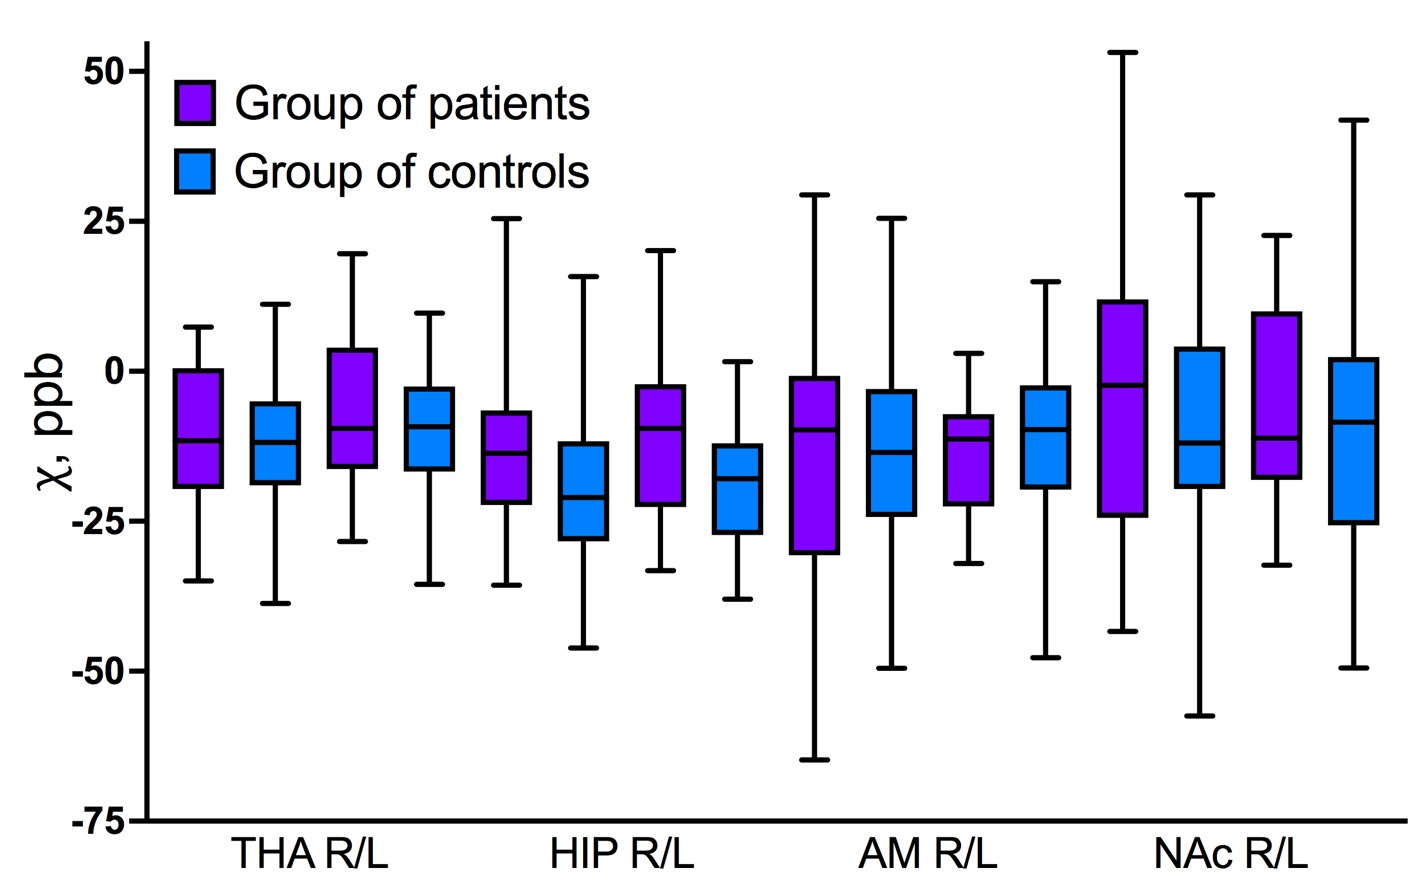
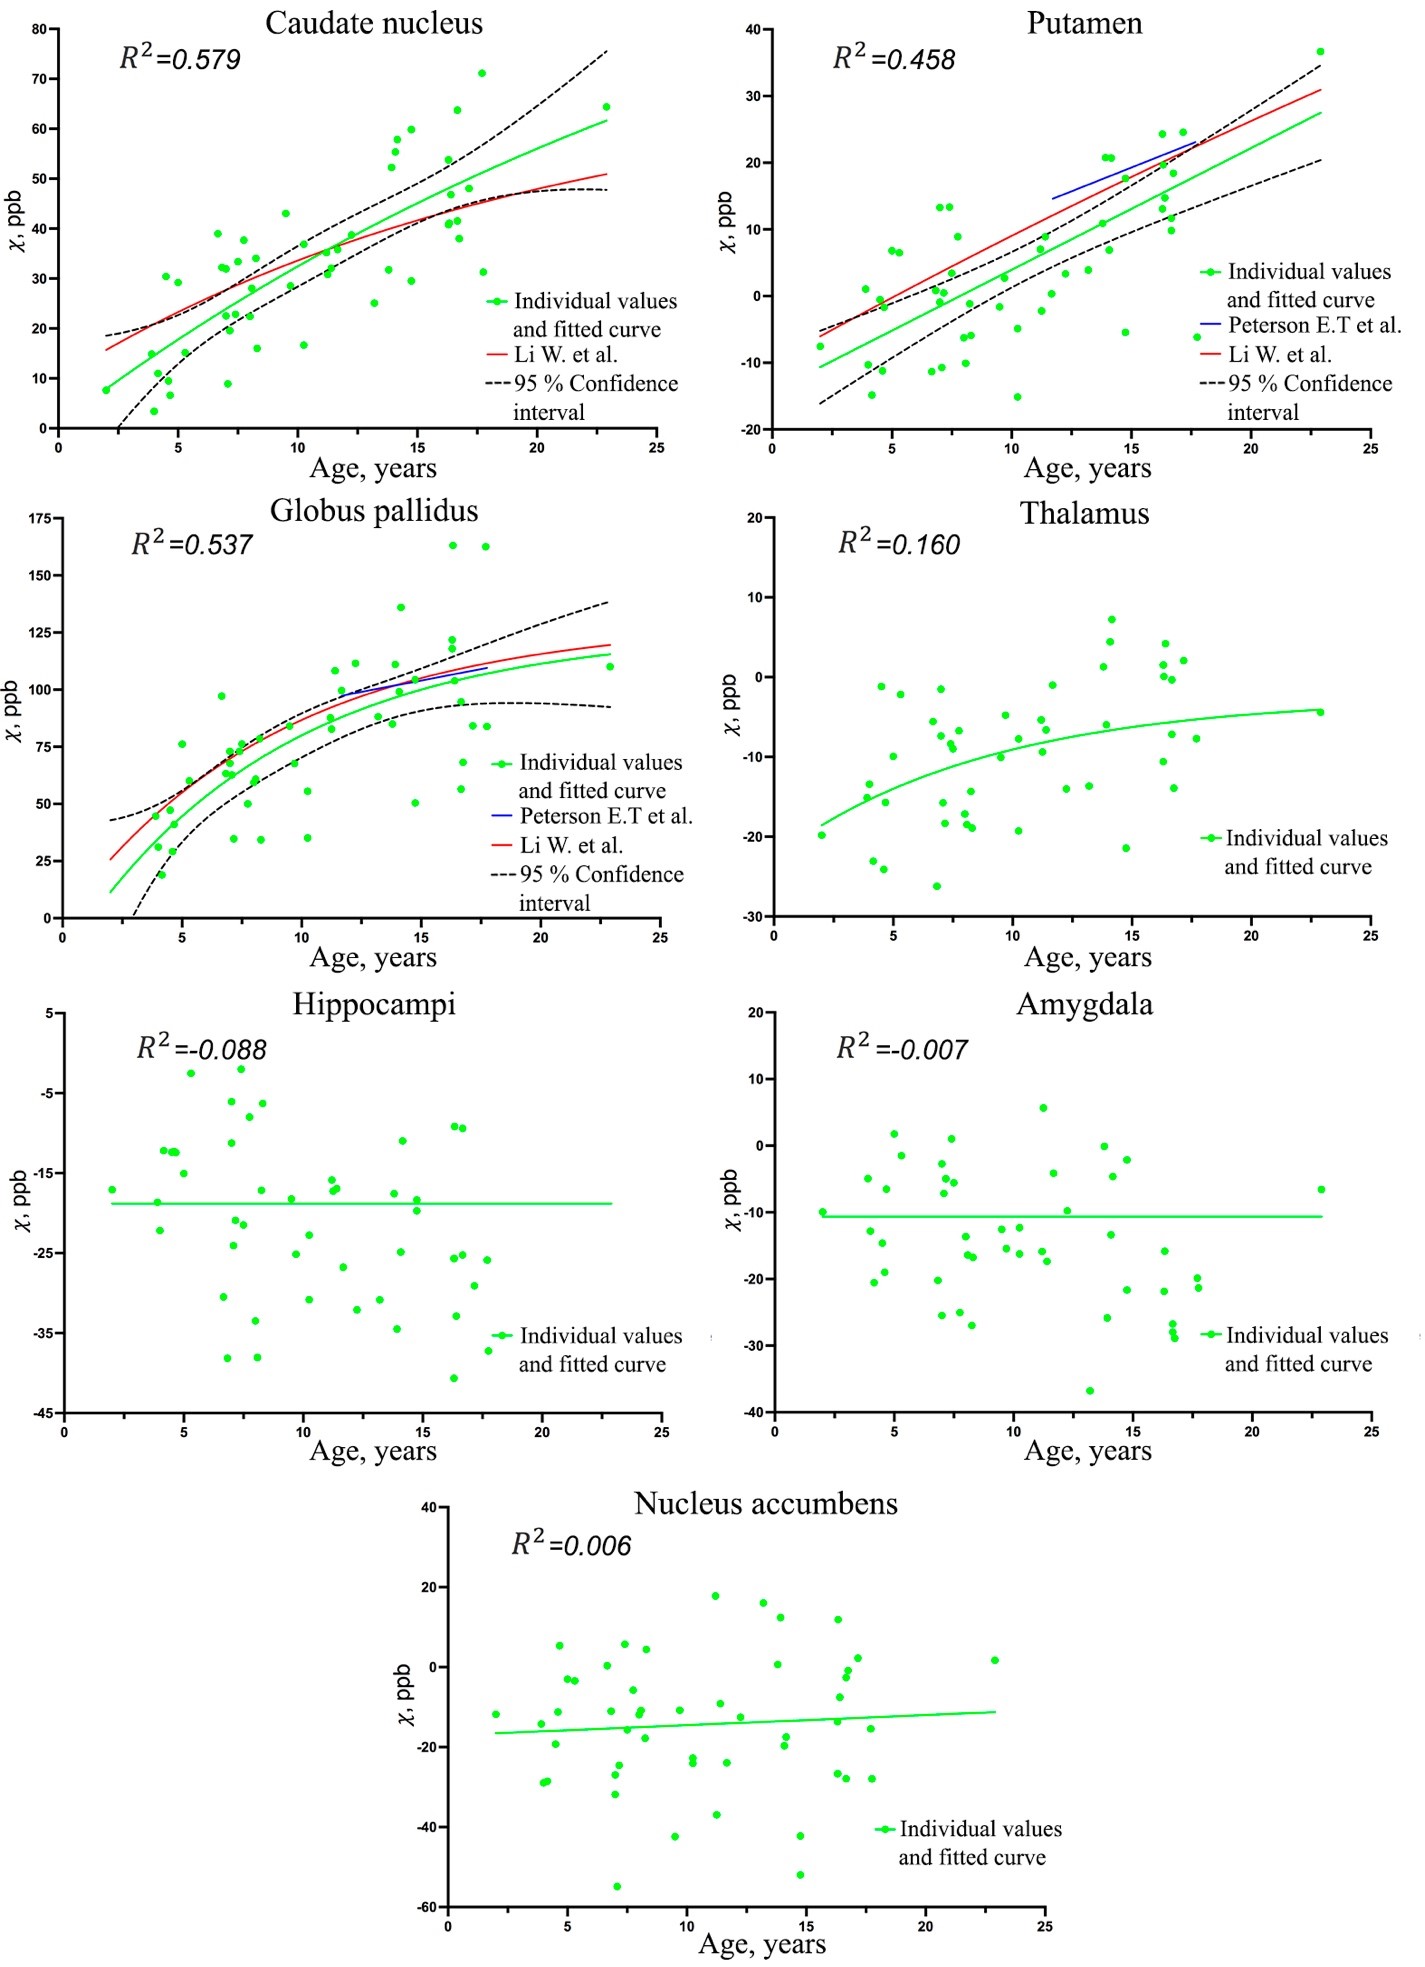
Statistical analysis, which was carried out with and without adjustement for age-related brain iron accumulation, did not reveal any significant differences in brain iron content between the TDT patients and the control group (fig.3, 4).Our data confirmed rapid increase of magnetic susceptibility (which corresponds to iron accumulation) with age in caudate nucleus (CN), putamen (PUT) and globus pallidus (GP) in children and adolescents. Dependence of magnetic susceptibility on age from previously published studies5,6 is also shown in fig.5. No significant iron accumulation was observed in thalamus (THA), hippocampi (HIP), amygdala (AMD) or nucleus accumbens (NAc) (fig.5).
Discussion and conclusions
As far as we know, this is the first study that has compared brain iron content between children and adolescents with TDT and age-matched controls. No significant difference was observed in any of the structures, which is consistent with the results of a recent study7 with participants aged 15 to 66. Thereby, it would seem that iron overload does not occur in brain, whether it be young children or adults. Further studies will show whether this is due to the presence of the blood-brain barrier or the efficacy of modern chelation therapy.Determining the dependence of brain iron content on age played an integral role in our study. Brain iron accumulation in CN, PUT and GP with age is a well-established fact, even though this process and the reasons behind it are not fully understood8. The aforementioned structures are a part of basal ganglia which regulate motor functions and participate in cognitive processes such as reward learning and behaviour. A recent study, according to which iron content in basal ganglia is proportional to general intelligence and processing speed, highlights the role of iron in these processes9. Furthermore, childhood and adolescence are a critical period in the development of higher-order cognitive abilities, accompanied by a drastic rise of dopamine content, the synthesis of which requires iron10. Therefore, the combination of iron increase related to the cognitive development and increased need in iron for dopamine production could explain iron accumulation with age in the control group.
The observed age-related increase in brain iron is in good agreement with the previously published works on this matter. In PUT and GP the slopes of lines tangent to the fitted curves are very close indicating that the speed of brain iron accumulation in this area is consistent across all the studies; the fitted curves are particularly close in the case of GP and are almost tangential.
No significant age-related changes were observed in other areas, one of the possible explanations is that the age-related changes in ferromagnetic iron happen more gradually and are negated by the increase of diamagnetic tissue during the myelination process, which takes place in childhood and adulthood.
Acknowledgements
No acknowledgement found.References
1 Carocci A et al. Oxidative stress and neurodegeneration: the involvement of iron // Biometals : an international journal on the role of metal ions in biology, biochemistry, and medicine vol. 31,5 (2018): 715-735.
2 http://pre.weill.cornell.edu/mri/pages/qsm.html
3 Jenkinson M, Smith S. A global optimisation method for robust affine registration of brain images // Med Image Anal. 2001;5(2):143-156.
4 Fonov V et al. Unbiased nonlinear average age-appropriate brain templates from birth to adulthood // NeuroImage. 2011;54(1):313-327.
5 Li W. et al. Differential developmental trajectories of magnetic susceptibility in human brain gray and white matter over the lifespan // Hum. Brain Mapp. 2014. Vol. 35, № 6. P. 2698–2713.
6 Peterson E.T. et al. Distribution of brain iron accrual in adolescence: Evidence from cross-sectional and longitudinal analysis // Hum. Brain Mapp. 2019. Vol. 40, № 5. P. 1480–1495.
7 Manara R. et al. Brain iron content in systemic iron overload: A beta-thalassemia quantitative MRI study // NeuroImage Clin. 2019. Vol. 24.
8 Larsen B. et al. Longitudinal development of brain iron is linked to cognition in youth // J.Neurosci. 2020. Vol. 40, № 9. P. 1810–1818.
9 Hect J.L. et al. Developmental variation in regional brain iron and its relation to cognitive functions in childhood // Dev. Cogn. Neurosci. 2018. Vol. 34.
10 Larsen B., Luna B. Adolescence as a neurobiological critical period for the development of higher-order cognition // Neuroscience and Biobehavioral Reviews. 2018. Vol. 94
Figures