3574
Magnetic Susceptibility vs Relaxometry in the Characterization of an Animal Model of Multiple Sclerosis
Rehman Ali Tariq1, Rania Muhammed1, Ying Wu1, Qandeel Shafqat1, Hongfu Sun2, and Jeff F. Dunn1
1Radiology, University of Calgary, Calgary, AB, Canada, 2School of Information Techology and Electrical Engineering, University of Queensland, Brisbane, Australia
1Radiology, University of Calgary, Calgary, AB, Canada, 2School of Information Techology and Electrical Engineering, University of Queensland, Brisbane, Australia
Synopsis
Keywords: Quantitative Imaging, Susceptibility, Multiple Sclerosis, Animal Models
There is evidence for changes in magnetic susceptibility in the CNS of people with MS. MRI techniques utilizing relaxometry and magnetic tissue properties – R2* and quantitative susceptibility mapping, respectively – can be used to detect these changes. Both techniques were applied to study pathological changes in EAE mice compared to controls. Significant differences were found in the cortex between EAE mice and controls using R2*, while no differences in magnetic susceptibility were found between the two groups. Although this indicates that R2* may be better at detecting differences, perhaps it can be utilized as a complement to QSM analysis.Introduction
Multiple sclerosis (MS) is a highly debilitating neurodegenerative disease for which is characterized by inflammation, axonal loss, and demyelination1. Current research on MS has found evidence for elevated levels of iron within the central nervous system (CNS) of patients diagnosed with MS2. Furthermore, studies have found reduced CNS oxygen levels in MS patients and animal models of MS, leading to increased deoxyhemoglobin (dHb)3. Deoxyhemoglobin is a susceptibility factor as oxygenation of dHb can change the molecule from deoxyhemoglobin (which is paramagnetic) to oxyhemoglobin (which is diamagnetic)4.Coupled with the increased iron deposition, increased dHb content will cause an increase in magnetic susceptibility, which can be detected through different imaging techniques. Apparent transverse relaxation time (R2*) has been shown to be influenced by both positive susceptibility sources (paramagnetic sources) and negative susceptibility sources (diamagnetic sources)5. Comparatively, quantitative susceptibility mapping (QSM) can be used to calculate absolute magnetic susceptibility of the tissue5. The contribution of positive and negative susceptibility sources will be additive to the R2* and will have opposing effects on magnetic susceptibility, which would indicate that QSM may be more sensitive to changes in MS pathology compared to R2*5. This study aimed to determine if R2* provided similar data to QSM and whether these methods may be useful to study hypoxia in EAE and MS.
Methods
This study was composed of 30 female C57BL/6 mice, with three different treatment groups: EAE (n= 10), CFA-Ptx (n = 10), and Naïve (n = 10). EAE were immunized with 50 µg of myelin oligodendrocyte glycoprotein (MOG) which was mixed with complete Freund’s adjuvant (CFA). A booster injection of pertussis toxin (Ptx) was administered at the time of immunization and two days after. CFA-Ptx mice only were given CFA and Ptx injections. Naïve mice did not receive any injection.EAE and CFA-Ptx mice were scored on a 15-point scale assessing progressive motor dysfunction, with higher scores indicating higher motor dysfunction. Naïve mice were assigned a score of 0. EAE mice were imaged on a 9.4T MRI at when they received scores of 12 or greater. Groups of CFA-Ptx mice and Naïve mice were imaged alongside EAE mice. Data was collected using a 3D multi-gradient echo (MGE) sequence (matrix size = 128 x 106 x 62; field of view = 19.2 mm x 15.9 mm; repetition time = 100 ms; echo spacing = 4 ms; number of averages = 2).
Susceptibility maps were generated from the data using the sparse-linear least squares (LSQR), while R2* data was collected through a mono-exponential decay analysis of signal intensity (Figure 1). Regions of interest (ROIs) analyzed include the cortex, the bilateral hippocampus, and the bilateral thalamus. A student’s t-test was used to compare the mean magnetic susceptibility and calculated R2* across the three groups.
Results
EAE mice had increasing scores starting from Day 7 post-induction, while CFA-Ptx mice did not exhibit motor dysfunction and so were assigned a score of 0.EAE mice had increased R2* compared to CFA-Ptx mice in the left cortex, the right cortex, and the left hippocampus (Figure 2). A significant increase in R2* was found only in the right cortex when comparing EAE mice to Naïve mice (Figure 2). There were no significant differences in R2* between CFA-Ptx mice and Naïve mice for any of the brain regions that were analyzed.
There were no significant difference in magnetic susceptibility between any of the three groups (Figure 3).
Discussion
Increasing motor dysfunction was indicative of disease progression within EAE mice. Both control groups did not develop any motor dysfunction, which has been observed in EAE mouse model studies6.Previous literature indicates that R2* is directly proportional to the deoxyhemoglobin content within tissue7. EAE mice had higher R2* for all brain regions analyzed compared to both control groups, with the differences in the cortex being significant compared to both control groups (Figure 2). This supports previous findings of gray matter hypoxia following EAE induction8.
QSM has been previously used to study people with MS, with significantly increased magnetic susceptibility within subcortical structures5. In this study, there were no significant differences detected (Figure 3). This indicates that QSM may not be as sensitive to hypoxia as R2*. While QSM is the more direct measure of iron content, it seems that QSM is not as sensitive to hypoxia— this may be due to the opposing effects of positive and negative susceptibility sources. QSM is being used to image people with MS but perhaps adding R2* could be a useful aide in understanding the relationship between hypoxia and inflammation.
Conclusion
It was found that R2* can better detect changes within the EAE mouse model compared to QSM. Perhaps this is the result of QSM being sensitive to the opposing effects of positive and negative sources of magnetic susceptibility whereas both types of susceptibility are additive in R2*. While these results may indicate that R2* should be the preferred method in assessing iron content within the CNS, QSM directly measures iron content and relates to changes in WM, and thus it may be more beneficial to use R2* in a complementary fashion to inform analysis of QSM images.Acknowledgements
This work was funded by Natural Sciences and Engineering Research Council (RGPIN-2015-06517), Canadian Foundation for Innovation, and Brain Canada. QS received funding from the NSERC Canada Graduate Scholarships-Master’s program, Hotchkiss Brain Institute Recruitment Scholarship, and the Alberta MS Network. HS received funding from Australian Research Council (DE210101297).References
- Constantinescu, C. S., Farooqi, N., O'Brien, K., Gran, B. (2011). Experimental autoimmune encephalomyelitis (EAE) as a model for multiple sclerosis (MS). British journal of pharmacology, 164(4), 1079–1106. https://doi.org/10.1111/j.1476-5381.2011.01302.x
- Rensburg, S. J., Kotze, M. J., & van Toorn, R. (2012). The conundrum of iron in multiple sclerosis--time for an individualised approach. Metabolic brain disease, 27(3), 239–253. https://doi.org/10.1007/s11011-012-9290-1
- Halder, S.K., Milner, R. (2021). Hypoxia in multiple sclerosis; is it the chicken or the egg?. Brain, 144(2), 402-410. https://doi-org.ezproxy.lib.ucalgary.ca/10.1093/brain/awaa427
- Liu, C., Li, W., Tong, K. A., Yeom, K. W., Kuzminski, S. (2015). Susceptibility-weighted imaging and quantitative susceptibility mapping in the brain. Journal of magnetic resonance imaging : JMRI, 42(1), 23–41. https://doi.org/10.1002/jmri.24768
- Langkammer, C., Schweser, F., Krebs, N., Desitung, A., Goessler, W., Scheurer, E., Sommer, K., Reishofer, G., Yen, K., Fazekas, F., Ropele, S., Reichenbach, J.R. (2012). Quantitative susceptibility mapping (QSM) as a means to measure brain iron? A post mortem validation study. NeuroImage, 62(3), 1593-1599. https://doi.org/10.1016/j.neuroimage.2012.05.049
- Hamilton, A.M., Forkert, N.D., Yang, R., Wu, Y., Rogers, J.A., Yong, V.W., Dunn, J.F. (2019). Central nervous system targeted autoimmunity causes regional atrophy: a 9.4T MRI study of the EAE mouse model of Multiple Sclerosis. Scientific Reports, 9, 8488. doi.org/10.1038/s41598-019-44682-6
- Xin-Long, P., Jing-Xia, X., Jian-Yu, L., Song, W., Xin-Kui, T. (2012). A preliminary study of blood-oxygen-level-dependent MRI in patients with chronic kidney disease. Magnetic Resonance Imaging, 30(3), 330-335. doi.org/10.1016/j.mri.2011.10.003
- Johnson, T.W., Wu, Y., Nathoo, N., Rogers, J.A., Yong, V.W., Dunn, J.F. (2016). Gray Matter Hypoxia in the Brain of the Experimental Autoimmune Encephalomyelitis Model of Multiple Sclerosis. PLoS One, 11(12), e0167196. doi.org/10.1371/journal.pone.0167196
Figures
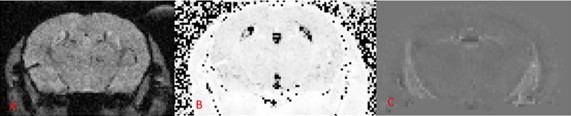
Figure 1. An anatomical image of the analyzed region of the brain (A) along with a
corresponding T2* map calculated using ImageJ (B) and a magnetic
susceptibility map calculated from the same data (C). T2* values
were converted to R2* values after calculating a mean from image B.
All images were taken from an EAE mouse.
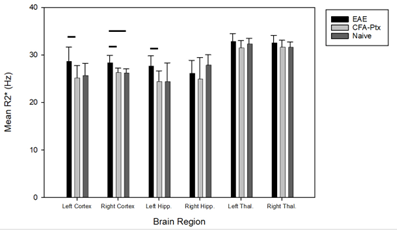
Figure 2. A histogram depicting the mean R2* values for six different
brain regions for EAE mice (n = 10), CFA-Ptx mice (n = 10), and Naïve
mice (n = 10). EAE mice had significantly increased R2* in the left
cortex compared to CFA-Ptx mice (p=0.035). In the right cortex, EAE mice had
significantly decreased T2* compared to both CFA-Ptx mice (p= 0.024) and Naïve
mice (p = 0.031). EAE mice had significantly increased R2* in the
left hippocampus compared to CFA-Ptx mice (p = 0.016). Bars indicate ± SEM.
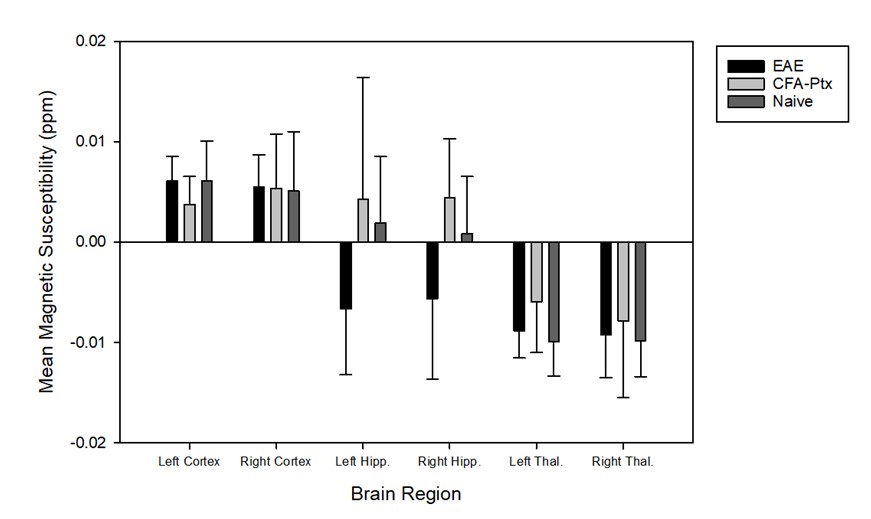
Figure 3. Bar graph showing mean magnetic susceptibility for six different brain
regions for EAE mice (n = 10), CFA-Ptx mice (n = 10), and Naïve mice (n = 10).
There were no significant differences between any of the three groups. Bars
indicate ± SEM.
DOI: https://doi.org/10.58530/2023/3574