3571
Using Compressed Sensing techniques for QSM on multiple sclerosis patients, to what extent can we accelerate?1Imaging department, Rothschild Foundation Hospital, Paris, France, 2Research clinical department, Rothschild Foundation Hospital, Paris, France, 3Institut du Cerveau (ICM) - Paris Brain Institute, Inserm U 1127, CNRS UMR 7225, Sorbonne Université, Paris, France, 4Center for NeuroImaging Research (CENIR), Paris, France, 5MDS Research International, La Rochette, France
Synopsis
Keywords: Quantitative Imaging, Quantitative Susceptibility mapping
Despite the characterization of in-vivo biomarkers of MS pathophysiology, there is still a gap between histological knowledges and morphological MRI as it is performed in clinical practice. New MRI advanced techniques, such as quantitative susceptibility mapping (QSM) might help to better describe the disease, but long acquisition times are limiting their uses. Adding acceleration techniques can reduce this time. However, there is no current evidence about their impact on QSM values. Thus, we added four QSM sequences to our clinical protocol of MS follow-up, varying the acceleration factor from classical SENSE (2*2) to high compressed-sense (6, 9, and 12).INTRODUCTION
Pathophysiology of Multiple Sclerosis (MS) has been widely described with histology [1],[2] and numerous efforts have been made for the characterization of in-vivo biomarkers using MRI or nuclear medicine studies [3],[4]. Morphological MRI as it is performed in clinical practice fails to detect and quantify MS pathophysiology mechanisms, such as myelination and inflammation. MRI advanced techniques has the potential to assess iron content retained by activated microglia/macrophages during inflammation, such as quantitative susceptibility mapping (QSM) [5]. Nonetheless, long acquisition times and complex post-processing are limiting the possibilities of incorporating QSM into clinical protocols.Several acceleration techniques may be added to susceptibility sequences. Among those, compressed-sense (CS) has the potential to allow a millimetric isotropic acquisition to be done in a short duration that would be usable in clinical protocols. However, the reproducibility of QSM data based on MRI parameters has been poorly described, in particular regarding acceleration factor.
In this project, we aimed to investigate the impact of CS on QSM data compared to SENSE, a more conservative and widely used acceleration factor.
METHODS
Twenty-four MS patients underwent a 3T MRI scan (Ingenia, Philips Healthcare) as part of their clinical routine, including a set of QSM data with variable level of CS (6, 9 and 12) (Figure 1). Clinical protocol included T1 EG, FLAIR and susceptibility imaging with SENSE 2*2. Parameters of the four QSM sequences are detailed below.QSM raw data were acquired using a 3D-FFE sequence with the following parameters: FOV: 240*240*176 mm3, Voxel size = 1.0*1.2*1.0 mm3 reconstructed to 1.0*1.0*1.0 mm3. Elliptical scan, TR = 41 ms, TEs = 3.1 ms to 36.1 ms with a ΔTE of 3 ms, Bandwidth per pixel = 913.7 Hz. Acceleration factor used were SENSE 2*2, CS-SENSE 6, CS-SENSE 9 and CS-SENCE 12, leading to a total scan time of respectively: 4 min 43 s, 3 min 20 s, 2 min 54 s and 1 min 40 s. For susceptibility maps reconstruction, the local field map was calculated by non-linear fitting the complex gradient echo signal over echo times, then background field removal was performed using the pre-conditioned Laplacian boundary value method (LBV) and the inversion was solved using the L1-MEDI method.
T2 hyperintense lesions were segmented on FLAIR with reference to T1, and corresponding lesion masks were aligned to the T1 scan using ANTS. After performing a lesion-filling, T1 scans were segmented using FIRST. Thus, we obtained the following region-of-interests (ROI): putamen, caudate nucleus, and T2 hyperintense lesions. We used putamen and caudate as reference ROIs as there QSM signal is well characterized.
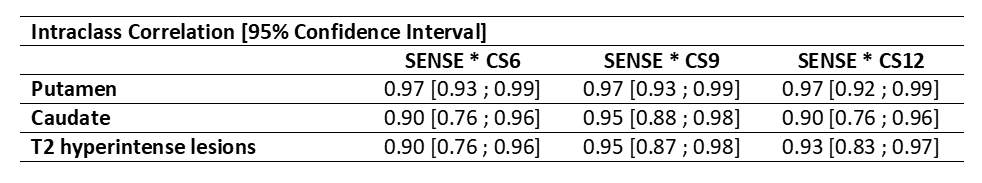
For each ROI, concordance between each CS factor and SENSE was evaluated using a Bland-Altman plot and an intraclass correlation with 95% confidence interval.
RESULTS
CS-SENSE technique showed a promising ability to reduce scan time, ranging from 4 min 43 for the SENSE acquisition to 1 min 40 s for the highest CS factor. This major reduction of the scan time came with a stable intraclass correlation across each reference ROIs, as well as confidence interval suggestive of a high reproducibility between techniques (Table 1).We found similar results for T2 hyperintense lesions showing intraclass correlation classified as excellent.
DISCUSSION
In this project, we demonstrated the stability of the QSM signal, varying the acceleration factor starting from common factor used in clinic to high factors to drastically reduce the scan duration. These results are encouraging for a widely used of this technique in clinical practice, especially for MS patients and the WM lesions characterization. However, we still need to demonstrate that none of the anatomical information from the magnitude images used in image reading is lost with the acceleration.Moreover, based on this results, reproducibility of other reconstruction technique such as the 𝜒-separation [6], which might help to differentiate iron/myelin contribution should be investigated and later translate into clinical practice.
Acknowledgements
EP, JS, JG, MS have nothing to disclose regarding this work.References
[1] H. Lassmann, « Pathology and disease mechanisms in different stages of multiple sclerosis », J. Neurol. Sci., vol. 333, no 1, p. 1‑4, oct. 2013, doi: 10.1016/j.jns.2013.05.010.
[2] H. Lassmann, « Pathogenic Mechanisms Associated With Different Clinical Courses of Multiple Sclerosis », Front. Immunol., vol. 9, p. 3116, 2019, doi: 10.3389/fimmu.2018.03116.
[3] B. Bodini et al., « Individual mapping of innate immune cell activation is a candidate marker of patient-specific trajectories of disability worsening in Multiple Sclerosis », J. Nucl. Med., janv. 2020, doi: 10.2967/jnumed.119.231340.
[4] C. Louapre, B. Bodini, C. Lubetzki, L. Freeman, et B. Stankoff, « Imaging markers of multiple sclerosis prognosis », Curr. Opin. Neurol., vol. 30, no 3, p. 231‑236, 2017, doi: 10.1097/WCO.0000000000000456.
[5] K. Deh et al., « Magnetic susceptibility increases as diamagnetic molecules breakdown: Myelin digestion during multiple sclerosis lesion formation contributes to increase on QSM: Myelin Breakdown in MS Lesion Formation », J. Magn. Reson. Imaging, vol. 48, no 5, p. 1281‑1287, nov. 2018, doi: 10.1002/jmri.25997.
[6] H.-G. Shin et al., « χ-separation: Magnetic susceptibility source separation toward iron and myelin mapping in the brain », NeuroImage, vol. 240, p. 118371, oct. 2021, doi: 10.1016/j.neuroimage.2021.118371.
Figures
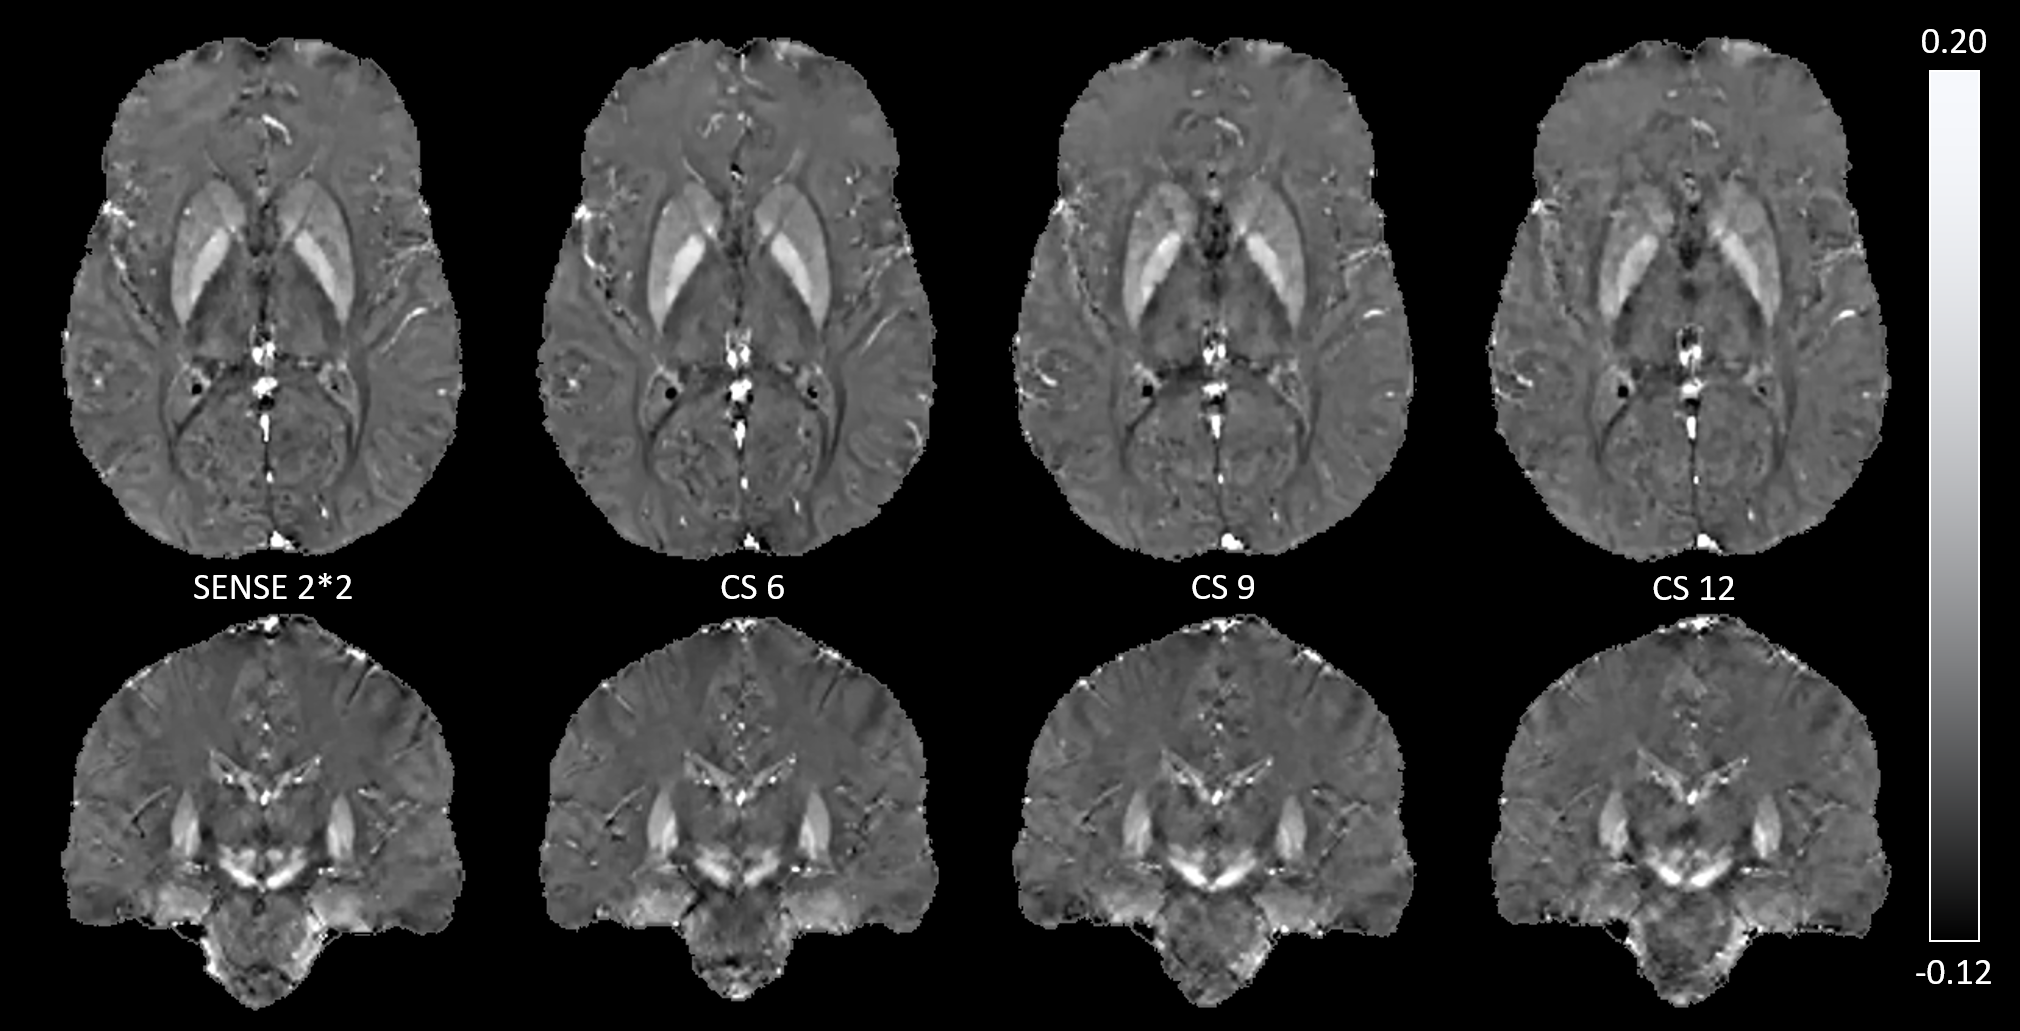
Figure 1. QSM sequences acquired with variable acceleration factor
Axial and coronal quantitative susceptibility mapping sequences of a patient with relapsing-remitting multiple sclerosis (male, 43yo, disease duration : 8 years) with variable acceleration factors (from left to right, SENSE 2*2, compressed-sense 6, 9, and 12).
Range values : -0.12 to 0.20 ppm