3570
Imaging the myelin in brain deep gray matters during brain development using sub-voxel QSM1Shanghai Jiao Tong University, Shanghai, China
Synopsis
Keywords: Quantitative Imaging, Quantitative Susceptibility mapping
Myelin is a non-neglectable susceptibility source in deep gray matter (DGM) nuclei. Myelination and demyelination processes are essential in DGMs during brain development and aging. However, they have not been investigated by MRI yet. We used a sub-voxel QSM method to independently image and quantify the myelin concentration in brain DGM. We recruited 32 healthy subjects with ages from 4 to 39 years old to describe the DGM myelination and demyelination trajectories. The results suggest that different DGMs display various development trajectories during brain development.Introduction
Conventional QSM is a promising technique that has shown great potential for quantifying the magnetic susceptibility, generally reflecting the iron in deep gray matter (DGM) and myelin in white matter1. The tight association of iron deposition with axonal myelination has been reported in normal brain development and aging2,3. In the DGM nuclei, multiple processes with these substances might co-occur with the limited spatial resolution of the current MRI. Previous studies mainly focused on the content and variation of iron deposition in DGMs4,5. Because iron is the dominant paramagnetic susceptibility source in DGMs. The traditional QSM methods cannot differentially quantify paramagnetic iron and diamagnetic myelin within the same voxel in DGMs, so the subtle diamagnetic myelin effect was overlooked for a long time. However, the histological study has revealed the non-neglectable myelin concentration in DGM nuclei6. In this study, we used a sub-voxel QSM method to image and quantify the subtle diamagnetic susceptibility of myelin in five DGM nuclei during brain development and aging.Methods
Diamagnetic susceptibility map reconstructionIn human brain tissue, the highest concentration sources are paramagnetic iron and diamagnetic myelin. These opposing susceptibility sources could induce inhomogeneities in the static magnetic field. These inhomogeneities, including $$$R_2^*$$$ relaxation and frequency shift $$$\Delta f$$$, can be detected by gradient recalled echo (GRE) sequence and modeled using multi-echo GRE signal $$$S$$$7,8:
$$S\left({T{E_j}}\right)={M_0}{e^{-\left({{R_2}+a|{\chi_{para}}\ \ |+a|{\chi_{dia}}\ |}\right)T{E_j}}}\cdot{e^{i\left\{{{\phi_{res}}\ \ +2\pi{f_{bg}}\ {TE_j}+2\pi\gamma{B_0}\left[{D*\left({{\chi_{para}}\ \ +{\chi_{dia}}}\ \right)}\right]T{E_j}}\right\}}}\tag{1}$$
where $$$M_0$$$ is the extrapolated magnitude signal at echo time $$$(TE)$$$=0ms. $$$\chi_{para}$$$ and $$$\chi_{dia}$$$ are paramagnetic iron and diamagnetic myelin susceptibilities. $$$D$$$ is the dipole kernel and $$$*$$$ denotes the spatial convolution. $$$R_2$$$ relaxation can be obtained by the T2 mapping sequence. The magnitude decay kernel $$$a$$$ represents the proportionality constant between $$$R_2'=(R_2^*-R_2)$$$ and the absolute susceptibility. $$$\gamma$$$ is the gyromagnetic ratio and $$$\phi_{res}$$$ is the time-independent initial phase. $$${2\pi{f_{bg}}{TE_j}}$$$ denotes the background phase at $$$j^{\ th}$$$ echo times. The model could be formulated as the following optimization:
$$\mathop{\arg\min}\limits_{{\chi_{para}}\ \ ,\ {\chi _{dia}}\ ,\ {\phi _{res}}}\left({\matrix{{{\lambda _1}\left\| {R_2^*-{R_2}-a\left({{\chi _{para}}-{\chi _{dia}}}\right)}\right\|_2^2}\cr{+\sum\limits_{j=1}^N{i\left\|{{\phi _{uw,\ T{E_j}}}-{\phi_{res}}-2\pi\left\{{{f_{bg}}+\gamma{B_0}\left[{D*\left({{\chi _{para}}+{\chi _{dia}}}\right)}\right]}\right\}T{E_j}}\right\|_2^2} }\cr{+{\lambda _2}\left\|{\chi-\left({{\chi_{para}}+{\chi _{dia}}}\right)}\right\|_2^2+{\lambda_3}\left({TV\left({{\chi_{para}}}\right)+TV\left({{\chi _{dia}}}\right)}\right)}\cr}}\right)\tag{2}$$
where $$$\phi_{uw,\ TE_j}$$$ is the unwrapped phase image, and $$$\chi$$$ is a pre-reconstructed QSM map. $$$TV(\cdot)$$$ is a 3D spatial total variation operator. $$$\lambda_1$$$, $$$\lambda_2$$$ and $$$\lambda_3$$$ are the regularization factors.
The myelin susceptibility map $$$(\chi_{dia})$$$ can be separated by Eq. $$$(2)$$$ with an iterative algorithm to alternately estimate the magnitude decay kernel $$$a$$$ and the sub-voxel susceptibility maps.
Data acquisition and image analysis
A number of 32 healthy subjects (age=18.3±9.9 years, age range=[4, 39] years; 22 males and 10 females) were recruited. The subjects’ MR data were acquired at 3T. The scan parameters of the 3D GRE were: FOV=230×230×160mm3; matrix size=224×224×80; spatial resolution=1.03×1.03×2mm3; TR=40 ms; TE1/spacing/TE7=2.4/4.3/28.2ms. A 2D multi-echo spin echo sequence was used for $$$R_2$$$ estimation. The scan parameters were: FOV=230×230mm2; matrix size=224×224; slice number=80; spatial resolution=1.03×1.03×2mm3; TR=3864ms; TE1/spacing/TE5=16.1/16.1/80.5ms.
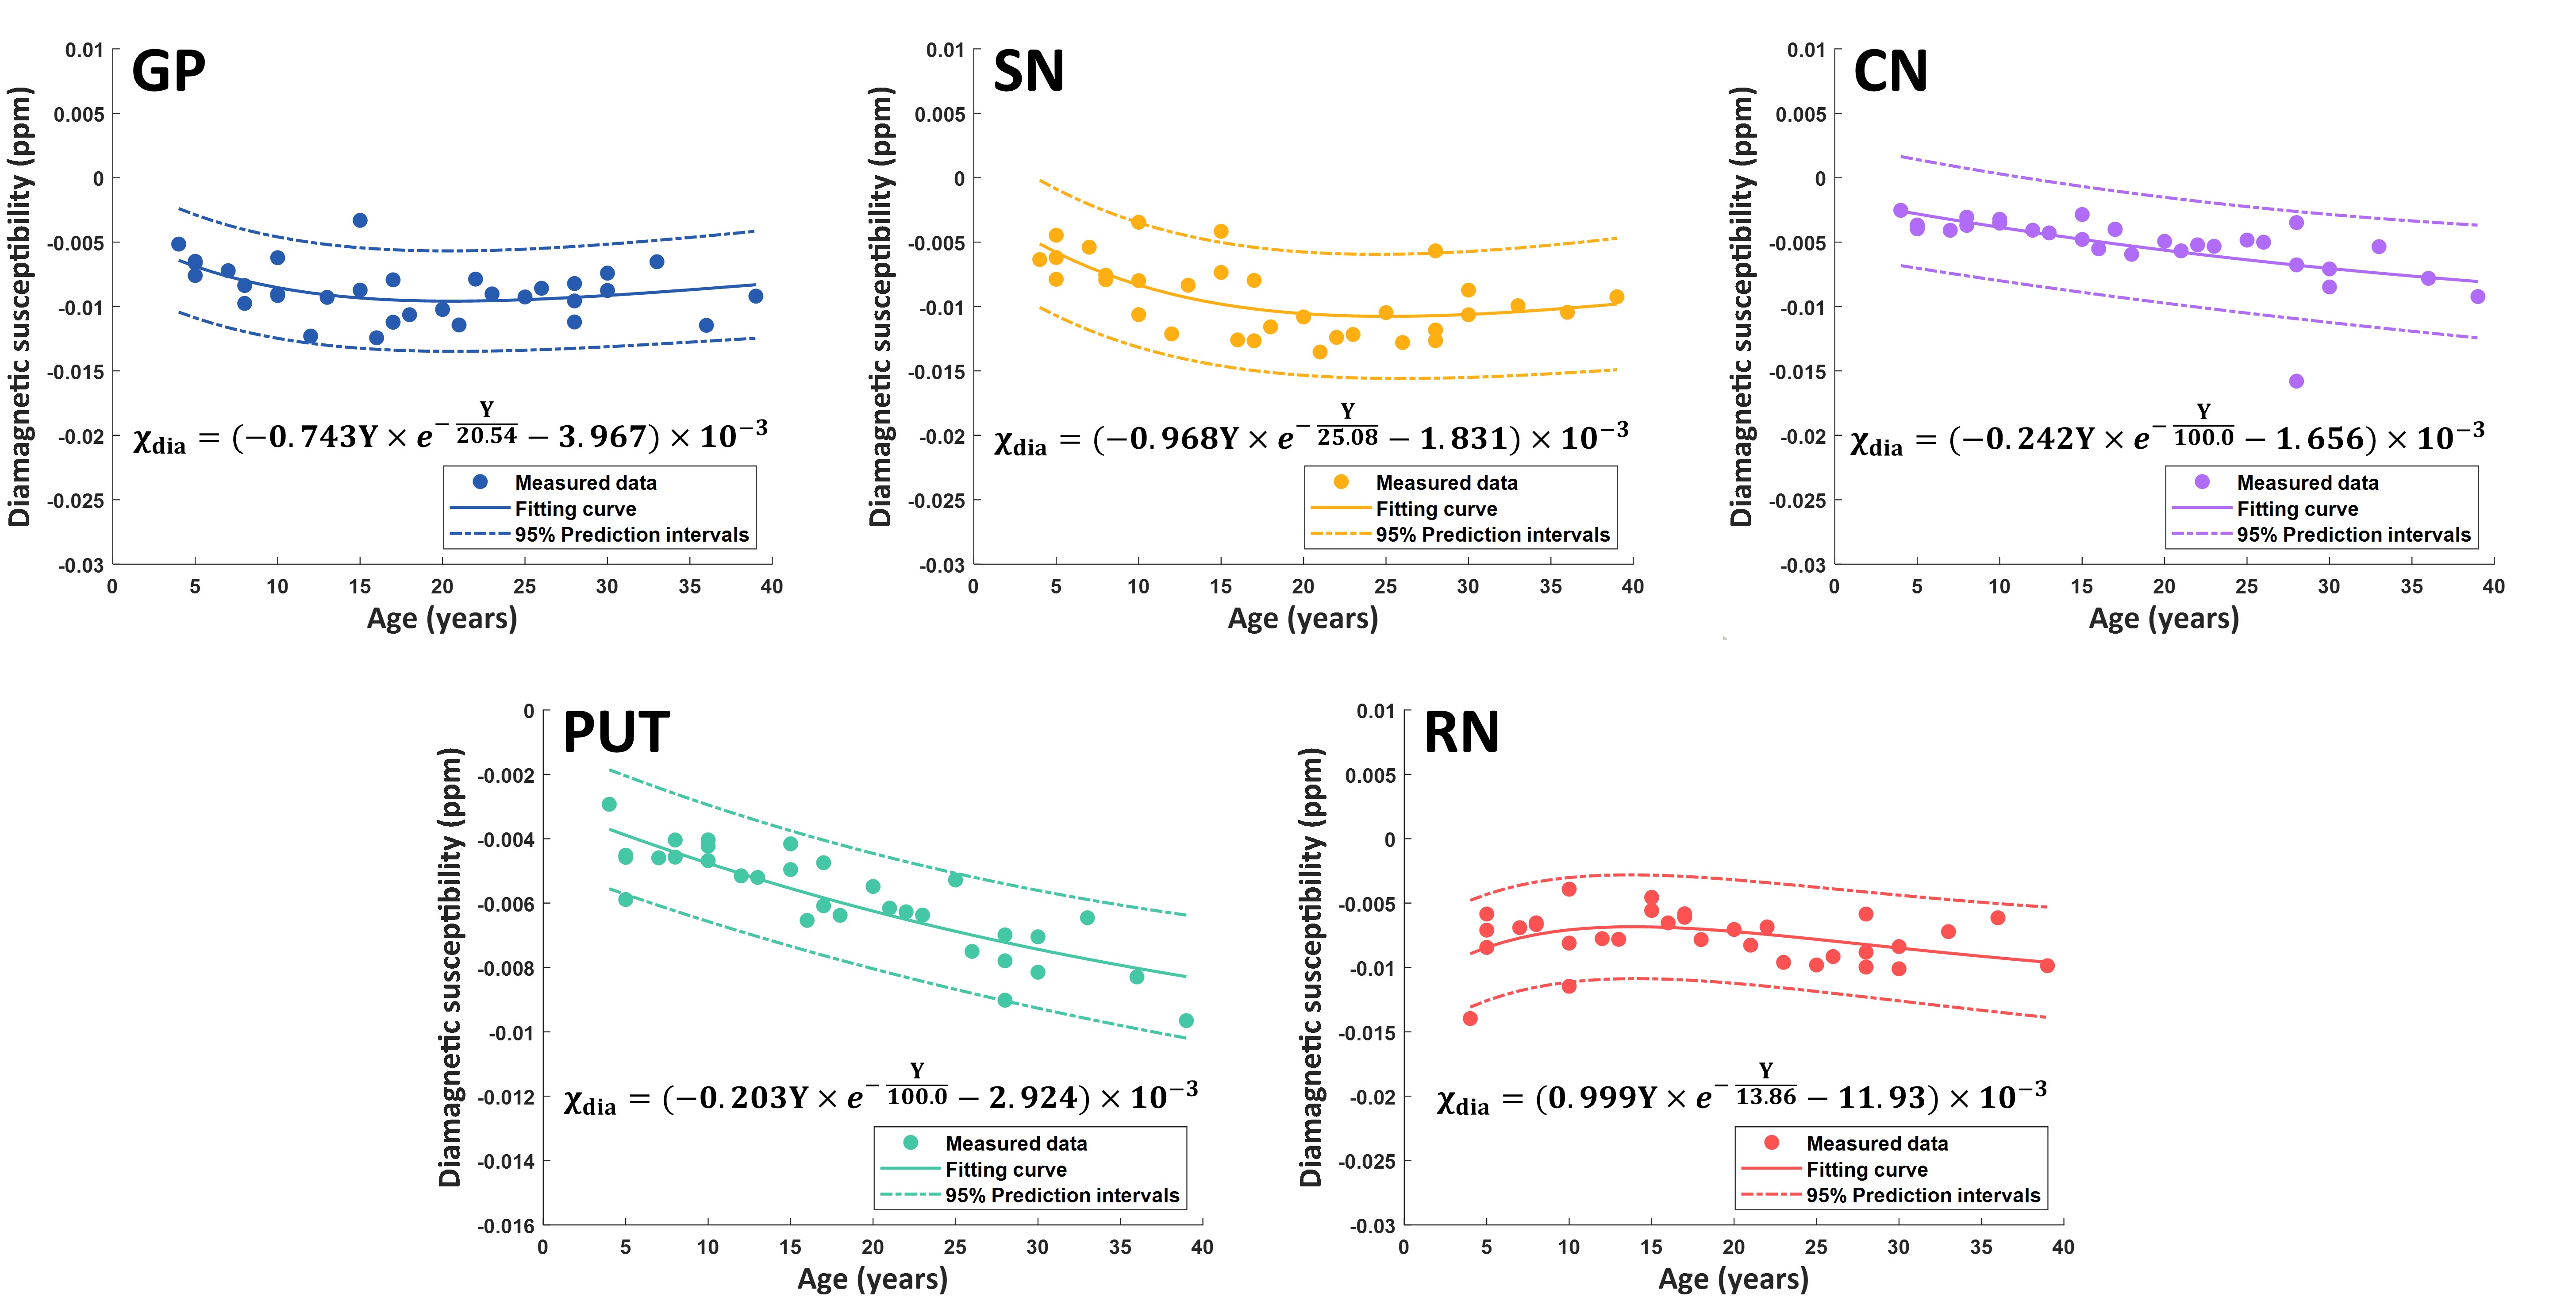
Five DGM ROIs of 32 subjects were manually extracted by two experts, including globus pallidus (GP), putamen (PUT), caudate nucleus (CN), substantia nigra (SN), and red nucleus (RN). The final labels took the intersection of the ROIs from two experts. The mean diamagnetic susceptibility values in the DGMs of each subject were computed. The temporal changes of DGM myelination were quantified to explore the myelin variation in DGMs during aging. The Poisson fitting curve was used for fitting the diamagnetic susceptibilities in DGMs according to the previous study1 with a model of:
$${\chi_{dia}}={\beta_1}Y{e^{-{Y\over{{\beta_{\ 2}}}}}}+{\beta_3}\tag{3}$$
where $$$[\beta_1,\ \beta_2,\ \beta_3]$$$ is the fitting coefficients array and $$$Y$$$ is subjects’ ages.
Results
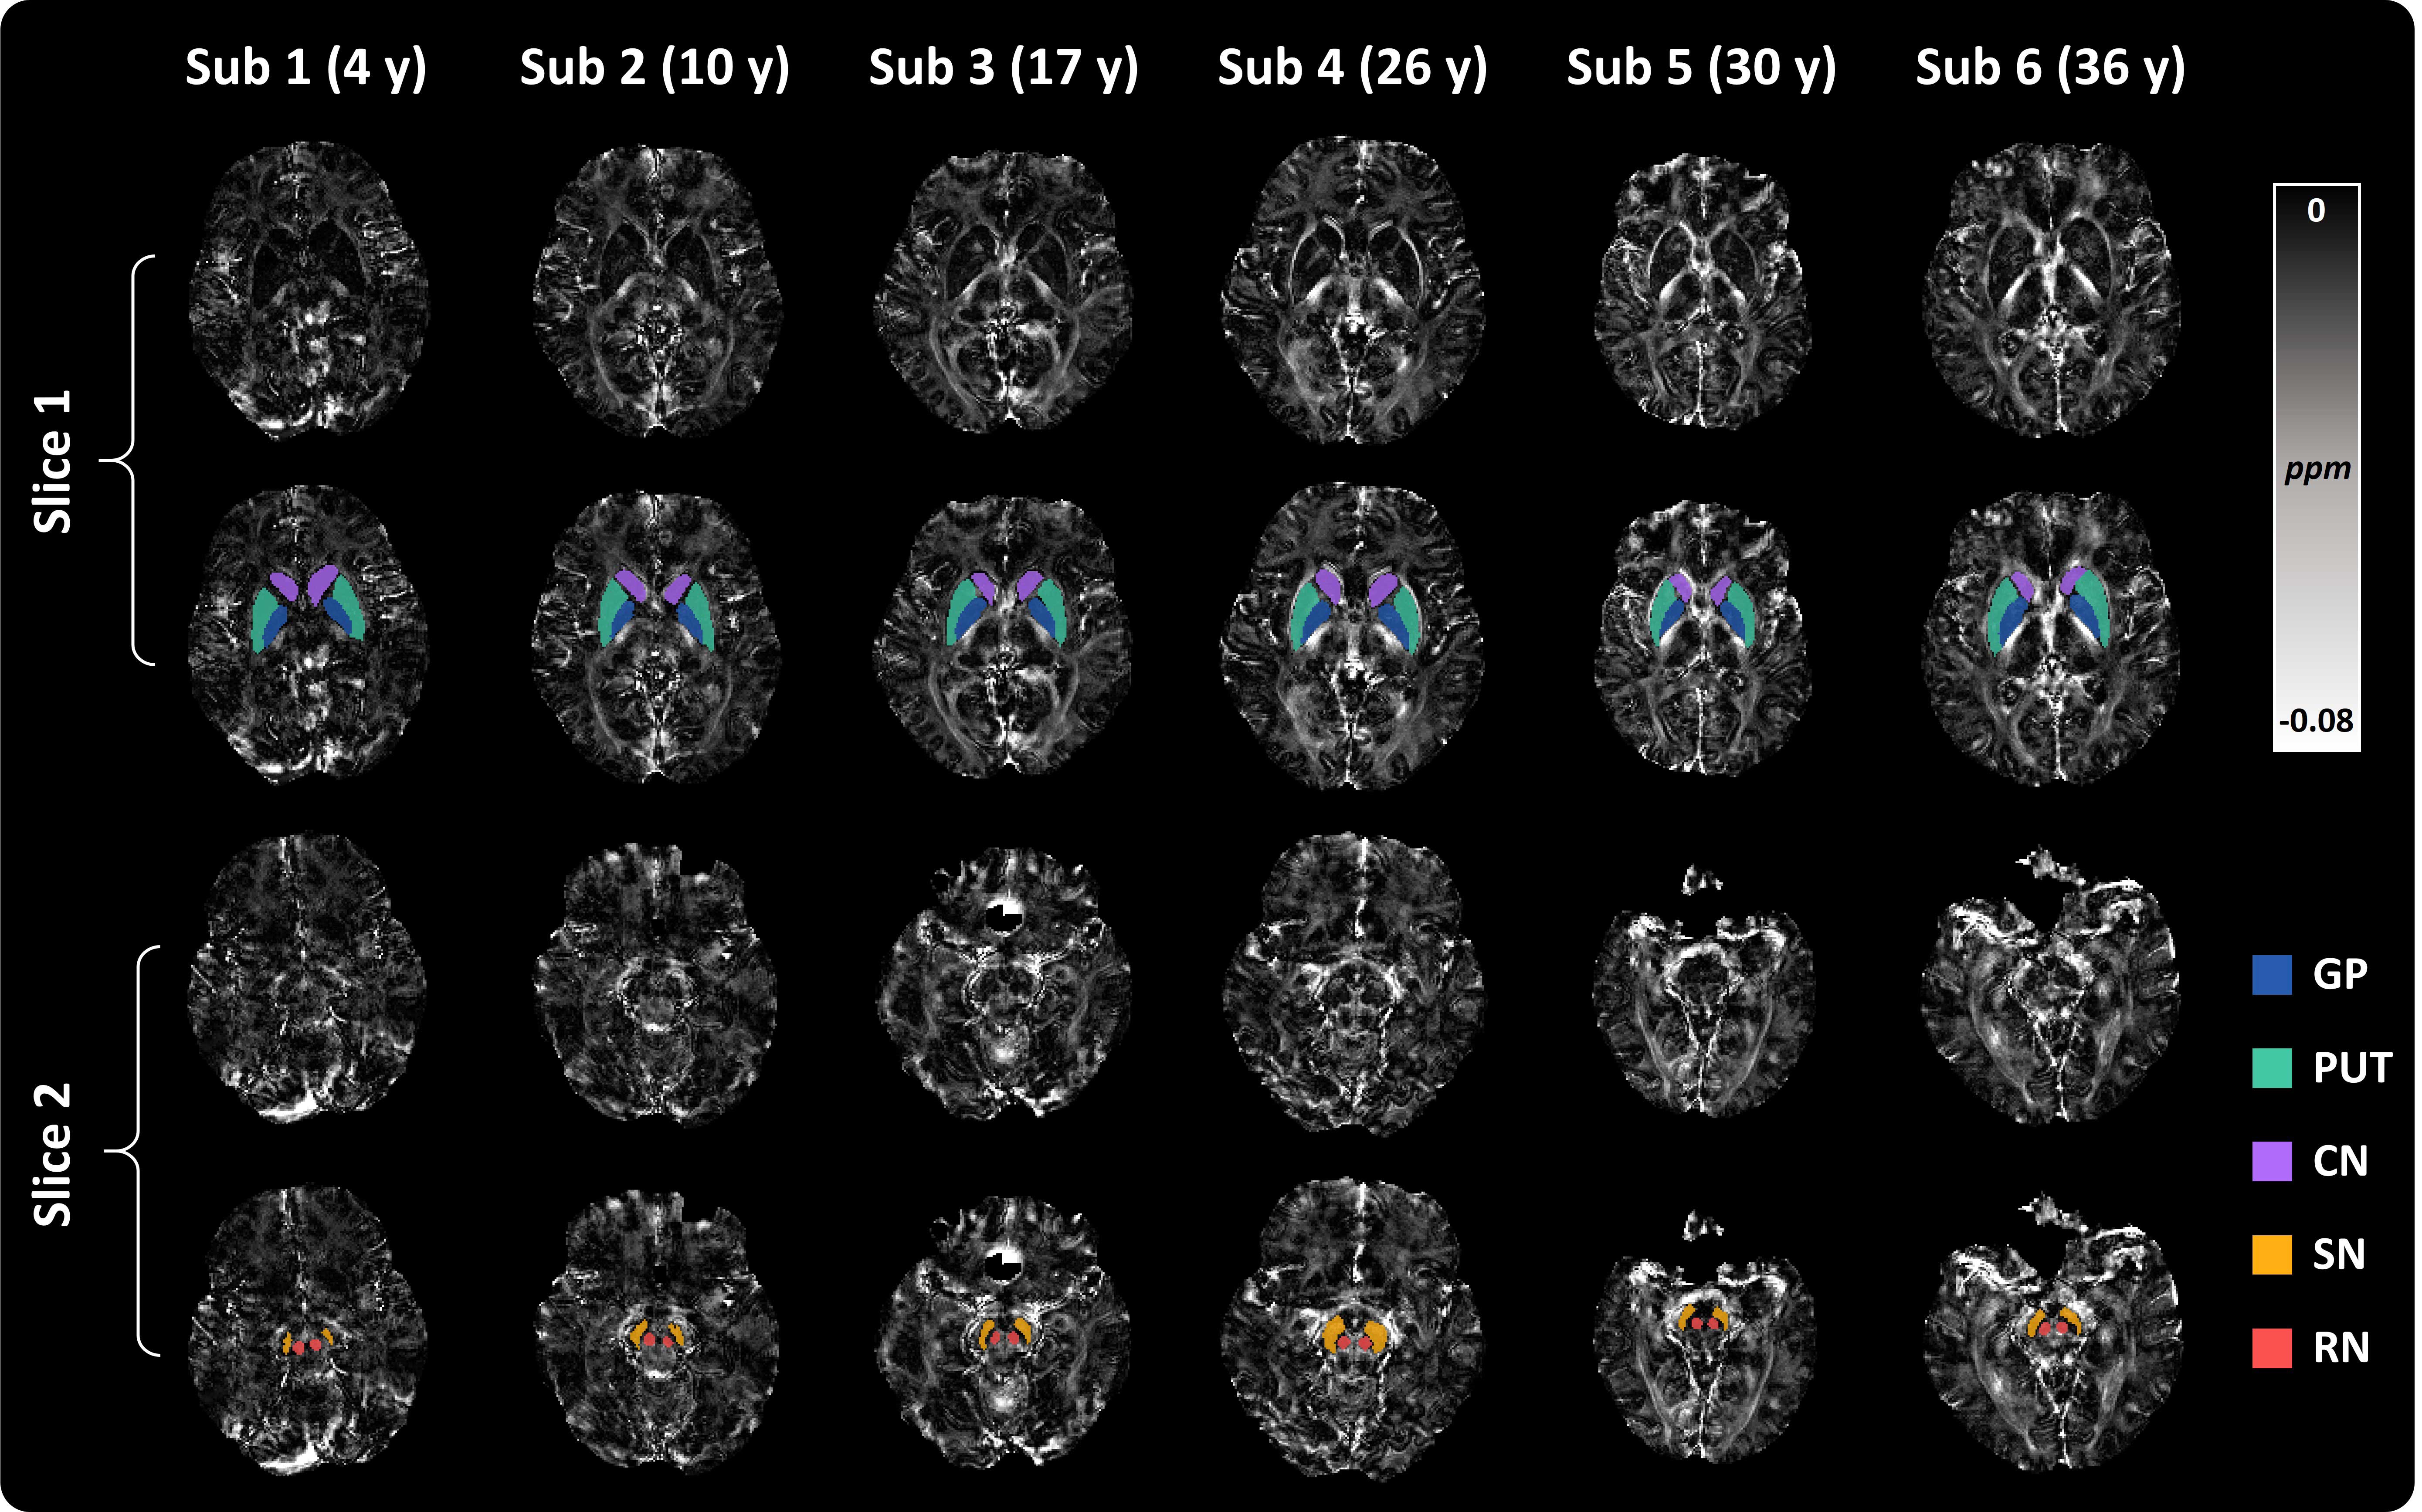
Diamagnetic susceptibility in DGM nuclei could be observed in subjects of different ages, as shown in Fig. 1. Compared with surrounding white matter, the diamagnetic susceptibility in DGMs reveals a relatively lower myelin concentration. Subject-specific DGM labels are used for quantified analysis.Fig. 2 shows the diamagnetic susceptibility changes in five DGM nuclei as a function of age across all subjects. In the GP, the mean diamagnetic susceptibility value gradually decreases (more diamagnetic) from 4 to 15 years, then reaches its minimum at around 20 years of age. In the SN, diamagnetic susceptibility decreases more rapidly from 4 to 20 years and reaches its peak diamagnetic values around 25 years of age. Differently, the diamagnetic susceptibilities in the CN and PUT maintain the trend of decreasing until 39 years old. The RN shows a different trajectory compared with the GP and SN that the diamagnetic susceptibility value increases first from 4 to 10 years, followed by a gradual decrease to 39 years old. These DGMs trajectories express diverse patterns of myelin development.
Discussion and Conclusion
In this study, we investigate the normal myelination and demyelination process in DGMs using a sub-voxel QSM method. DGMs exhibit different temporal myelin trajectories during normal brain development and aging. These DGMs’ temporal myelin trajectories could be used to differentiate abnormal alterations associated with related brain disorders, such as multiple sclerosis9.Acknowledgements
This study is supported by the National Natural Science Foundation of China (61901256, 91949120, 62071299).References
1. Li W, Wu B, Batrachenko A, et al. Differential developmental trajectories of magnetic susceptibility in human brain gray and white matter over the lifespan. Hum Brain Mapp. 2014;35(6):2698-2713.
2. Moller HE, Bossoni L, Connor JR, et al. Iron, Myelin, and the Brain: Neuroimaging Meets Neurobiology. Trends Neurosci. 2019;42(6):384-401.
3. Ward RJ, Zucca FA, Duyn JH, et al. The role of iron in brain ageing and neurodegenerative disorders. The Lancet Neurology. 2014;13(10):1045-1060.
4. Barbosa JH, Santos AC, Tumas V, et al. Quantifying brain iron deposition in patients with Parkinson's disease using quantitative susceptibility mapping, R2 and R2. Magn Reson Imaging. 2015;33(5):559-565.
5. He N, Ghassaban K, Huang P, et al. Imaging iron and neuromelanin simultaneously using a single 3D gradient echo magnetization transfer sequence: Combining neuromelanin, iron and the nigrosome-1 sign as complementary imaging biomarkers in early stage Parkinson's disease. Neuroimage. 2021;230:117810.
6. Schaltenbrand G. Atlas for stereotaxy of the human brain. Georg Thieme. 1977.
7. Deistung A, Schweser F, Reichenbach JR. Overview of quantitative susceptibility mapping. NMR Biomed. 2017;30(4).
8. Yablonskiy DA, Haacke EM. Theory of NMR signal behavior in magnetically inhomogeneous tissues: the static dephasing regime. Magn Reson Med. 1994;32(6):749-763.
9. Haider L, Simeonidou C, Steinberger G, et al. Multiple sclerosis deep grey matter: the relation between demyelination, neurodegeneration, inflammation and iron. J Neurol Neurosurg Psychiatry. 2014;85(12):1386-1395.
Figures