3568
Detecting whole mouse brain beta-amyloid plaques in 5xFAD mice using high-resolution quantitative susceptibility mapping1Radiology and Imaging Sciences, Indiana University, Indianapolis, IN, United States, 2Boston University, Boston, MA, United States
Synopsis
Keywords: Alzheimer's Disease, Alzheimer's Disease, beta-amyloid
Alzheimer’s disease (AD) is an age-associated neurodegenerative disease that is reaching epidemic proportions as a result of the aging of the world’s population. It is likely that the most effective treatment for AD will need to be administrated before cognitive symptoms occur, necessitating a biomarker for the early stages of AD. Novel high-resolution MRI technologies with the capability to characterize the individual beta-amyloid plaque through the whole brain is highly desirable.Purpose
To detect and quantify the beta-amyloid plaques through whole mouse brain using high-resolution Quantitative susceptibility mapping (QSM).Introduction
Although the cause of AD is not fully understood, clinical and neuropathological studies have hypothesized that the formation of beta-amyloid (Aβ) plaques and tau neurofibrillary tangles are crucial to the pathogenesis of AD.1,2 Quantitative susceptibility mapping (QSM) affords unique image contrasts and has gained prominence to non-destructively probe the tissue microstructure.3 The capability of distinguishing the individual plaques by high-resolution QSM could be a sensitive imaging biomarker for detecting and monitoring Aβ pathology of AD.4Methods
Animal experiments were carried out in compliance with the local IACUC Committee. The B6, 5xFAD, 5xFADP522R (P522R is a protective variant for AD), and 5xFADM28L (M28L is a risk variant for AD) mice were chosen for brain imaging. Animals were sacrificed and perfusion fixed with a 1:10 mixture of ProHance-buffered formalin to shorten T1 and reduce scan time.5 The specimens were scanned at 9.4 T (Bruker, Billerica, MA) scanner using a modified 3D multi gradient echo (MGRE) pulse sequence at 25 μm isotropic resolution. The repetition time (TR) was 100 ms with 2 echoes. The phase data from the MGRE acquisition was used to reconstruct QSM images using STI Suite (University of California, Berkeley, CA).3,6 The phase of the raw data was unwrapped using a Laplacian-based phase unwrapping method. The background phase was removed using the V-SHARP method. The magnetic susceptibility was then obtained from the local tissue phase by solving an inverse problem using the improved LSQR (iLSQR) method. After MRI, the brain samples were performed with conventional histology for beta-amyloid to validate MRI findings.Results
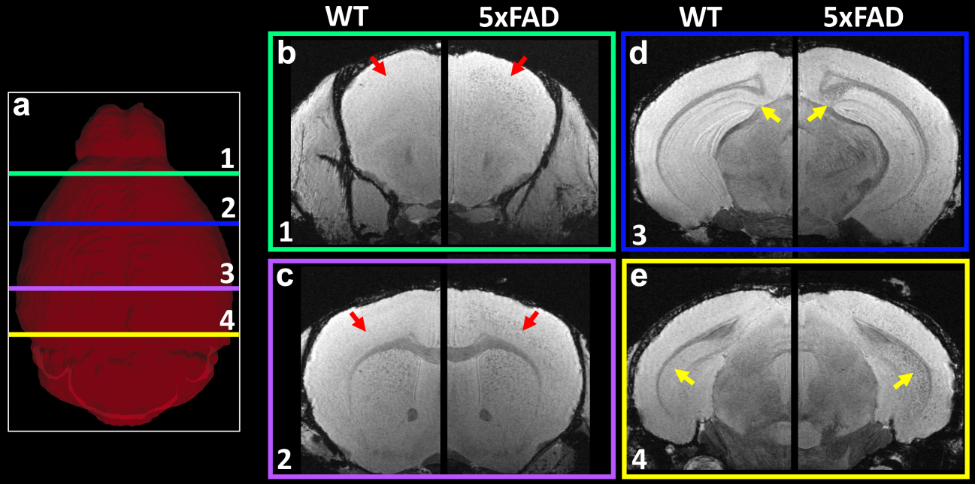
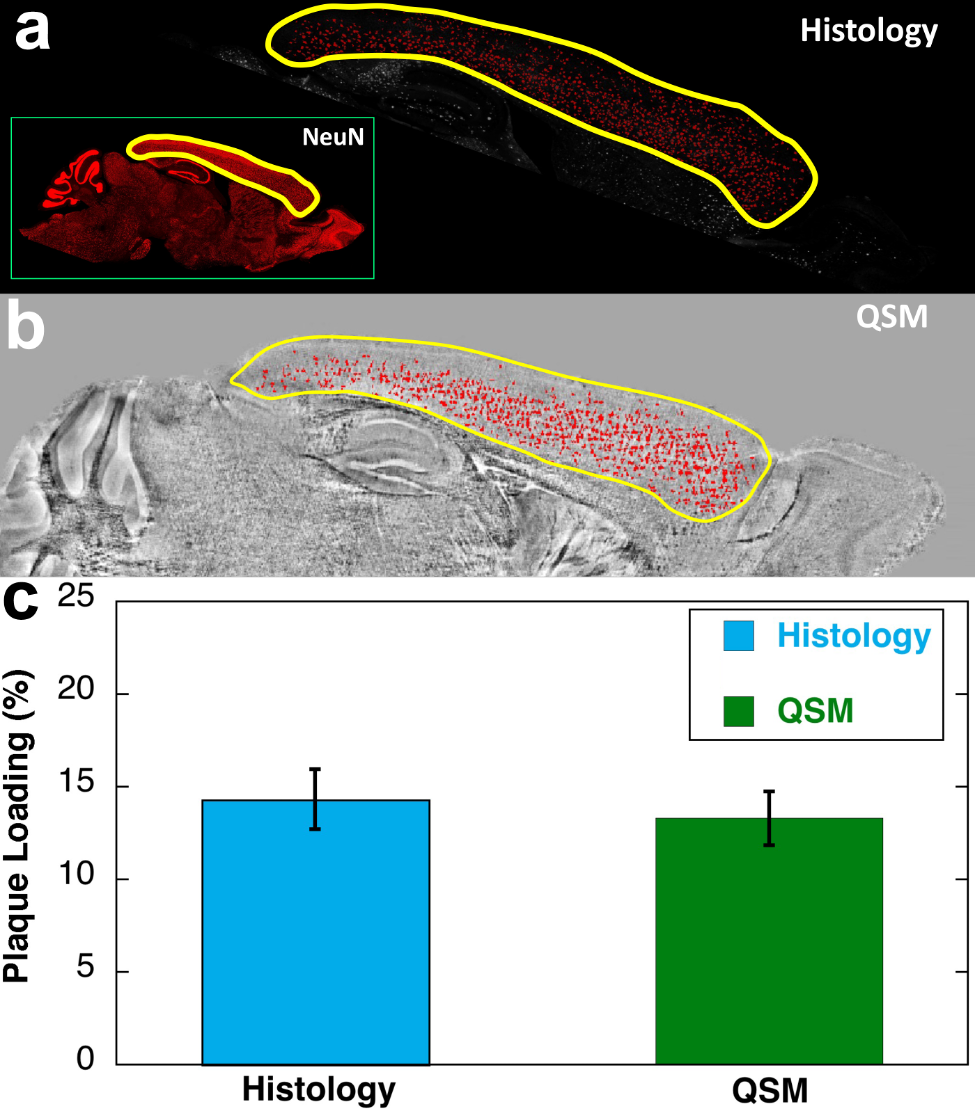
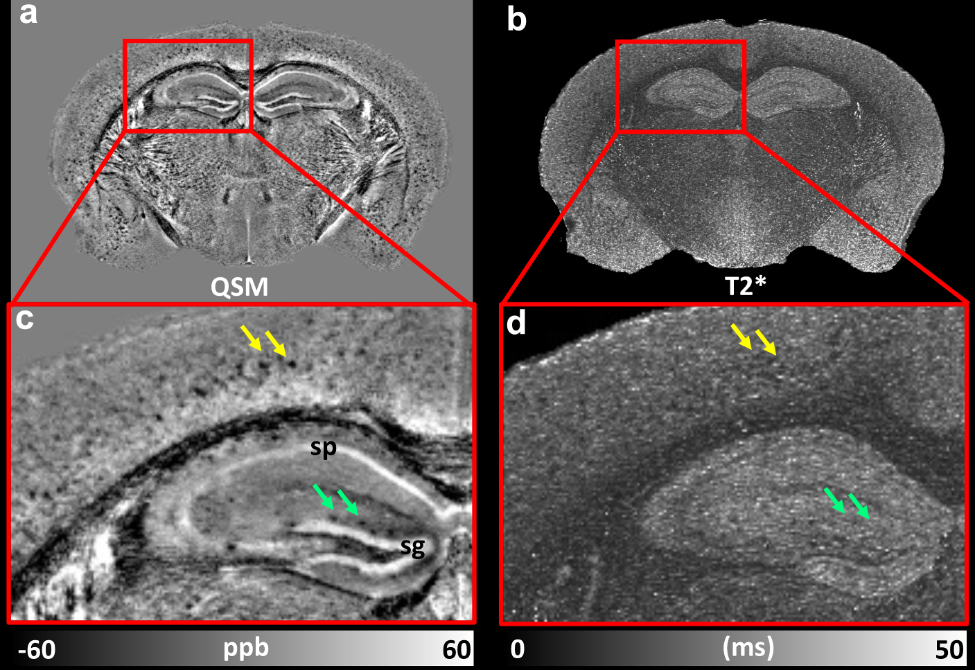
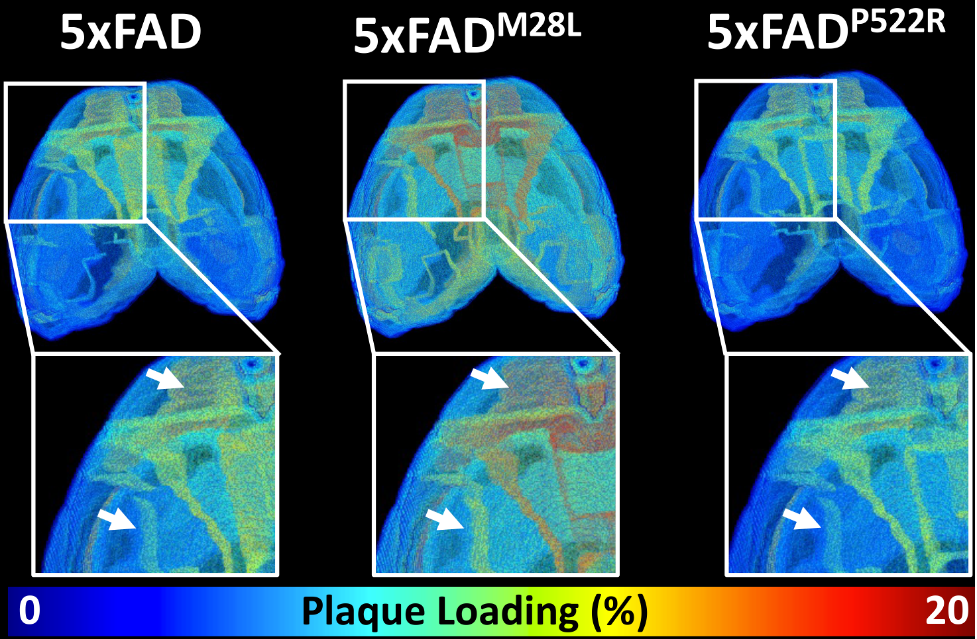
Figure 1 shows the representative T2*-weighted image of both WT (B6) and AD (5xFAD) mice. Compared to the B6, there are numerous hypointensity signals in the cortex region and hippocampus region (red and yellow arrows). These hypointensity areas are likely beta-amyloid plaque deposition. To validate the MRI findings, the QSM results were compared with beta-amyloid plaque staining (Figure 2). The plaques detected by QSM correlated well with the conventional histology in the cortex region. The plaque loading showed no significant difference between QSM and histology (p = 0.087). Figure 3 showed the beta-amyloid plaques detected by QSM and T2*. Compared to QSM, the plaques in the cortex and hippocampus (yellow and green arrows) are barely visible in the T2* map. Due to the long readout, we limited our MGRE scan with only 2 echoes in the current study. With the same limited number of echoes, QSM is better to detect the beta-amyloid plaques than T2*. To further explore the regional plaque deposition in the cortex region, we have divided the cortex area into 41 region-of-interests (ROIs). Figure 4 demonstrated the plaque loading in the whole cortex region of different mouse groups (5xFAD, 5xFADM28L, and 5xFADP522R). Compared to 5xFAD mice, the plaque loading is higher in the cortex region of 5xFADM28L (white arrows). The M28L is a risk variant of AD, which may increase the plaque loading. Compared to 5xFAD mice, the plaque loading is slightly lower in the cortex region of 5xFADP522R, probably because the P522R is a protective variant of AD.Discussion and Conclusion
Although the cause of AD is not fully understood, clinical and neuropathological studies have hypothesized that the formation of beta-amyloid (Aβ) plaques and tau neurofibrillary tangles are crucial to the pathogenesis of AD. It has been reported that Amyloid plaque is one of the earliest hallmarks of AD and can occur up to 20 years before clinical diagnosis. In this study, we demonstrated that high-resolution QSM can be used to detect individual beta-amyloid plaque through the whole mouse brain. We also showed that plaque loading is different in AD risk variant (M28L) mice and AD protective variant (P522R), which suggested that QSM may be a sensitive imaging-based biomarker to detect and monitor AD progression and understand the complicated mechanism of AD.Acknowledgements
This work was supported by NIH R01NS125020, Indiana Center for Diabetes and Metabolic Diseases Pilot and Feasibility Grant, and Roberts Drug Discovery Fund, Stark Neurosciences Research Institute, and the TREAT-AD Center. The authors thank the support from Dr. Yu-Chien Wu, Dr. Adrian Oblak, Dr. Gary Landreth, Dr. Andy Tsai, Peter Lin, Cynthia Ingraham, and Erin Jarvis.References
1. Hardy JA, Higgins GA. Alzheimer's disease: the amyloid cascade hypothesis. Science. 1992;256(5054):184-185.
2. Weimer DL, Sager MA. Early identification and treatment of Alzheimer's disease: social and fiscal outcomes. Alzheimers Dement. 2009;5(3):215-226.
3. Li W, Wang N, Yu F, et al. A method for estimating and removing streaking artifacts in quantitative susceptibility mapping. Neuroimage. 2015;108:111-122.
4. Gong NJ, Dibb R, Bulk M, van der Weerd L, Liu CL. Imaging beta amyloid aggregation and iron accumulation in Alzheimer's disease using quantitative susceptibility mapping MRI. Neuroimage. 2019;191:176-185.
5. Maharjan S, Tsai AP, Lin PB, et al. Age-dependent microstructure alterations in 5xFAD mice by high-resolution diffusion tensor imaging. Front Neurosci. 2022;16:964654.
6. Wang N, Zhuang J, Wei HJ, Dibb R, Qi Y, Liu CL. Probing demyelination and remyelination of the cuprizone mouse model using multimodality MRI. Journal of Magnetic Resonance Imaging. 2019;50(6):1852-1865.
Figures