3567
Magnetic Susceptibility Separation Reveals Longitudinal Lesion Changes in Multiple Sclerosis
Ziyan Zhu1, Javad Hamidi Esfahani1, Nashwan Naji1, Peter Seres1, Derek Emery2, Gregg Blevins3, Penelope Smyth3, and Alan Wilman1,2
1Department of Biomedical Engineering, University of Alberta, Edmonton, AB, Canada, 2Department of Radiology and Diagnostic Imaging, University of Alberta, Edmonton, AB, Canada, 3Division of Neurology, Department of Medicine, University of Alberta, Edmonton, AB, Canada
1Department of Biomedical Engineering, University of Alberta, Edmonton, AB, Canada, 2Department of Radiology and Diagnostic Imaging, University of Alberta, Edmonton, AB, Canada, 3Division of Neurology, Department of Medicine, University of Alberta, Edmonton, AB, Canada
Synopsis
Keywords: Multiple Sclerosis, Multiple Sclerosis, Iron Change, Myelin Change
Susceptibility separation may distinguish iron and myelin in multiple sclerosis (MS) lesions, but little work has been done on longitudinal changes. Twenty MS subjects were followed for 14 months to investigate para and diamagnetic changes independently using susceptibility separation in comparison to transverse relaxation and susceptibility mapping. Susceptibility separation provided distinction between myelin and iron events, offering more insight into MS lesion evolution.Introduction
QSM can characterize the net distribution of magnetic susceptibility within each voxel and has been used in multiple sclerosis (MS) brain 1,2. However, sub-voxel paramagnetic and diamagnetic sources may both contribute to important processes within a voxel, including paramagnetic iron accumulation or loss and diamagnetic myelin alterations via demyelination or remyelination 3,4. Therefore, the net magnetic susceptibility summation in traditional QSM may not be capable of interpreting combined iron and myelin variations. However, susceptibility separation (χ separation) based on QSM and the reversible transverse relaxation rate R2’ provides an avenue to disentangle co-existing para and diamagnetic contents within a voxel and hence may offer more insightful interpretation of lesion evolution in MS 5-7. Here we examined χ separation for measuring longitudinal changes in MS lesions over 14 months.Methods
Subjects: Twenty subjects with relapsing-remitting MS (mean age [SD] 40.9 [9.8] yrs, 14 females) underwent two successive MRI scans with 14.4 [2.0] months interval. Changes in the para and diamagnetic components of lesions over time were quantified and compared to R2* and QSM changes.Data Acquisition: 3D Multi-echo gradient echo (MEGE): TR =47ms, TE1 =5.0ms with echo spacing 7.1ms, 6 echoes, flip angle 18°, FoV 240×187×144 mm3, spatial resolution 0.6×0.6×1.0mm3; 2D Dual echo Turbo spin echo (TSE): TR 2500ms, TE1 10ms, TE2 93ms, turbo factor 8, FoV 240×180×150mm3, spatial resolution 0.9×0.9×3.0mm3; 3D MPRAGE: TR 1700ms, TE 2.21ms, TI 880ms, flip angle 10°, FoV 256×232×176mm3, spatial resolution 1.0×1.0×1.0mm3; 3D FLAIR: TI 1800ms, TR 5000ms, TE 174ms, FoV 256×232×176mm3, spatial resolution 1.0×1.0×1.0mm3; A B1+ map was also acquired using a turbo-flash based Bloch-Siegert B1+ mapping sequence.
Image Processing: QSM reconstruction used: PRELUDE for phase unwrapping 8, VSHARP for background field removal 9, and the MEDI for dipole field inversion and image space regularization 10. An R2* map was derived using mono-exponential fitting of the magnitude MEGE sequence 11. A R2 map was generated by modeling the exact dual echo TSE pulse sequence using Bloch equations and the applied flip angles determined from the nominal flip angles and the B1+ map and then performing dictionary fitting 12. An R2’ map was obtained by subtracting R2 from R2*. Using the QSM and R2’ results, χ separation was performed using the method of Shin et al 5, producing diamagnetic and paramagnetic susceptibility maps.
Lesion Analysis: Serial images of each individual were registered to MPRAGE space using FSL FLIRT 13. Only lesions identified as hyperintensities on FLAIR, located within white matter and greater than 3mm in diameter were included. Manual volume segmentation using ITK-SNAP was used to identify each lesion boundary 14,15. Mean values of each quantitative lesion measure were recorded for each dataset in the longitudinal study.
Results
183 lesions were identified. Figure 1 illustrates conventional weighted MRI and the qMRI images used to generate the magnetic susceptibility separation maps. The para and diamagnetic maps illustrate iron and myelin distribution in the lesion. Based on the longitudinal changes of the positive and negative magnetic susceptibility components, each quantitative MRI index change was then divided into four groups, shown in Figure 2. Fifty-four of 183 (29.5%) lesions had both increased positive and negative components; 33 of 183 (18%) lesions had increased positive and reduced negative components; 31 of 183 (17%) lesions had reduced positive and increased negative components; 65 of 183 (35.5%) lesions had both reduced positive and negative components. For some sets of data, only subtle longitudinal change of the mean value could be found, however in Figure 2 b, c, e and h had relatively uniform direction of change between subjects. In Figure 3, Spearman correlation coefficients between qMRI indices and susceptibility separation are shown at (a) baseline and (b) for the 14-month interval. In the baseline results, there was moderate correlation between χ separation results and T2* and QSM. As for longitudinal changes, there was strong correlation between χ separation and T2*, with weaker correlations with QSM.Discussion
MS lesion evolution is heterogeneous, thus analysis providing both positive and negative components is needed. From the longitudinal changes in Figure 2, it is clear that T2* shows greater change than QSM when both para and diamagnetic components change in the same direction, while QSM shows greater change when the para and diamagnetic components oppose each other. This follows since simultaneous increase or decrease of both iron and myelin combines on T2*, while having a canceling effect on QSM. Susceptibility separation is still in its early stages with improved methods needed to better model white matter anisotropy, however results are promising.Conclusion
Variable changes over 14 months in iron and myelin in MS lesions were observed using susceptibility separation. This technique may add value in understanding lesion evolution when concurrent iron gain/loss and demyelination/remyelination events are occurring in the same voxel.Acknowledgements
No acknowledgement found.References
- Langkammer C, Liu T, Khalil M, Enzinger C, Jehna M, Fuchs S, Fazekas F, WangY, Ropele S. Quantitative susceptibility mapping in multiple sclerosis. Radiology. 2013;267(2):551-559.
- Rahmanzadeh R, Galbusera R, Lu PJ, et al. A new advanced MRI biomarker for remyelinated lesions in multiple sclerosis. Ann Neurol. 2022;92(3):486-502.
- Möller HE, Bossoni L, Connor JR, et al. Iron, myelin, and the brain: neuroimaging meets neurobiology. Trends Neurosci. 2019;42(6):384-401.
- Reichenbach JR, Schweser F, Serres B, Deistung A. Quantitative susceptibility mapping: concepts and applications. Clin Neuroradiol. 2015;25(2):225-230.
- Shin HG, Lee J, Yun YH, et al. χ-separation: magnetic susceptibility source separation toward iron and myelin mapping in the brain. Neuroimage. 2021;240:118371.
- Emmerich J, Bachert P, Ladd ME, Straub S. On the separation of susceptibility source in quantitative susceptibility mapping: theory and phantom validation with an in vivo application to multiple sclerosis lesions of different age. JMagn Reson. 2021;330:107033.
- Dimov AV, Nguyen TD, Gillen KM, et al. Susceptibility source separation from gradient echo data using magnitude decay modeling. J Neuroimaging. 2022;1-8.
- Jenkinson M. Fast, automated, N-dimensional phase-unwrapping algorithm. Magn Reson Med. 2003;49(1):193–197.
- Li W, Wu B, Liu C. Quantitative susceptibility
mapping of human brain reflects spatial variation in tissue composition.
Neuroimage. 2011;55(4):1645–1656.
- Liu J, Liu T, Rochefort L, et al. Morphology enabled dipole inversion for quantitative susceptibility mapping using structural consistency between the magnitude image and the susceptibility map. Neuroimage. 2012;59(3):2560-2568.
- Pei M, Nguyen TD, Thimmappa ND, et al. Algorithm for fast monoexponential fitting based on auto-regression on linear operations (ARLO) of data. Magn Reson Med. 2015;73(2):843-850.
- McPhee KC, Wilman AH. T2 quantification from only proton density and T2-weighted MRI by modelling actual refocusing angles. Neuroimage. 2015;118:642-650.
- Jenkinson M, Smith S. A global optimisation method for robust affine registration of brain images. Med Image Anal. 2001;5(2):143-156.
- Filippi M, Preziosa P, Banwell BL, et al. Assessment of lesions on magnetic resonance imaging in multiple sclerosis: practical guidelines. Brain. 2019;142(7):1858-1875.
- Yushkevich PA, Piven J, Hazlett HC, et al. User-guided 3D active contour segmentation of anatomical structures: significantly improved efficiency and reliability. Neuroimage. 2006;31(3):1116-1128.
Figures
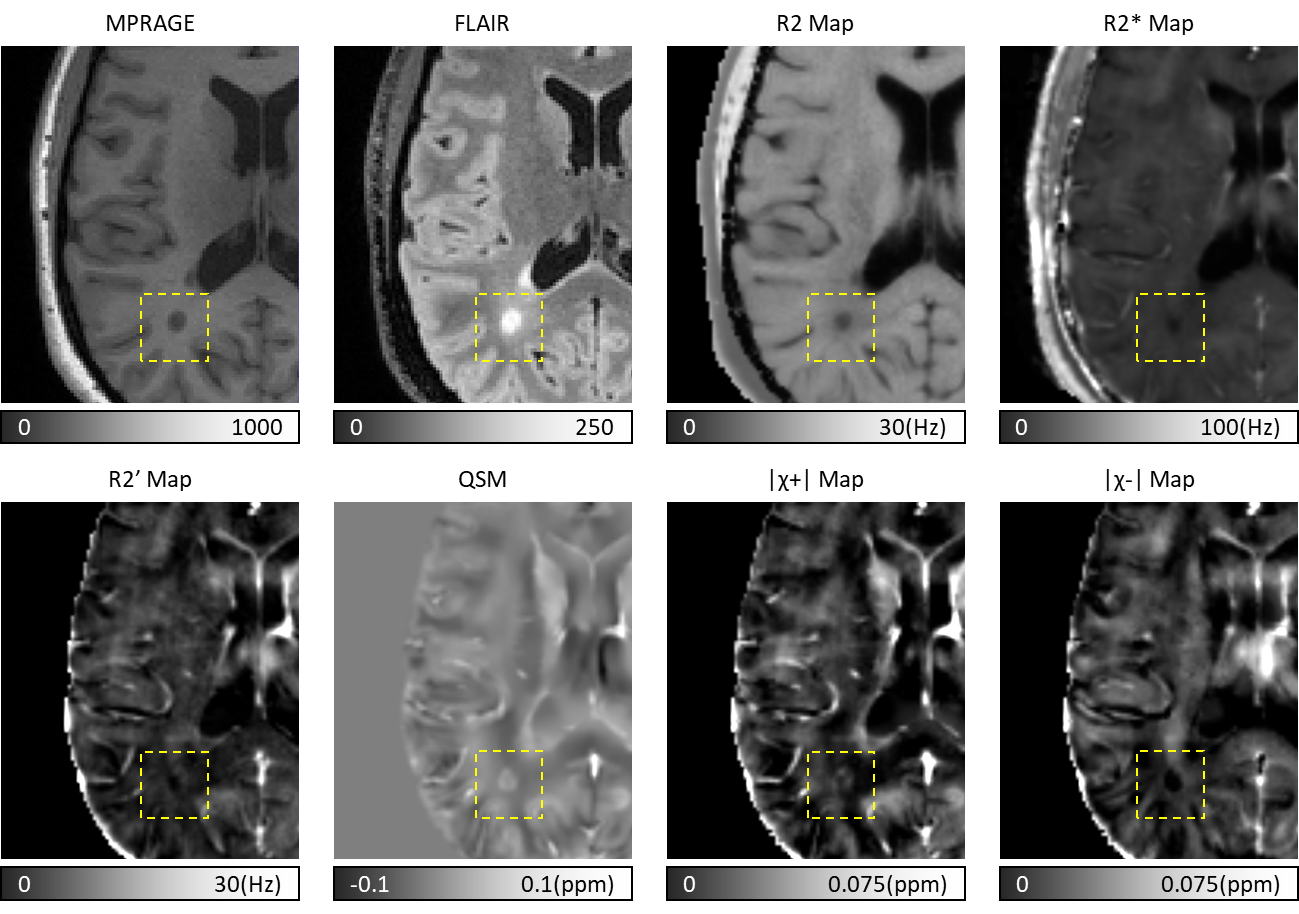
Figure 1: Brain images of a 40 yr old female RRMS subject using qMRI and susceptibility separation. A white matter lesion was shown in the dashed boxes. Black hole and hyperintense region were shown on MPRAGE and FLAIR. On R2, R2* and R2’ maps, dark regions appeared at the same location, indicating reduced relaxation rates. On QSM, lesion area was bright suggesting increased net magnetic susceptibility. On χ separation maps, for positive component a bright rim appeared at the lesion boundary which may due to iron gain, and for negative component a dark area may due to diamagnetic myelin loss.
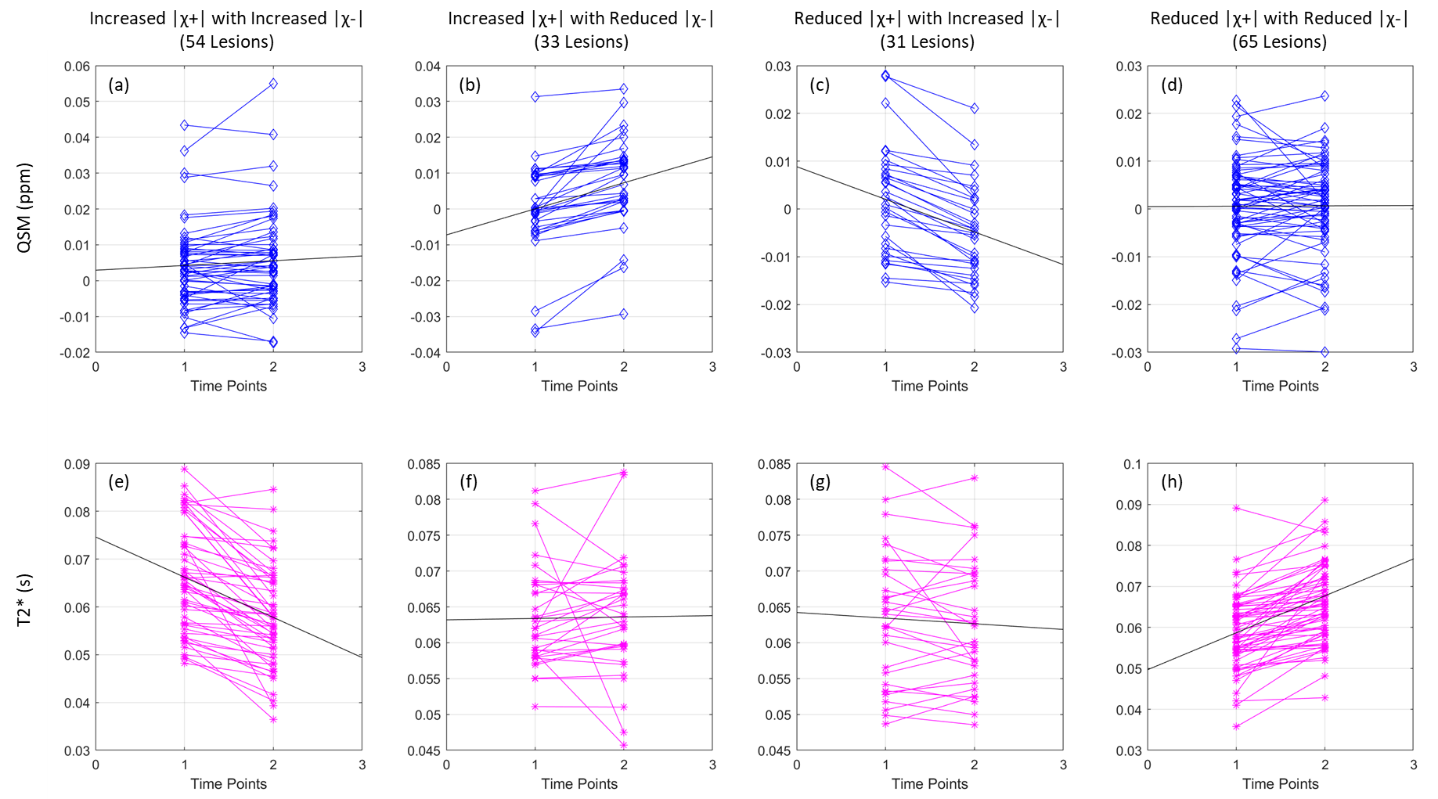
Figure 2: Longitudinal changes of QSM and T2* grouped based on susceptibility separation change. First column: 54 lesions had increased |χ+| and increased |χ-|; Second column: 33 lesions had Increased |χ+| and reduced |χ-|; Third column: 31 lesions had reduced |χ+| and increased |χ-|; Forth column: 65 lesions had reduced |χ+| and reduced |χ-|.
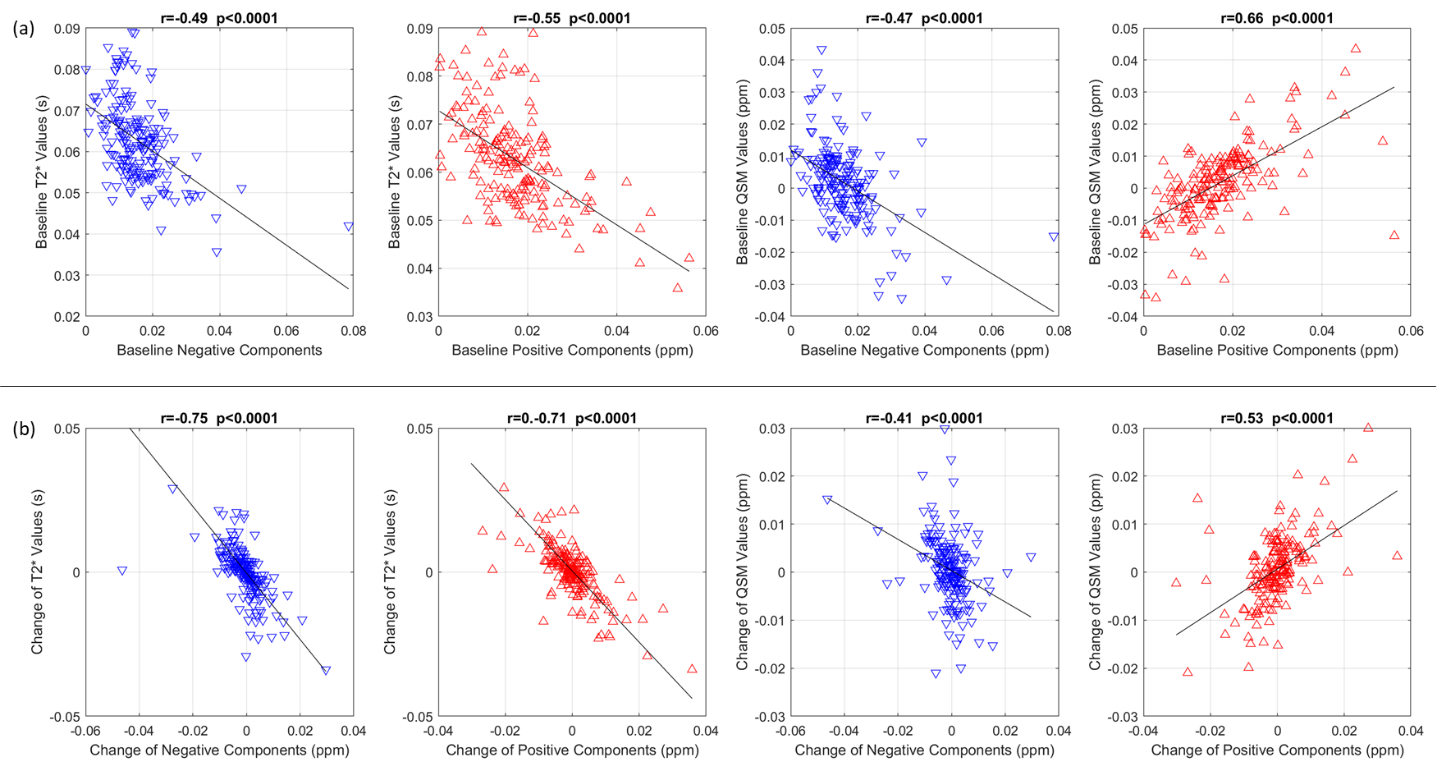
Figure 3. Spearman correlation between T2* or QSM and the susceptibility separation components in MS lesions. (a) Baseline. (b) Longitudinal change over 14 months.
DOI: https://doi.org/10.58530/2023/3567