3563
Disrupted Functional Connectivity of the Visual Cortex in Dysthyroid Optic Neuropathy Due to Thyroid-Associated Ophthalmopathy1Medical Imaging, Guangdong Second Pronvincal General Hospital, Guang Zhou, China, 2Jinan university, Guang Zhou, China
Synopsis
Keywords: Head & Neck/ENT, Neuro, dysthyroid optic neuropathy,thyroid-associated ophthalmopathy
Dysthyroid optic neuropathy (DON) due to thyroid-associated ophthalmopathy (TAO) is characterized by visual dysfunction and with a risk of blindness. Visual cortex is crucial for visual information, and visual impairments can affect brain activity. We investigated visual cortex functional connectivity (FC) alterations in DON and its associations with visual performance. The DON showed disrupted FC in the visual cortex, and the FC in primary rather than the secondary visual cortex associated with clinical parameters. It helps to uncover the neurological mechanisms underlying visual dysfunction and provides insight into novel therapeutic regimens to slow or prevent the neuropathy.Introduction
Severe visual dysfunction including decreased visual acuity (VA), visual field (VF) defects, and dyschromatopsia is the major feature of thyroid-associated ophthalmopathy (TAO) with dysthyroid optic neuropathy (DON)1. Elucidation of the underlying pathophysiology of visual dysfunction is crucial for understanding DON for its potential risk of irreversible blindness2. Visual impairment or ocular diseases can affect functional brain activity3, visual dysfunction cannot be detected exclusively by the ocular or brain for ocular disease4. An autopsy5 showed nerve atrophy and loss of large-type axons in the optic nerve in DON, which may theoretically result in alterations in brain activity. Consequently, evaluation of the visual cortex may offer insight into the mechanisms of vision impairment by DON and provide potential treatment implications, such as stimulating the brain to restore vision6. There are growing attention to the potential value of fMRI for TAO with and without DON7,8, but pertinent concerns about vision - related neural activity are rare. Functional connectivity (FC) algorithm can measure the spatial temporal correlations and synchrony of the neural activity signals among anatomically different regions. Thus, we investigated visual cortex FC alterations in patients with DON, using resting-state functional MRI (fMRI), and to explore relationships between these alterations and visual disorders.Methods:
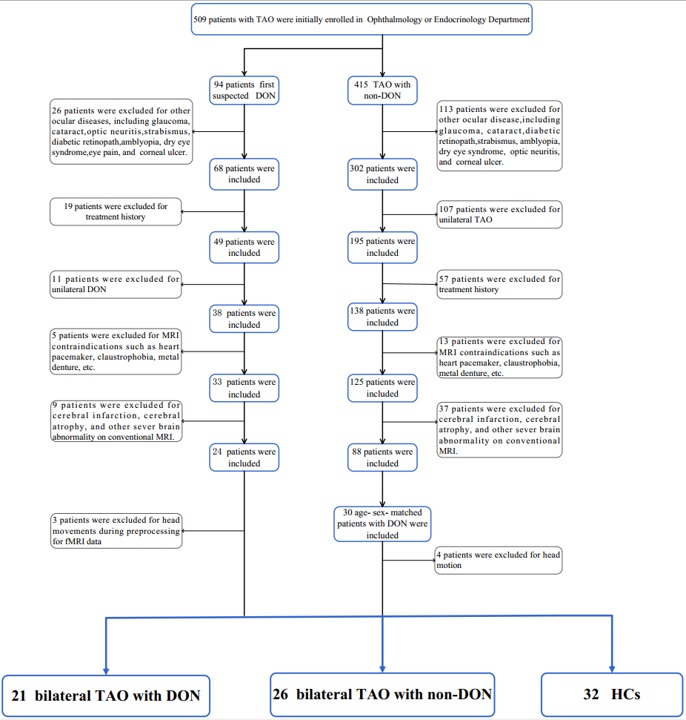
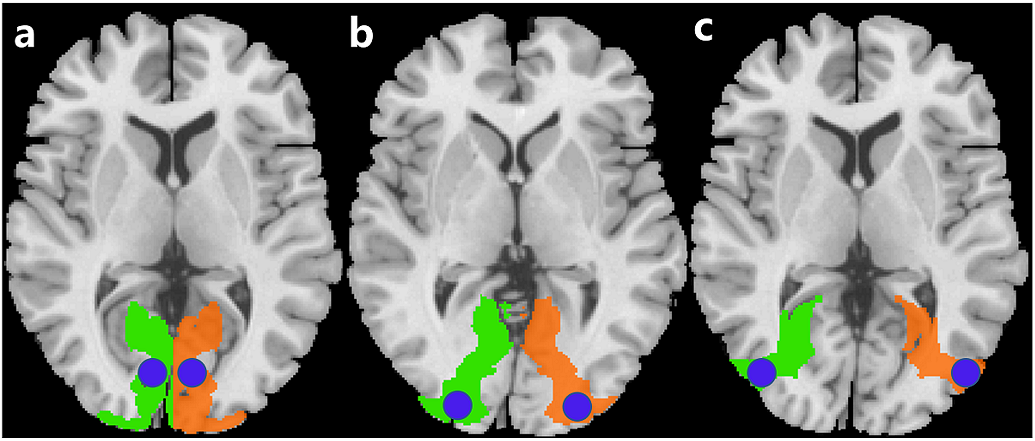
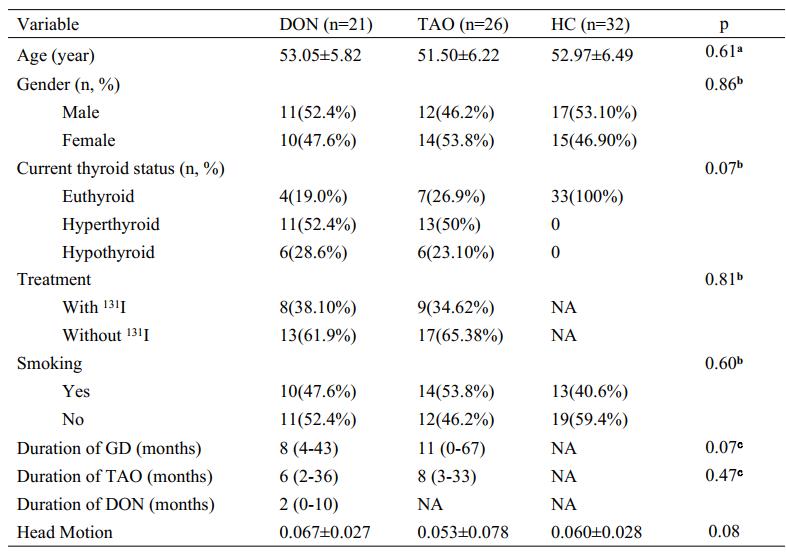
fMRI data were collected from 47 patients with TAO (21 DON, 26 non-DON and 32 healthy controls (HCs). Relevant clinical variables were collected, including age, sex, duration of Graves’ disease, TAO, and/or DON, history of 131I treatment, and smoking status. Serum levels of free triiodothyronine, free thyroxine, thyroid-stimulating hormone, and thyrotropin receptor antibodies were tested. All patients underwent Conventional ophthalmological examination including fundoscopy, pupillary defect evaluation, VA assessment, intraocular pressure measurement, exophthalmometry, and color vision evaluation. Clinical activity scores were determined, visual function examinations including VF and visual evoked potential (VEP) tests were performed.A voxel-wise FC analysis was performed : Regions-of-interest (ROIs)of the visual cortex included the primary (Brodmann area [BA] 17) and secondary visual cortex (BA18), and (BA 19). The FC between the ROI and the remaining brain was calculated using Pearson’s correlation coefficient. FC maps demonstrating FC of BA17/18/19 with other brain regions were constructed.
Visual cortex (Brodmann areas [BA] 17/18/19) FC was compared among the groups using analysis of variance with post-hoc pairwise comparisons (voxel-level p < 0.01, Gaussian random-field correction, cluster-level p < 0.05). Relationships between FC and DON clinical features were evaluated.
Results:
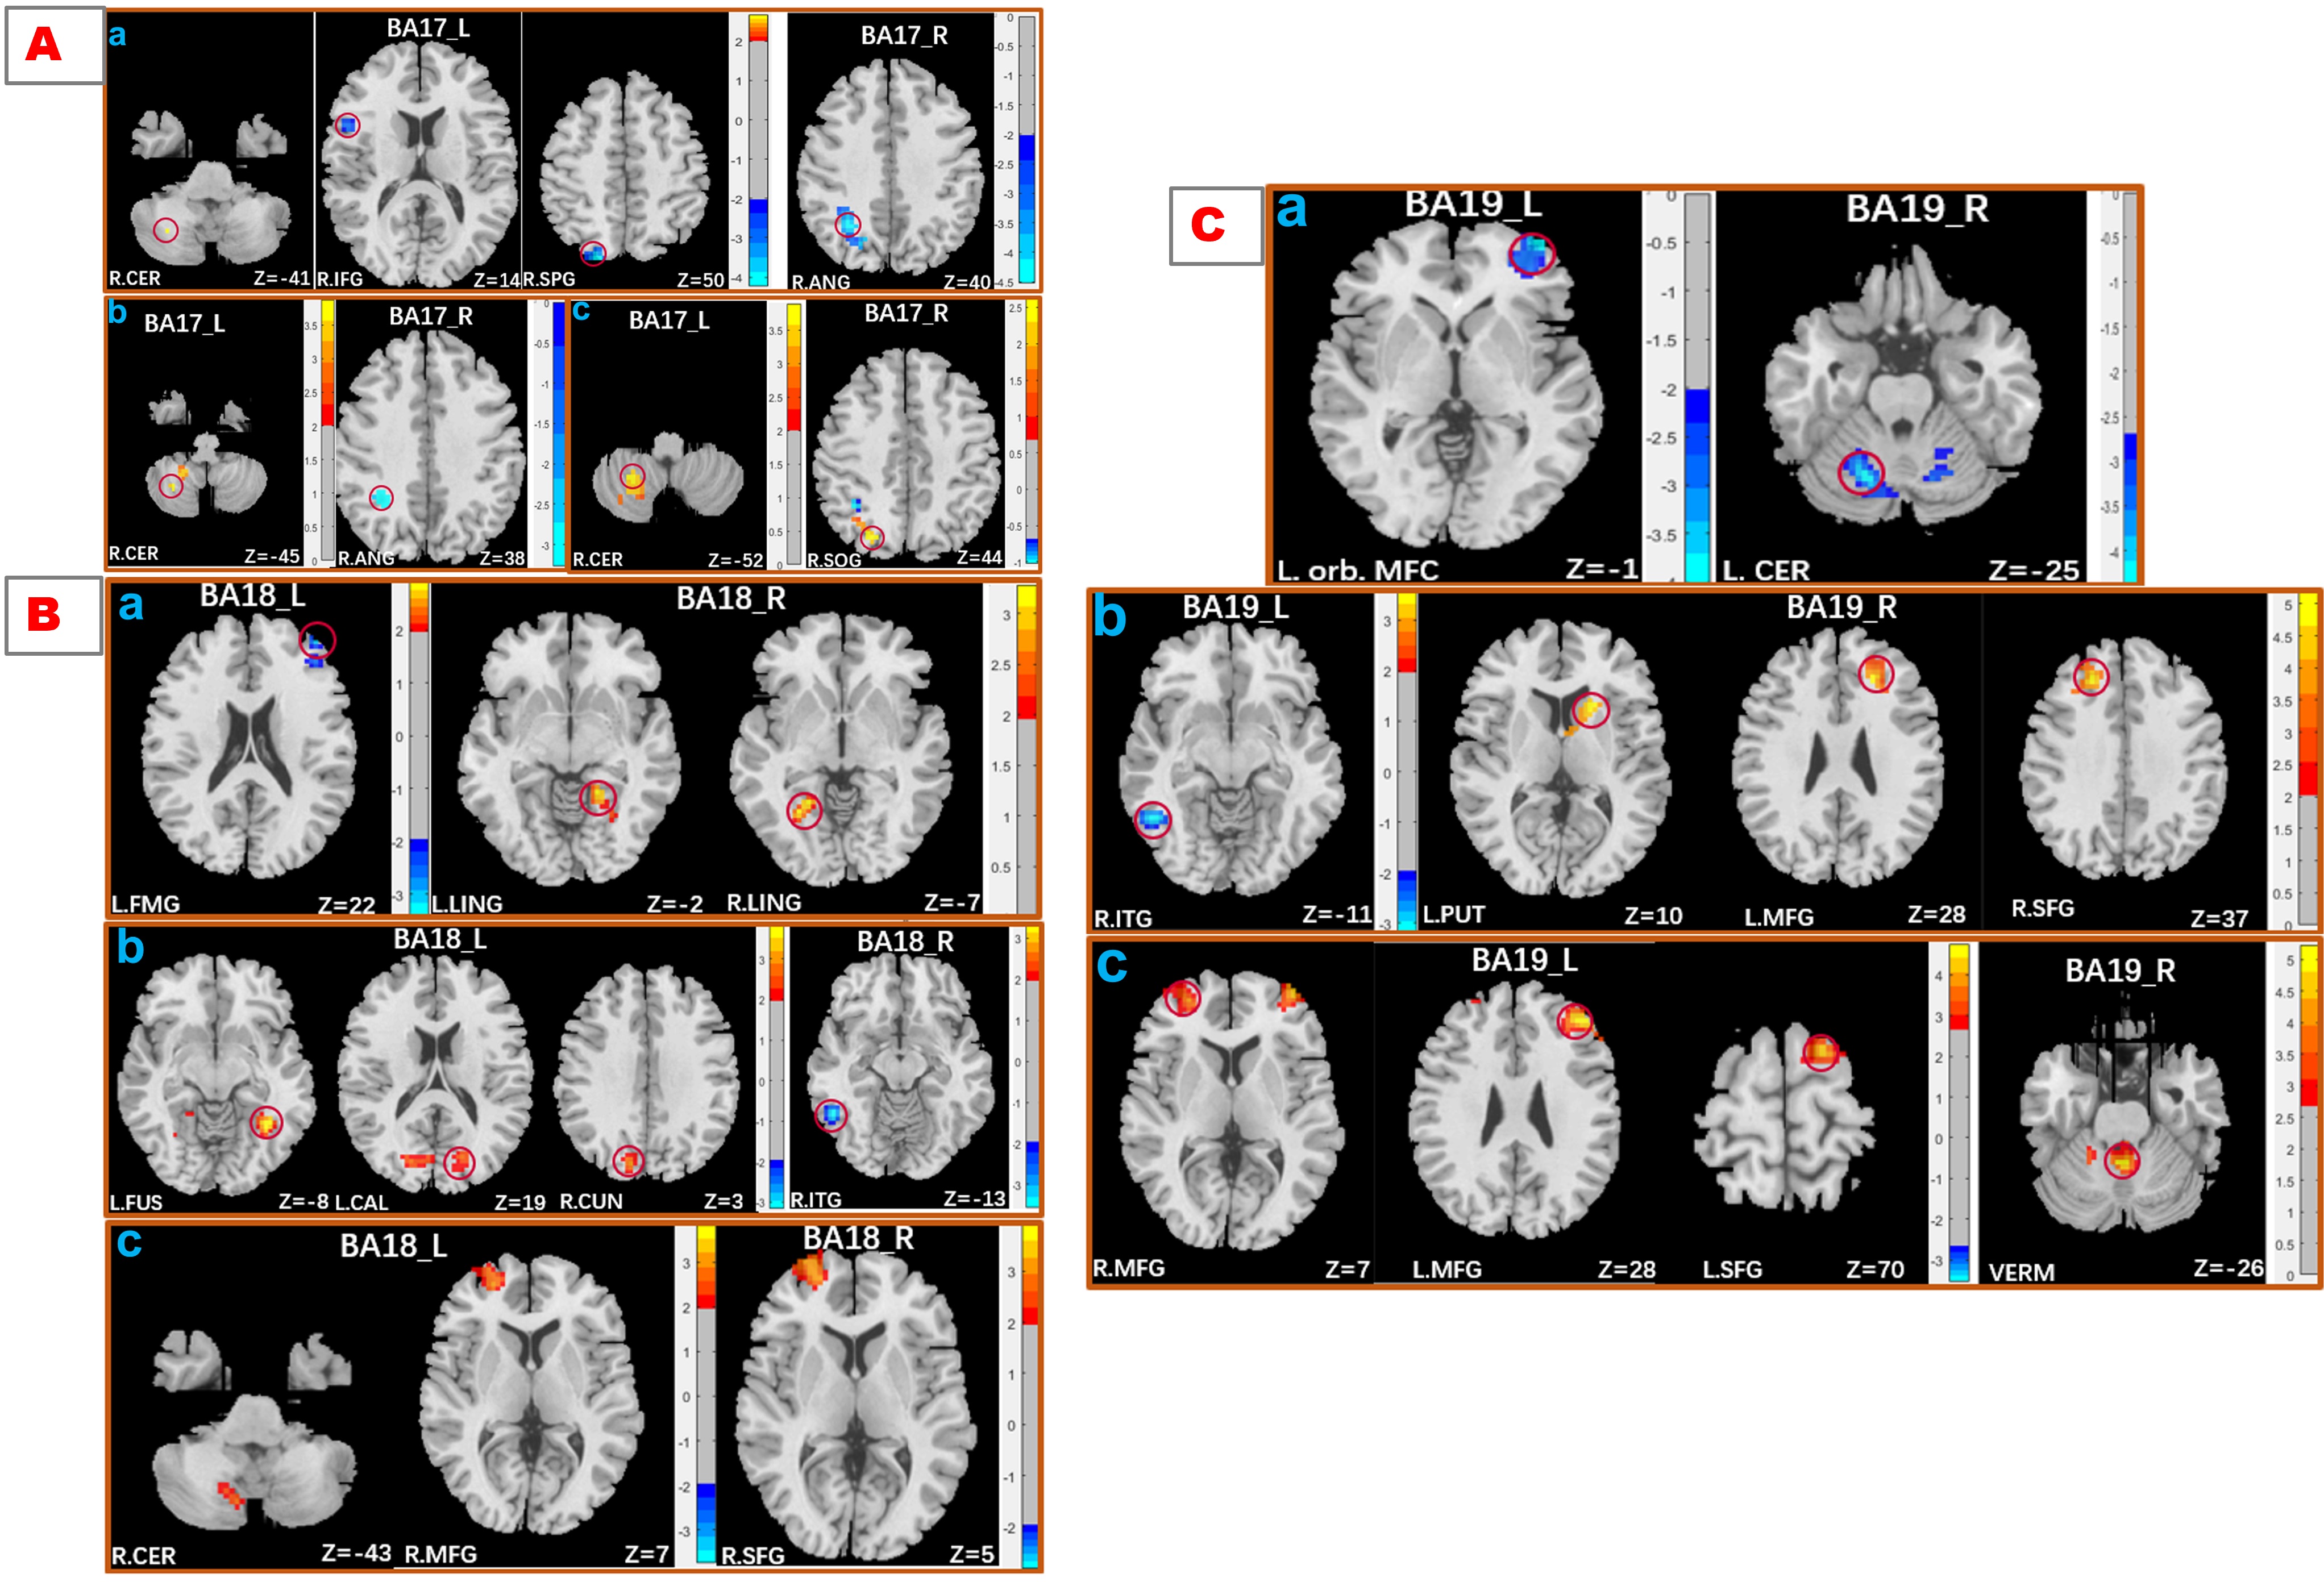
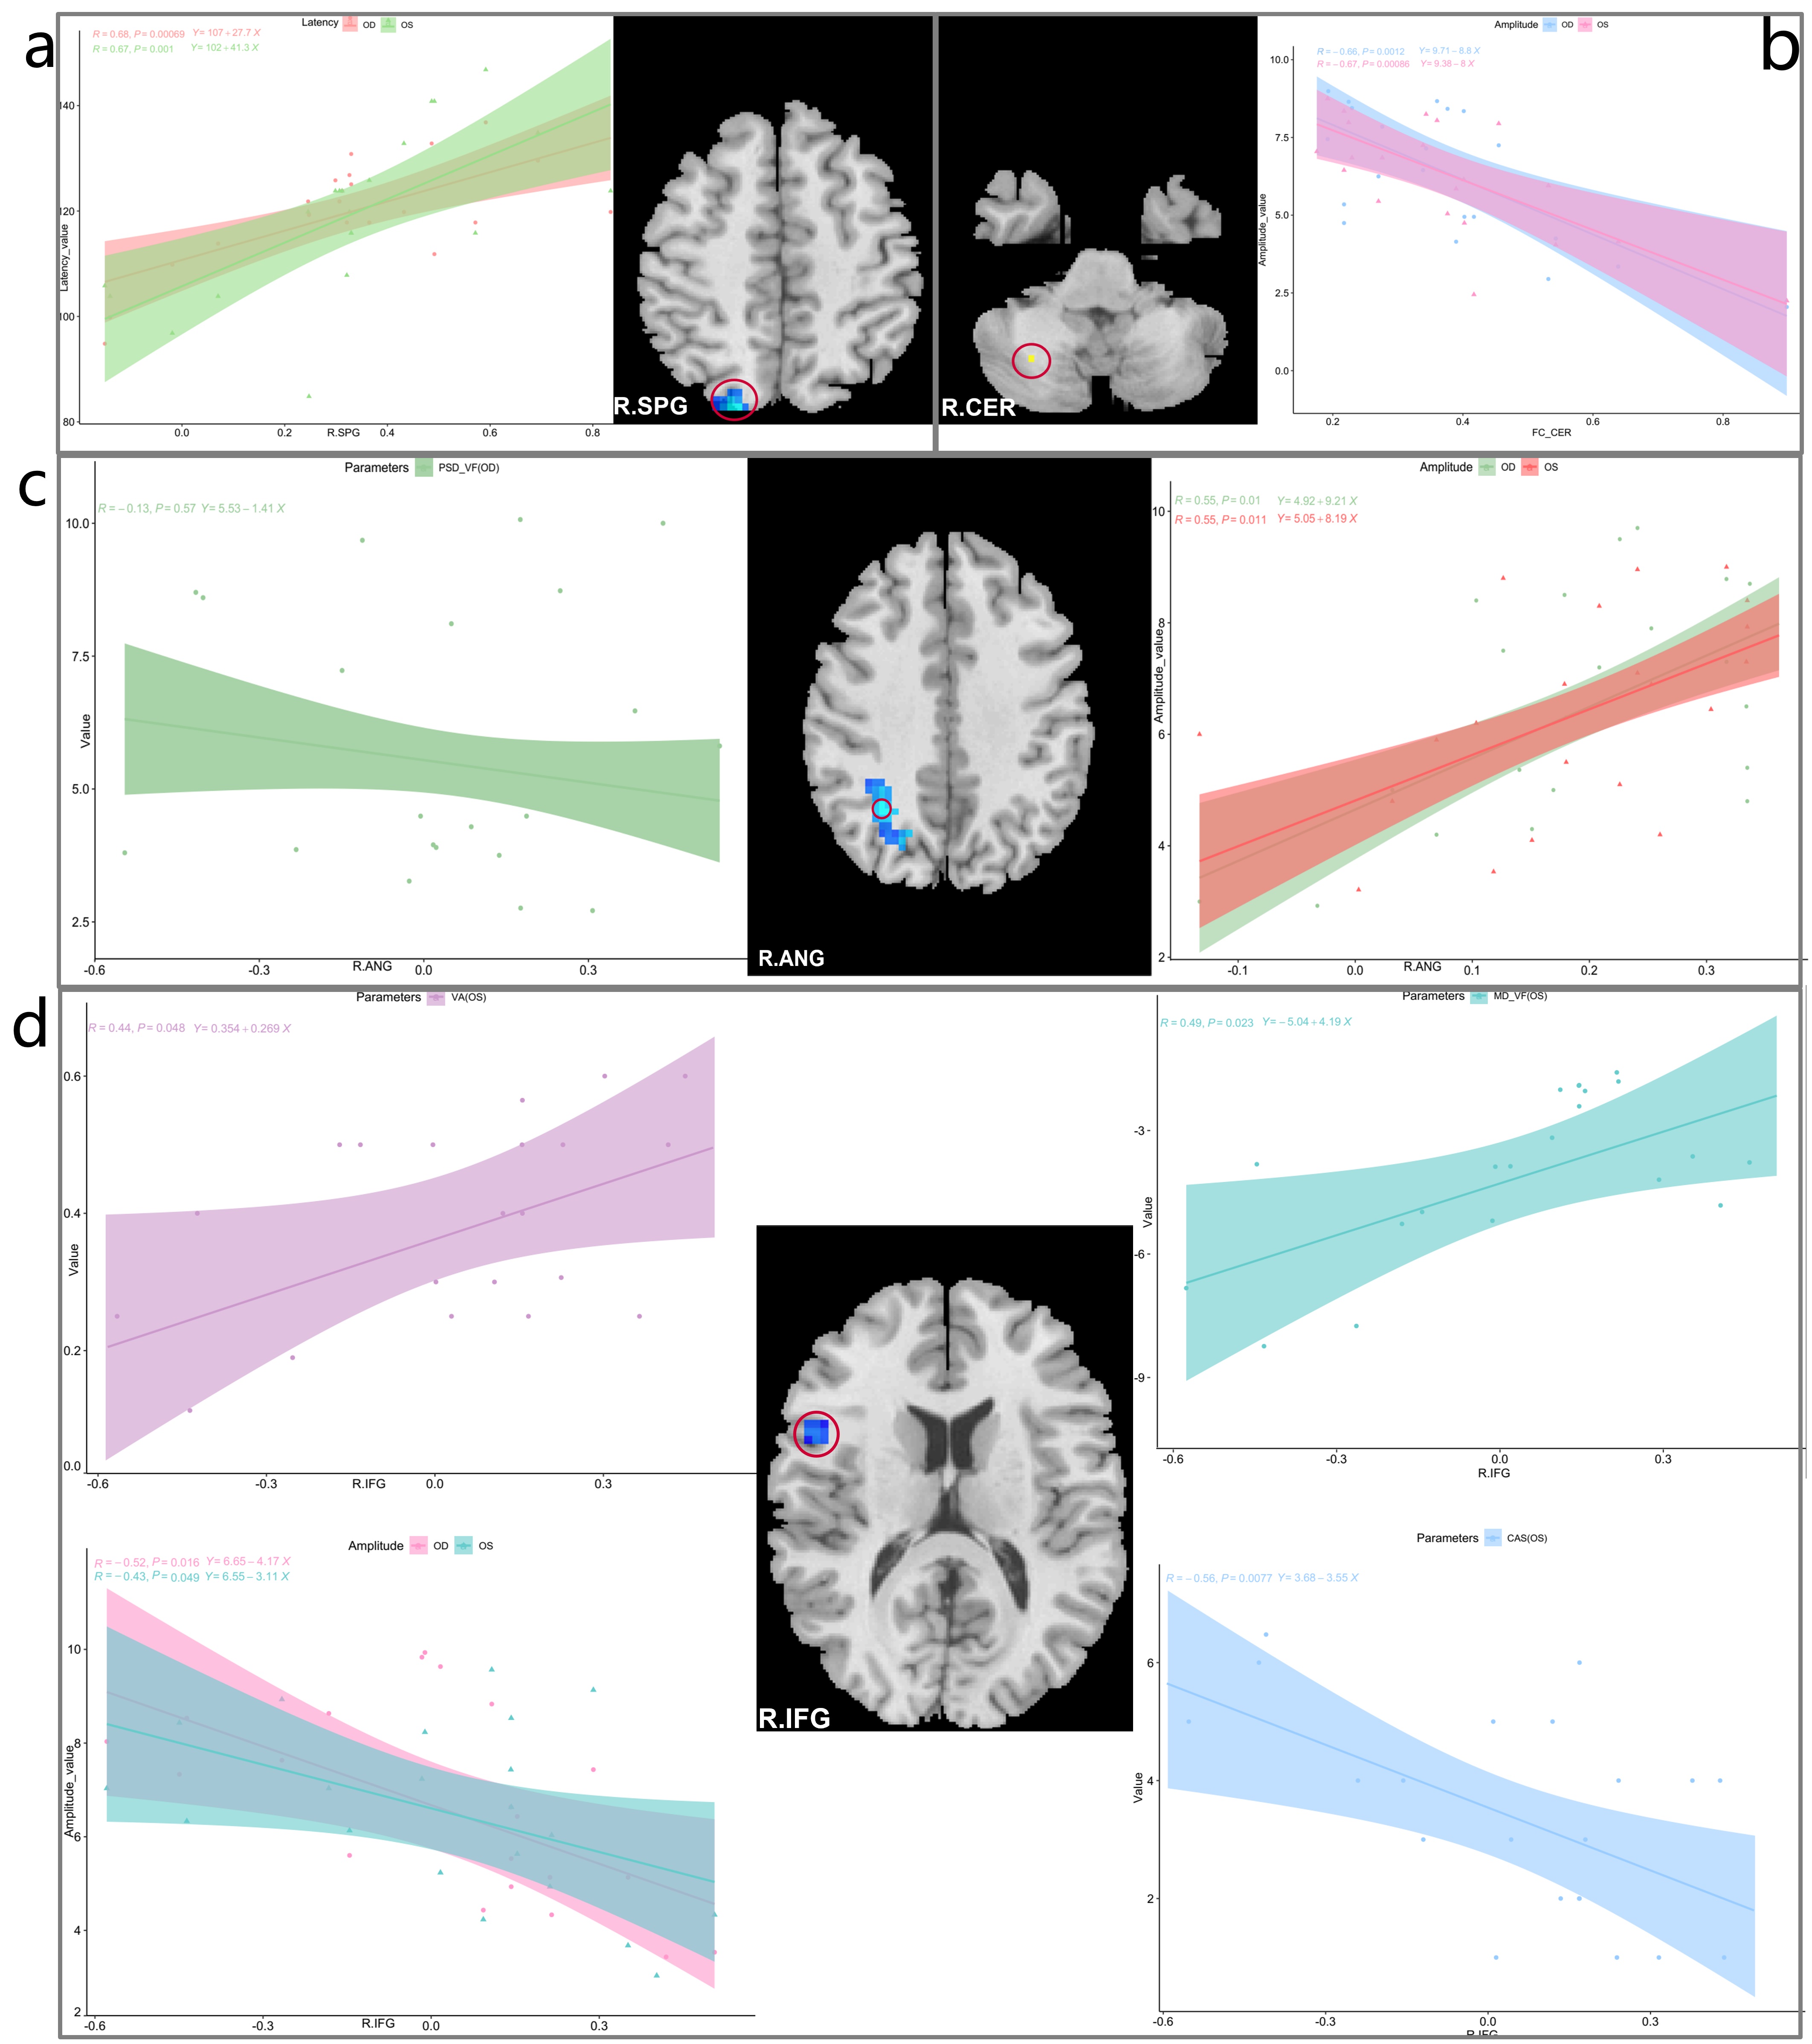
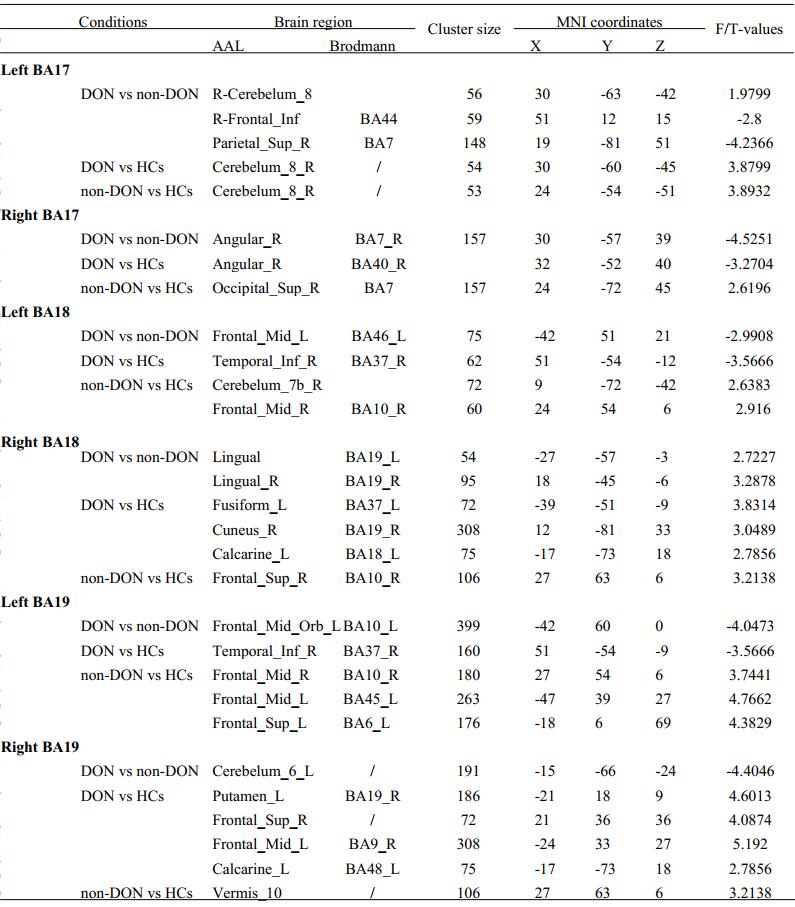
DON patients showed decreased FC strength between the left primary visual cortex (BA17) and the right superior parietal gyrus/right opercular inferior frontal gyrus, and between the right angular and right BA17, and showed increased FC strength between the right cerebellum and left BA17. DON patients also displayed decreased FC intensity between the left middle frontal gyrus and left BA18, the left orbital middle frontal gyrus and left BA19, and the left cerebellum and right BA19, as well as increased FC intensity between the bilateral lingual gyrus and right BA18. In DON patients, FC correlated with visual performance.Discussion:
Interrelationship between eye and brain has been partially confirmed. The visual cortex is primarily responsible for visual information processing. We investigated the FC differences of both the primary and secondary visual cortices with the whole brain between patients with TAO with and without optic neuropathy. The results showed that :1) FC of both visual cortexes with other brain areas was altered in patients with as compared to those without this neuropathy; 2) the related brain areas with the visual cortex involved the cerebellum and the deep gray matter nuclei; 3) Altered FC in the primary, rather than in the secondary, visual cortex correlated with visual performance. The primary visual area, BA17, receives direct visual stimulation, and integrates and converges binocular visual information, leading to vision. Weaker ANG-BA17 FC may be related to diplopia, a common TAO symptom. The stronger BA17-CER FC may be a compensatory reaction to ocular abnormalities, such as eye movement limitation in TAO, and that reduced visual input may enhance visual modulation by the CER by enhancing connectivity with BA17. BA18/19 form part of the higher visual cortex and integrate visual information. Enhanced BA18/LING FC may be related to a self-compensatory or self-protection response to damaged visual function. Decreased left MFG - BA18 FC indicates damaged visuospatial memory in DON. The altered FC of the vermis and CER with the higher visual cortex may result from reduced input from the hypoactive primary/higher visual area and compensatory recruitment. VEPs measure the absolute value of cortical potentials evoked by patterned stimuli,9 equal to task-based fMRI. Therefore, the close association between changed FC and VEP indexes is reasonable from a neural mechanistic perspective. FC intensities were not correlated with the thickness of retinal nerve fiber layer, suggesting that functional changes appear before organic changes. Therefore, FC might be a complementary index for diagnosing and monitoring disease.Conclusion
DON patients showed disrupted FC in both primary and secondary visual cortex, changed FC in primary but secondary visual cortex were associated with visual performance. These findings advance the understanding of visual dysfunction in DON, which may provide insight into novel therapeutic regimens to slow or prevent the progression of neuropathy, and help improve to the visual dysfunction of DON.Acknowledgements
This work was supported by grants from the National Natural Science Foundation of China (No.82102004), 3D Printing Scientific Research Project Foundation of Guangdong Second Provincial General Hospital (3D-A2021013), Medical Science and Technology Research Foundation of Guangdong Province (A2021220).References
1. Dolman PJ. Dysthyroid optic neuropathy: evaluation and management. J Endocrinol Invest. Mar 2021;44(3):421-429. doi:10.1007/s40618-020-01361-y
2. Agarwal A, Khanam S. Dysthyroid Optic Neuropathy. StatPearls. StatPearls Publishing Copyright © 2022, StatPearls Publishing LLC.; 2022.
3. Nuzzi R, Dallorto L, Rolle T. Changes of Visual Pathway and Brain Connectivity in Glaucoma: A Systematic Review. Front Neurosci. 2018;12:363. doi:10.3389/fnins.2018.00363
4. Sims JR, Chen AM, Sun Z, et al. Role of Structural, Metabolic, and Functional MRI in Monitoring Visual System Impairment and Recovery. J Magn Reson Imaging. Dec 2021;54(6):1706-1729. doi:10.1002/jmri.27367
5. Hufnagel TJ, Hickey WF, Cobbs WH, Jakobiec FA, Iwamoto T, Eagle RC. Immunohistochemical and Ultrastructural Studies on the Exenterated Orbital Tissues of a Patient with Graves' Disease. Ophthalmology. 1984;91(11):1411-1419. doi:10.1016/s0161-6420(84)34152-5
6. Beauchamp MS, Yoshor D. Stimulating the brain to restore vision. Science. Dec 4 2020;370(6521):1168-1169. doi:10.1126/science.abf3684
7. Jiang YP, Yang YC, Tang LY, et al. Altered spontaneous brain activity patterns in dysthyroid optic neuropathy: a resting-state fMRI study. J Integr Neurosci. Jun 30 2021;20(2):375-383. doi:10.31083/j.jin2002037
8. Qi CX, Wen Z, Huang X. Spontaneous brain activity alterations in thyroid-associated ophthalmopathy patients using amplitude of low-frequency fluctuation: A resting-state fMRI study. Neuroreport. Dec 15 2021;32(18):1416-1422. doi:10.1097/wnr.0000000000001745
9. Qi X, Tong B, Hu W, Luo B. Comparing isolated-check visual evoked potential, pattern visual evoked potential, and standard automated perimetry in dysthyroid optic neuropathy eyes. Eye (London, England). Sep 2021;35(9):2556-2563. doi:10.1038/s41433-020-01274-3
Figures