3561
Brain structures of a human embryo depicted by MR microscopy with different contrasts1Graduate School of Science and Technology, University of Tsukuba, Tsukuba, Japan, 2Congenital Anomaly Research Center, Kyoto University Graduate School of Medicine, Kyoto, Japan
Synopsis
Keywords: Brain Connectivity, Microstructure
Brain structures of human embryos are several tens of micrometers in size, and MR microscopy is essential for elucidating human embryos. However, conventional fast T1-weighted imaging could not delineate some critical structures. In this study, T1, T2, and T2* values were measured to simulate the contrast of each tissue of the human embryo brain, and MR images were acquired at the extremely high resolution of (30 μm)3 using pulse sequences that emphasized the contrast difference in the brain structures. This technique would unveil the three-dimensional microstructure and developmental process of the brain’s central nervous system in its early stages.Introduction
MR microscopy is essential for human embryology to reveal structures in the brain, such as nerves and encephalic vesicles, which have structures tens of micrometers in size and for imaging valuable samples because it is non-destructive. Until now, short TR T1-weighted sequences have often been used because the emphasis has been on imaging large numbers of human embryo specimens with higher spatial resolution in a short period [1-3]. However, because the delicate structures in a sample have complex T1, T2, and T2* distributions, some structures cannot be delineated with a single sequence because of obscured contrast. In this study, we focused on the layered structures of the terminal cortex and accessory nerves of a human embryo specimen at the Carnegie stage (CS) of 23 and determined the sequence parameter that would make each of them most apparent. Furthermore, using the high-resolution imaging technique we presented [4,5], we acquired the MR images with a voxel size of (30 µm)3, which enhanced T1 contrast in layered structures of the terminal cortex and T2* contrast of accessory nerves.Material
A human embryo at a stage of development CS23 (crown-up length=27 mm) (Fig.1(a)) fixed by 1% agarose gel in an NMR tube (inner/outer diameter =13/15mm) was used for measurement.Method
MR microscopy systemWe used a 9.4 T (Oxford Instruments) NMR vertical superconducting magnet (bore diameter=89mm) (Fig.1(b)) and a digital console (DTRX, MRTechnology, Japan). We used a cylindrical gradient coil with a gradient efficiency of up to 1.42 [G/cm/A] was used (Fig. 1(c)) and fabricated a solenoid-type RF coil with a diameter of 15 mm and a length of 30 mm to fit the size of the NMR tube (Fig. 1(d,e)).
Pulse sequence
1) T1,T2,T2* measurement
We measured T1, T2, and T2* values with matrix size=400×2402 and voxel size of (60 um)3. We used spin echo sequences to measure T1 ( TE=12 ms, TR=200, 400, 800 ms) and T2 (TR=800 ms, TE=12, 24, 36 ms) and steady-state free precession (SSFP) sequences to measure T2* (TR=800 ms and TE=4,8,12,24 ms).
2) Contrast simulation and determination of sequence parameter
From the theoretical equations for the signal intensity of the SE sequence and the SSFP sequence [6] and T1, T2, T2* value, we simulated the TR and TE dependence of the signal intensity difference between different tissues at each flip angle (FA), determined the parameters with the most significant contrast among them. The imaging was performed with matrix size=400×2402 and voxel size=(60 µm)3. To confirm the validity of the sequence, a comparison experiment was conducted using the method shown in each figure. However, due to hardware limitations, the lower limit of TR was set to 200 ms, and the upper limit of TR was set to 800 ms to prevent long imaging time. The upper limit of TE was set to 12 ms because longer TE may cause artifacts.
3) High-resolution imaging
The pulse sequence of parameters determined in 2) was used with matrix size=800×4802 and voxel size=(30 µm)3, and the results were compared with the stained images.
Result
Cerebral cortexFig. 2 (a), (b) and (c) show the T1, T2, and T2* values in the axial section. From this result and Fig. 3 (a), (b), and (c), the sequence with TR=200~400 ms and TE as short as possible was effective to obtain clear contrast in the cerebral cortex. As shown in Fig. 3 (d), (e), (f), and (g), the contrast in the terminal cortex was actually clearer with FA=50° and TR=800 ms than with the expected sequence .The MR image in Fig. 5(a) reflected the structure of the four layers in the cerebral cortex in the stained image in Fig. 5(b).
Accessory nerves
Fig. 2(d), (e), and (f) show the T1, T2, and T2* values of the axial section. The accessory nerve had T2/T2*=20/20 ms and the surrounding tissue had T2/T2*=40/60 ms . From the agarose gel and background areas, T2* was considered to be offset throughout.
Fig. 4(a), (b), and (c) show that the longer TE and TR were, the more effective the SSFP sequence was and shows that sufficient contrast was obtained even when FA=30°, so the SSFP sequence with TR=400 ms/TE=12 ms was selected to shorten the imaging time. Also, from Fig.4(d), (f), and (f), the accessory nerve and surrounding tissue showed clear contrast in the expected sequence. Fig. 5(c) shows that the accessory nerves are about 100 µm.
Discussion
We could delineate human embryo telencephalic structures and accessory nerves in a human embryo specimen at the CS of 23 from MR images of voxel size of (30 µm)3, each with different contrast. The structures within the cerebral cortex showed a more apparent contrast with longer TRs and shallower FAs than expected. This may be because the short TR and deep FA were strongly influenced by the residual transverse magnetization before the subsequent RF pulse irradiation, while the effect of T2 remained.In addition, the accessory nerve and surrounding structures may have been able to reduce the effect of T1 even in short TRs by making the FA shallower. Since the human embryo brain has diverse contrasts, selecting a sequence appropriate for the target object is essential.Acknowledgements
No acknowledgement found.References
[1] Martin Lhuaire, Agathe Martinez, Hervé Kaplan, Jean-Marc Nuzillard, Yohann Renard, Romain Tonnelet, Marc Braund, Claude Avisse, Marc Labrousse. Human developmental anatomy: Microscopic magnetic resonance imaging (μMRI) of four human embryos (from Carnegie Stage 10 to 20). Annals of Anatomy 196 (2014) 402–409 .
[2] Yosuke Otake, Shinya Handa, Katsumi Kose, Kohei Shiota, Shigehito Yamada, Chigako Uwabe. Magnetic Resonance Microscopy of Chemically Fixed Human Embryos at High Spatial Resolution. Magn Reson Med Sci 14(2), 153-158 (2014).
[3] Katsumi Kose. Magnetic Resonance Microscopy of Chemically Fixed Human Embryos Performed in University of Tsukuba Since 1999 to 2015. THE ANATOMICAL RECORD 301:987–997 (2018).
[4] Kazuyuki Makihara, Kazuki Kunieda, Shigehito Yamada, Katsumi Kose, and Yasuhiko Terada. MR microscopy of human embryo at high isotropic spatial resolution 07-12 May 2022, ISMRM & SMRT Annual Meeting & Exhibition. (3240).
[5] Seitaro Hashimoto, Katsumi Kose, Tomoyuki Haishi.Comparison of Analog and Digital Transceiver Systems for MR Imaging.Magn Reson Med Sci 13(4), 285-291 (2014).
[6] Bernstein, M. A., King, K. F., & Zhou, X. J. (2004). Handbook of MRI pulse sequences. Elsevier.
Figures
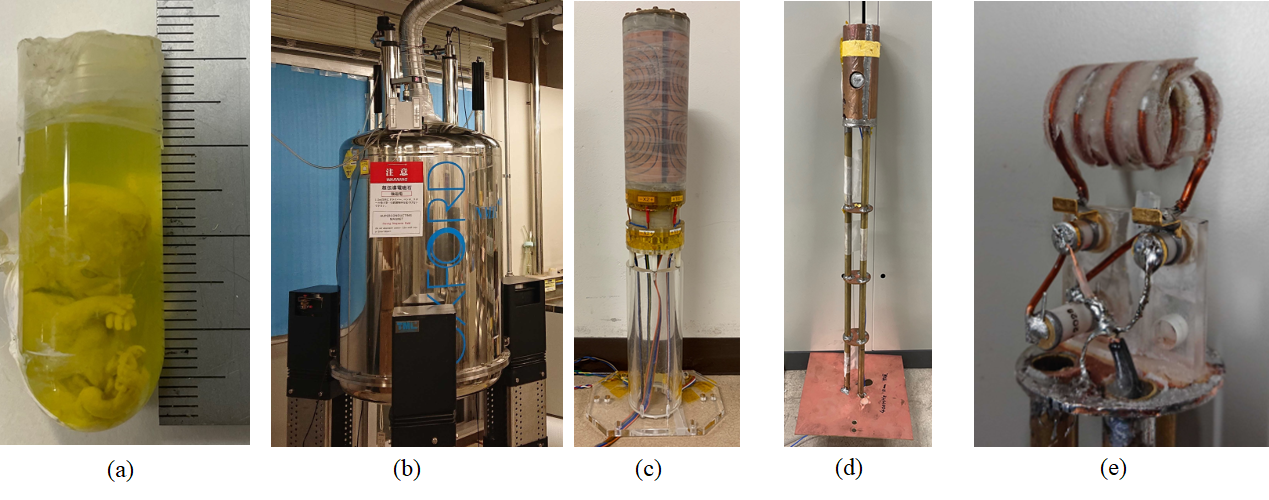
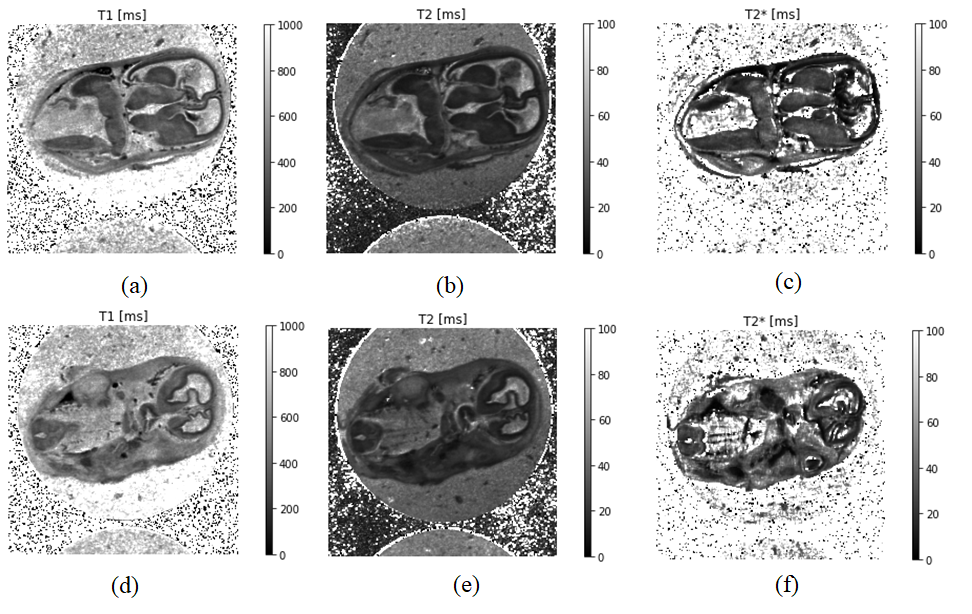
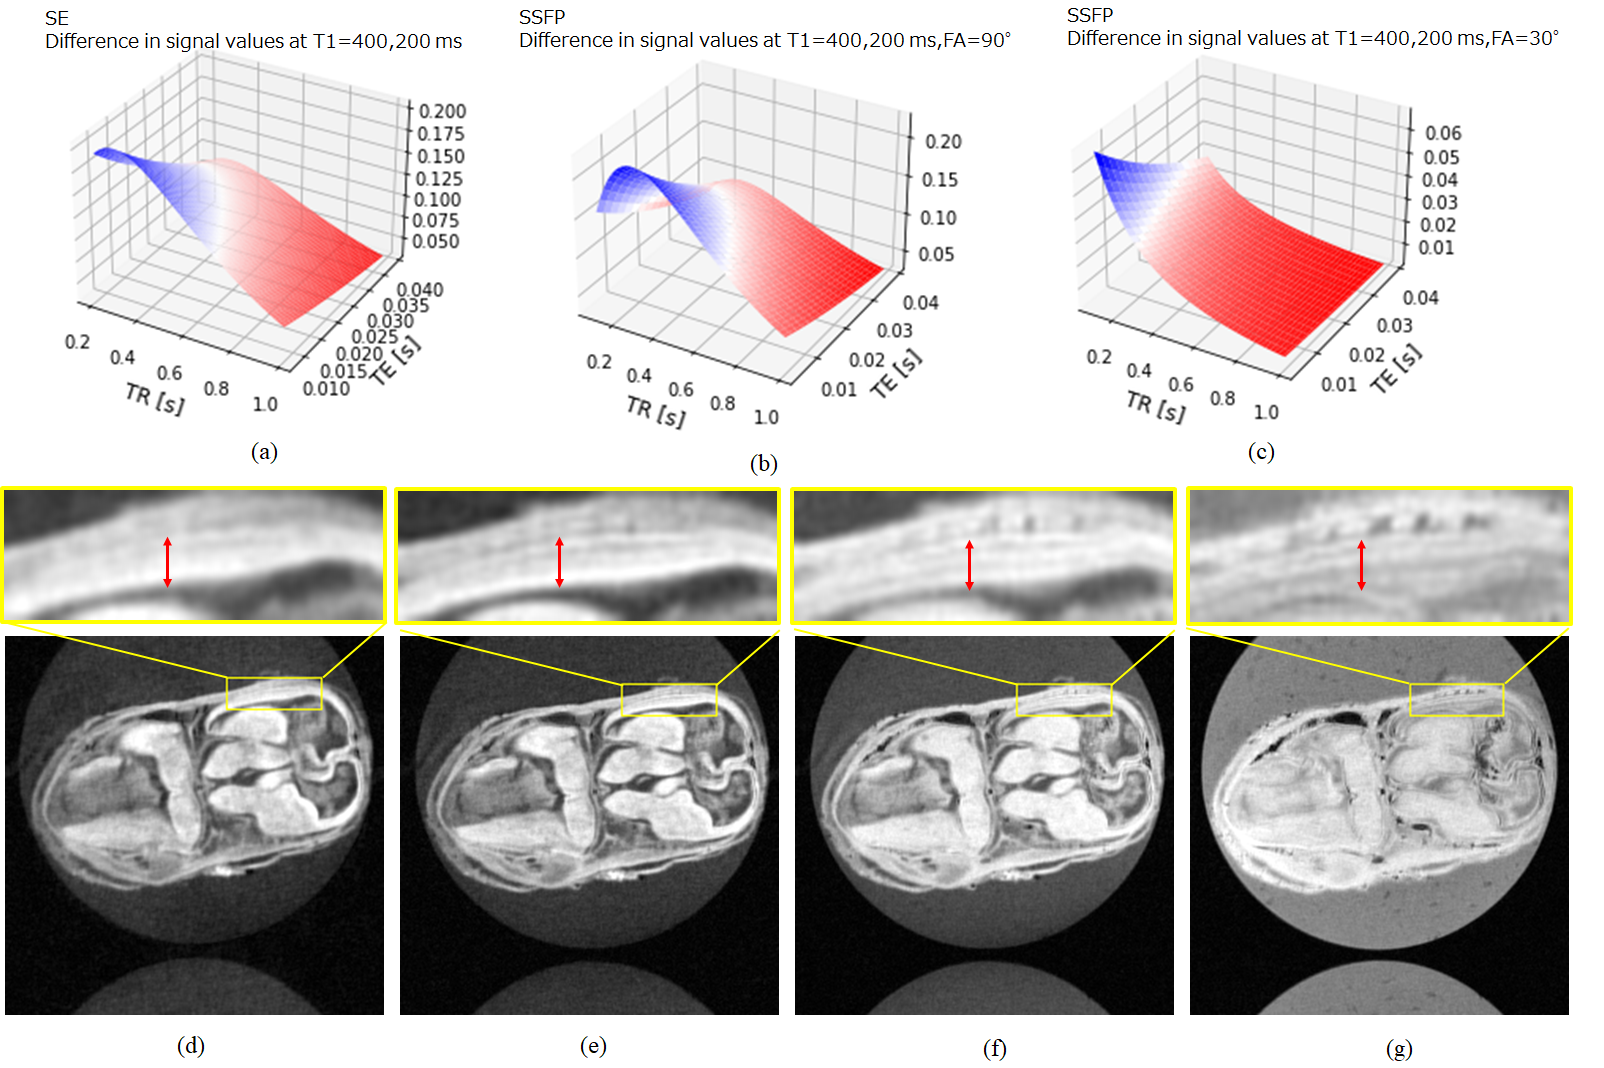
Fig.3 (a-c) Contrast simulation for TR and TE dependence of contrast at two T1 values. (a) SE sequence. (b) SSFP sequence, FA=90°. (c) SSFP sequence, FA=30°. (d-g) Red arrows indicate the cerebral cortex. Determination of sequence parameters for (d) TR=200 ms, TE=4 ms, FA=90°. (e) TR=400 ms, TE=4 ms, FA=90°. (f) TR=800 ms, TE=4 ms, FA=90°. (g) TR=800 ms, TE=4.56 ms, FA=50°.
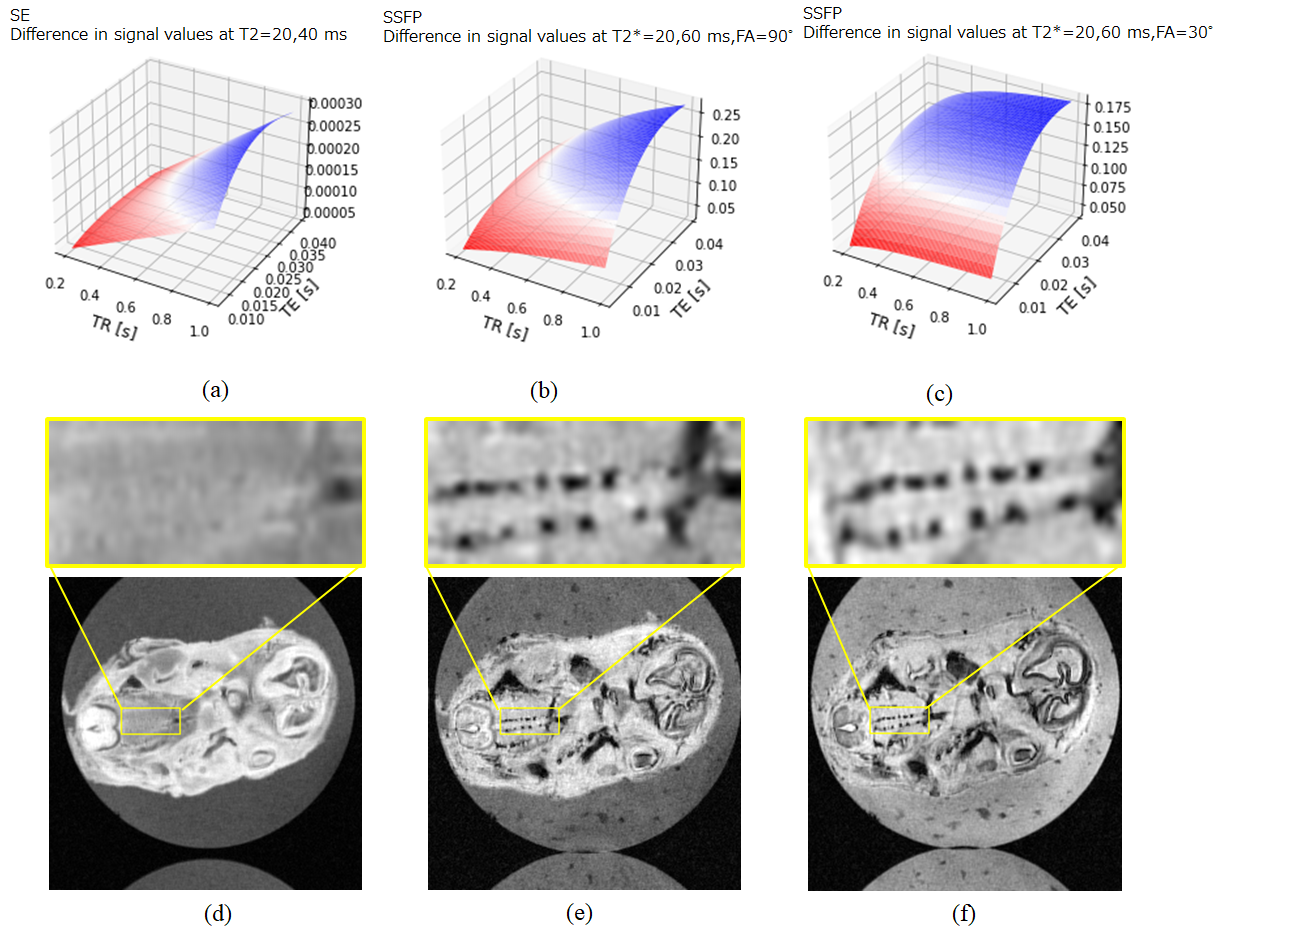
Fig.4 (a-c) Contrast simulation of TR, TE dependence of contrast at two T2 or T2* values. (a) SE sequence. (b) SSFP sequence, FA=90°. (c) SSFP sequence, FA=30°. (d-f) Determination of sequence parameters. (d) TR/TE=800/4 ms, FA=90°. (e) TR/TE=800/12 ms, FA=90°. (f) TR/TE=400/12 ms, FA=30°.
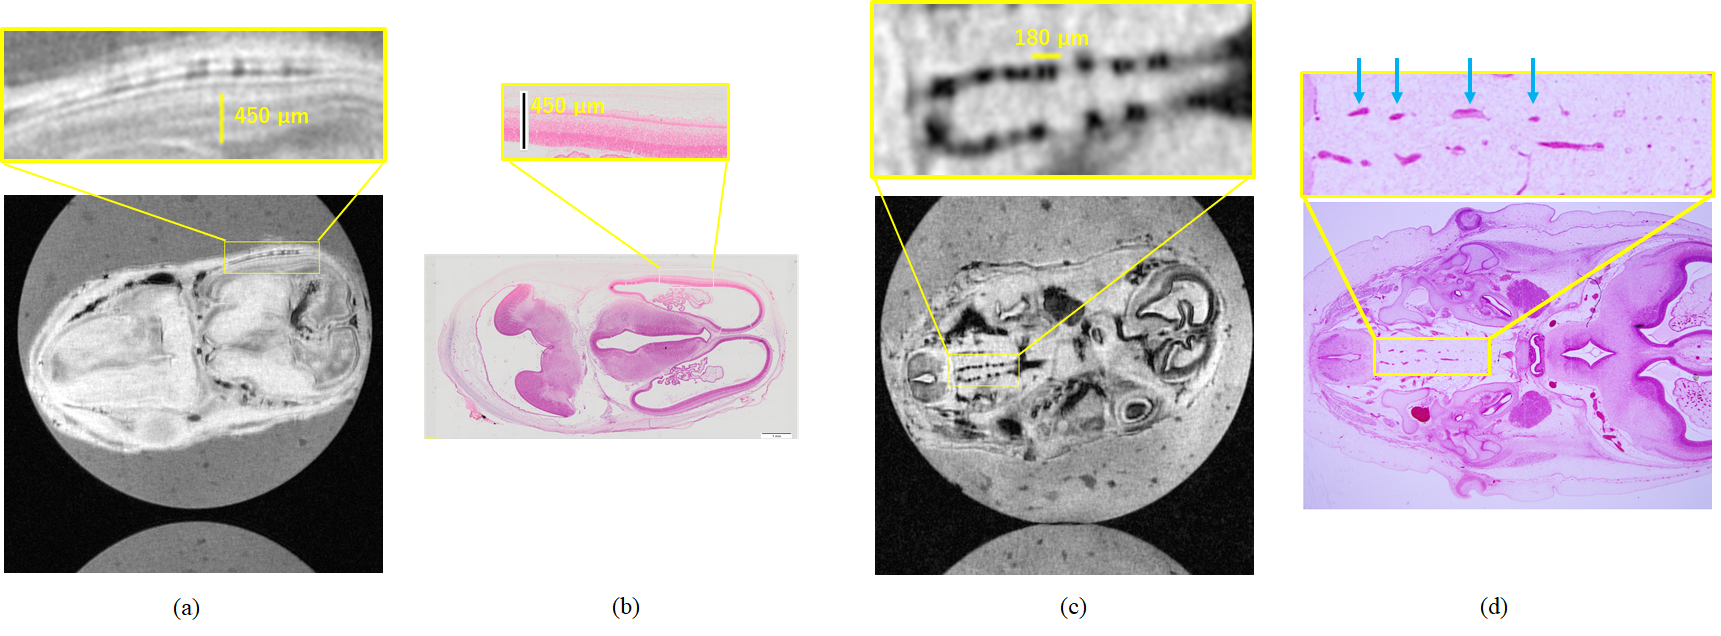
Fig.5 High-resolution images and stain images. (a) MR image of the cerebral cortex. (b) Stained image of the cerebral cortex. (c) MR image of accessory nerves. (d) Stained image of accessory nerves. Blue arrows indicate the accessory nerves.