3558
Visualization of Deep Brain Stimulation Targets at 0.5T
Chad Harris1, Andrew Curtis1, Curtis Wiens1, Jurgen Germann2,3, Alexandre Boutet2,3, Andres M Lozano2,3, and Jeff Stainsby1
1MR, Synaptive Medical, Toronto, ON, Canada, 2University Health Network, Toronto, ON, Canada, 3University of Toronto, Toronto, ON, Canada
1MR, Synaptive Medical, Toronto, ON, Canada, 2University Health Network, Toronto, ON, Canada, 3University of Toronto, Toronto, ON, Canada
Synopsis
Keywords: Epilepsy, Contrast Mechanisms
The utility of visualizing deep brain stimulation targets at 0.5T was explored. 3D SWI images show direct visualization of the subthalamic nuclei and surrounding iron-rich structures. With the excellent gray-white matter contrast possible at mid-field, 3D T1-weighted imaging can directly visualize the globus pallidus interna. The elevated T1 contrast produces excellent 3D T1-weighted imaging at multiple inversion times which are suitable for, and aid in, atlas-based segmentation approaches for DBS targeting.Introduction
Deep brain stimulation (DBS) is a well-established neurosurgical treatment option for patients presenting with medication-refractory movement disorders or neuropsychiatric indications. Pre-operative MR imaging is a critical component for visualization of the intended target structure, for subsequent surgical planning, and is employed to confirm lead placement. Direct visualization of the subthalamic nucleus (STN) and globus pallidus interna (GPi) are beneficial for surgical planning, forming the primary anatomic targets for DBS in Parkinson’s disease[1, 2]. In addition, many centers are now transitioning to atlas-based targeting – particularly when the target is indetectable on standard MR sequences - whereby the DBS target is defined on an anatomic atlas registered to the patient’s MR data. This atlas-based approach has been implemented for segmenting and targeting the thalamus to treat essential tremor [3], and for structures such as the substantia nigra and red nuclei for targeting the STN. Effective atlas registration critically depends on clear and reliable depictions of structures near the DBS targets.Different MRI protocols have been developed with the goal of improving visualization of specific anatomic structures used in DBS planning. Susceptibility weighted imaging (SWI) has been shown to improve direct visualization of iron-rich structures such as the substantia nigra (SN), red nuclei and the STN [4,5]. Various T1-weighted imaging methods have been proposed to increase the contrast of the thalamus and GPi [6] as well as subcortical structures near the STN and these images are commonly used by atlas-based registration methods [9,10].
High-field MR imaging is considered the gold standard for pre-operative DBS targeting [5] but raises concerns for post-operative imaging with DBS leads in place due to image degradation and field-dependent RF-induced heating [7]. SWI or T2 imaging are often employed at high-field as the convergence of T1 values between tissues makes direct visualization of targets difficult on T1-weighted images.
In this work we explore the feasibility of imaging DBS targets at mid-field (0.5T), looking specifically to leverage the increased range of tissue T1 value as compared to high field. Fischer et al [8] demonstrated that T1-mediated brain tissue contrast should be optimized at mid-field (approximately between 0.25-0.5T), their results suggest that T1-contrast at 0.5T should be nearly 3-times greater than at 3T. This implies that clear and reliable T1-based imaging of deep brain structures should be possible at 0.5T despite the lower absolute polarization.
Methods
3D SWI and 3D MPRAGE images were acquired using a head-only 0.5 T system (Synaptive Medical, Toronto) equipped with an 8-channel head coil. Imaging was performed on healthy volunteers with informed consent, in compliance with health and safety protocols. SWI images were acquired in 2 subjects using a multi-echo gradient echo acquisition (echo spacing 9.5 ms, TR 105 ms, 1x1x3mm3 resolution, 9 cm slab, 10 echoes, 9:15 min). MPRAGE data with various inversion times were acquired in 3 subjects (TR 1600 ms, 1x1x1mm3 resolution, 25x25x25cm3 FOV, 12 min, TI 215, 415, or 515 ms) and were evaluated for direct visualization of DBS targets, nearby brain structures, and for applications of atlas-based registrations. The feasibility of routine atlas-based segmentation was demonstrated using both the approaches of Neudorfer[9] and Iglesias[10].Results
3D SWI images clearly depict the STN and surrounding structures (eg. red nuclei and substantia nigra) (Figure 1). T1-weighted MPRAGE images were able to distinguish the two regions of the globus pallidus and identify the GPi at certain inversion times, (Figure 2). T1-weighted imaging was also able to depict structures near DBS targets with varied contrast depending on the selected inversion time, for example Figure 3a-3b shows the substantia nigra with negative contrast at TI=415ms and positive contrast at TI=215ms. The strong positive contrast of the substantia nigra, facilitating a robust atlas-based segmentation based on Neudorfer, is demonstrated in Figure 3c. Robust T1 contrast of the thalamus across multiple inversion times is used to illustrate the atlas-based registration and segmentation of thalamic nuclei using the approach of Iglesias in Figure 4.Discussion
While T2* and SWI based contrast generally scales with field strength, the use of long echo trains leverages the long T2* relaxation times in brain tissue at 0.5T, and results in SWI imaging that is sufficiently sensitive to iron-rich structures such as the STN and red nuclei to provide clear delineation of these structures. The increased T1 contrast available at mid-field allows for direct visualization of the GPi in MPRAGE scans, with the appropriate selection of inversion times. Furthermore, the increased T1 contrast enables excellent visualization of a multitude of deep brain structures which can be tailored for atlas-based registration. To achieve acceptable image quality, scan times were relatively long (10-12min). However, these times are comparable to many proposed for use at 3T [6,11]. We also note that while in theory the geometric distortion and RF-induced heating around DBS leads in post-operative imaging should be significantly improved at 0.5T compared to high-field, the specific image quality and safety profile around DBS leads still needs to be verified.Conclusions
Imaging at 0.5T can provide direct visualization of common DBS targets and surrounding structures. The use of 0.5T for pre- and post-operative imaging in DBS appears to be feasible for both direct visualization of structures and for atlas-based DBS targeting.Acknowledgements
The authors would like to thank Vatche Baboyan for helpful discussions related to DBS targeting.References
- P Pollak et al, Rev Neurol, 1993
- J Siegfried et al, Neurosurgury, 1994
- DJ Segar, et al, J Neurosurg, 2021
- AT Vertinsky, et al, AJNR, 2009
- ZH Cho, et al. J Neurosurg, 2010
- A. Sudhyadhom, et al, NeuroImage, 2009
- I Connell, et al, Proc ASNR, 2019
- HW Fischer et al, MRM, 1990
- C Neudorfer et al, Sci Data, 2020
- JE Iglesias, Neuroimage, 2018
- B Bender et al, AJNR, 2011
Figures
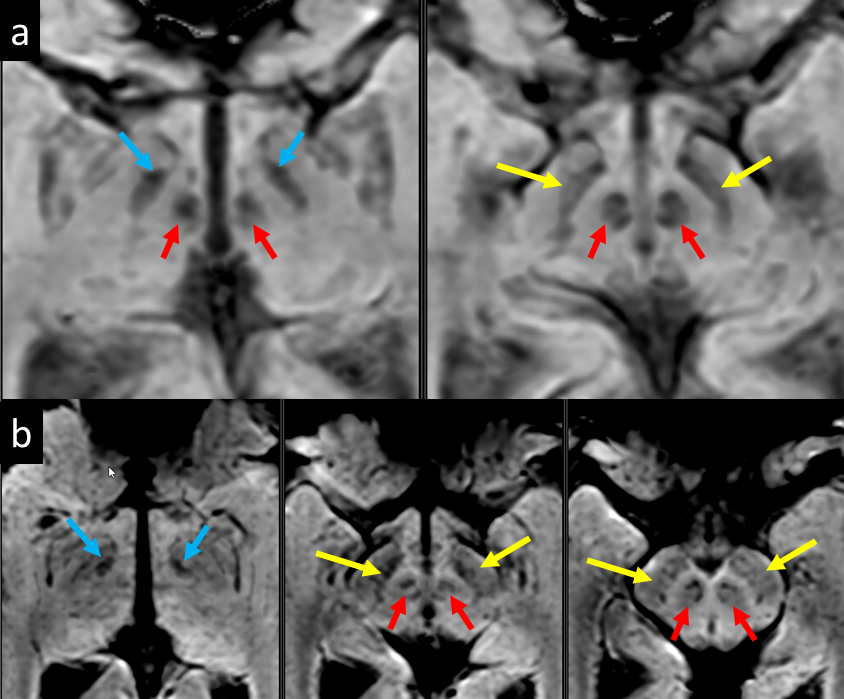
Figure 1 : 3D SWI images
from 2 subjects. Images of two (a) and three (b) consecutive axial slices illustrating
direct visualization of the STN (blue arrows), substantia nigra (yellow arrows)
and red nuclei (red arrows), and surrounding structures at the level of the
midbrain.
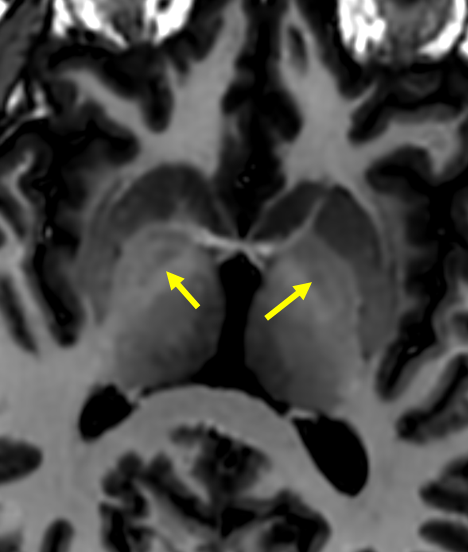
Figure
2: Strong T1 contrast at 0.5T enables direct visualization of the GPi (yellow
arrows) using MPRAGE with an inversion time (515 ms) tuned to provide excellent
gray-white matter contrast.
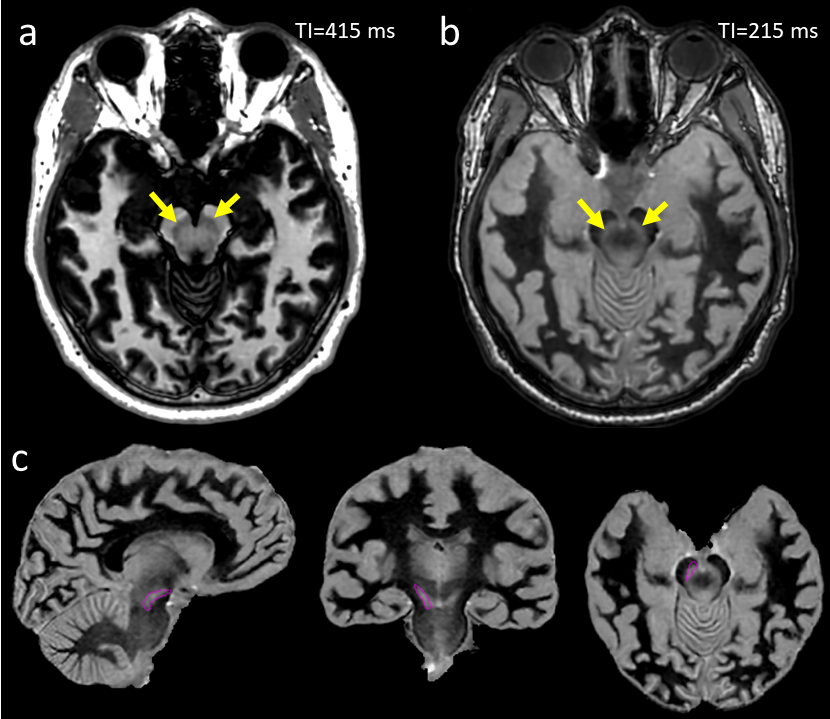
Figure 3: Different TI times in
MPRAGE results in the visualization of deep brain structures with different
contrasts. Examples showing negative (a) and positive (b) contrast in the
substantia nigra (yellow arrows) are shown. With positive contrast, atlas-based
segmentation (c) can easily identify the substantia nigra (purple contour) and
other structures neighbouring the STN.
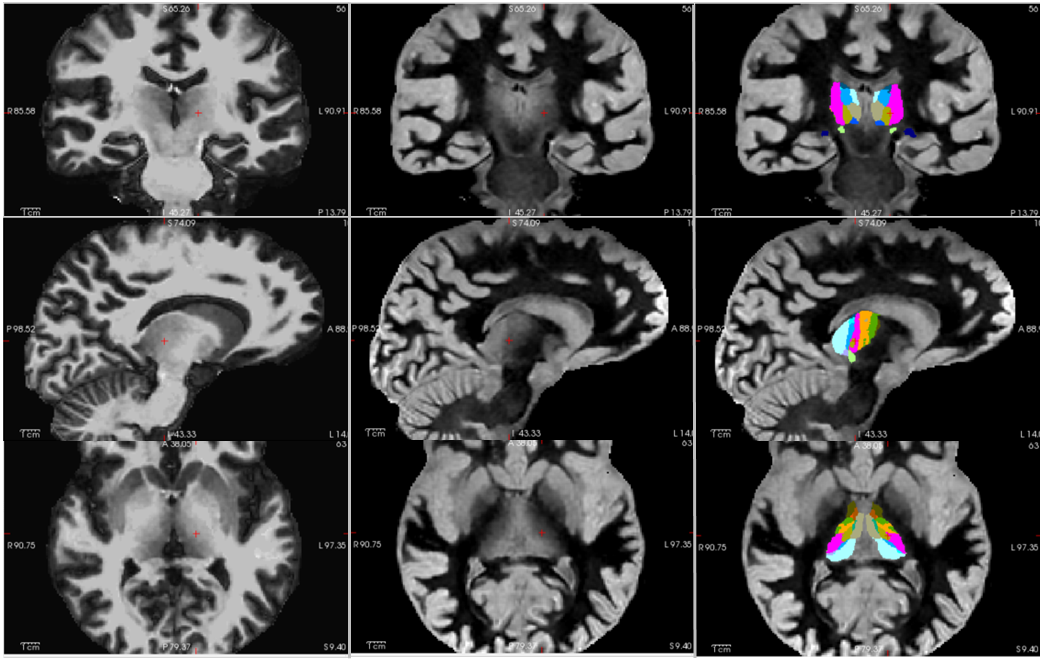
Figure 4: Atlas-based fits of
thalamic subregions is improved when robust T1 contrast at varied inversion
times are provided as inputs. An example of input data with suppressed gray
matter tissue signal (left), suppressed white matter tissue signal (middle) and
the resulting registration of the thalamus and thalamic subregions (right) that
can be used for DBS targeting is shown.
DOI: https://doi.org/10.58530/2023/3558